TL;DR
- SRE observability — the practice of instrumenting systems so that site reliability engineers can infer internal state from external outputs like logs, metrics, and traces (the three pillars of observability) — is supposed to be the foundation that makes incident response possible. But when you put an AI copilot on top of that foundation, the cracks show fast.
- AI SRE fails on missing data, not missing IQ. Most can't find root causes because they’re built on legacy observability stacks with short retention, missing high-cardinality data, and slow queries.
- An AI SRE is an LLM + SQL over a rich observability + context layer. An effective copilot requires a fast, scalable data substrate that retains full-fidelity telemetry for extended periods, along with a context layer to address gaps.
- ClickHouse-style OLAP is an ideal database for building an AI SRE copilot foundation. ClickHouse makes long-retention, high-cardinality observability practical, and hence a perfect choice for building an AI SRE copilot.
- The Payoff: AI as a force multiplier for human expertise. A real AI SRE searches, correlates, and summarizes so that on-call engineers can focus on decisions.
It’s 2:13 a.m.
Your AI SRE copilot has a confident answer: “Error rates in checkout increased because the Payment service is slow.”
Twenty minutes later, you discover the real issue was a bad feature flag rollout. The “copilot” just narrates your dashboards. That’s not a copilot. That’s a chat UI for your graphs.
AI SRE tools promised to transform incident response. However, most of the implementations have been disappointing. They all point an LLM at observability data, and try to explain what broke and why. And that doesn’t work.
When I led the platform and storage teams at Confluent and pushed availability SLA from 99.9 to 99.95, I learned something counterintuitive about incidents. A bulk of incidents ended with one of three crude corrective actions: roll back a bad change, restart an unhealthy component, or scale up capacity to absorb load.
Applying the fix usually took minutes. The hard part was figuring out the root cause.
Was the problem a bad configuration, a noisy neighbor, a control plane deadlock, or a subtle storage regression? Answering that question required an investigation, not just a runbook.
Many AI SRE tools fall short here. They lean toward automated remediation or market themselves as self-healing systems, which proves both risky and unnecessary in most real environments. Other tools focus more on correlation, summarization, and alert reduction.
Across both camps, the same constraint emerges: they try to reason at scale on top of an observability substrate not designed for AI-first investigation. As a result, most AI SRE products have been underwhelming.
Let's be real, the goal isn't to build a bot that restarts your databases. An AI SRE is an investigator who analyzes data so the on-call human can make a decision.
The AI hunts. The human decides.
This Human-in-the-Loop approach solves the real bottleneck (Mean Time to Understand, or MTTU) without the risks of auto-remediation.
The ClickHouse engineering team recently tested whether frontier models could autonomously identify root causes from real observability data. The finding was both uncomfortable and useful. Even GPT-5 couldn't do it reliably, even with access to detailed telemetry. The real constraint:
"The bottleneck is not model IQ; it is missing context, weak grounding, and no domain specialization."
The limiting factor was the data substrate, not the LLM. The models could read logs and metrics, but they were looking at short retention windows, incomplete dimensions, and fragmented context. They were reasoning over partial information.
I now think about this problem in two layers. First, build an observability foundation that actually captures the information an AI investigator needs, with the right economics and query profile. Second, use AI for what it excels at: reducing time-consuming work on correlation, pattern matching, and narrative, while engineers retain control over actions.
This article shows how to address this gap by building an AI SRE copilot for on-call engineers on a solid observability foundation.
What causes AI SRE tools to fail in production
Many AI SRE products are thin layers on top of older observability platforms. They inherit the economic and architectural constraints of those systems, and they hit the same ceiling in three predictable ways.
Problem 1: The retention problem
Most legacy observability platforms that grew up around search-first, inverted-index architectures charge primarily based on ingestion volume. At scale, this pricing model pushes teams toward aggressively short retention. Teams typically retain 7 to 14 days of logs, with a slightly longer window for coarse metrics. While they may retain older data in “cold tiers”, these rarely deliver the query access times required for agentic-based analysis.
For an AI SRE copilot, short retention removes historical memory. A model investigating a checkout failure today can't see that the same pattern occurred six weeks ago after a similar deployment, because those logs no longer exist.
Seasonal patterns, rare edge cases, and long-tail incidents become invisible.
From a reliability perspective, every incident looks like the first time. The model can't learn from the organization's own history, and no amount of prompt engineering fixes missing data.
If your logs can’t remember more than two weeks, neither can your AI SRE.
Problem 2: The cardinality problem
To control cost and performance in search-first systems, teams routinely drop high-cardinality dimensions. User IDs, session IDs, request IDs, detailed error codes, and fine-grained labels often get removed because they increase index size and query latency in inverted index engines.
These fields are exactly what an AI SRE needs to correlate events.
The golden signals — latency, traffic, errors, saturation — give SREs a starting point, but root cause analysis needs to go deeper. It usually connects a symptom to a specific subset of users, regions, deployments, or feature flags. If those dimensions aren't stored, the model sees only aggregate curves and generic error messages. It can describe that the error rate increased, but it can't answer which customers, which change, or along which path.
The full stack blindspot
At Confluent, the cardinality problem combined with stack complexity into a more painful pattern. Our architecture had a data plane, a control plane, and the underlying cloud infrastructure layer. Very few engineers, perhaps a handful in the entire organization, had a complete mental model of how a disk latency spike could ripple through to durability at the data layer. This is where the database SRE role becomes critical — someone who understands both the infrastructure layer and the data layer, and can bridge the gap when an incident spans both.
Incident response often became a human coordination problem. We frequently pulled five different teams on a call just to reconstruct a complete picture. Each team saw a different slice of metrics and logs in their own tools, so the real diagnosis happened in people's heads and in ad hoc conversations.
An AI SRE can only close that gap if data from all layers lives in one place.
When the control plane, data plane, cloud metrics, and application telemetry all live in ClickHouse, the copilot has no team boundaries. It can trace a request from the load balancer through the API layer and down to disk, bridging the visibility gap that humans struggle to cross during a tense outage.
Problem 3: The query speed problem
In the ClickHouse experiment, the team quantified how an AI agent actually behaves during an incident. An AI SRE operates in a loop: it forms a hypothesis, queries the data, refines its understanding, and queries again. Each investigation involved between 6 and 27 database queries as the model iterated.
A realistic workflow looks like this:
- Inspect recent errors for the impacted service.
- Break down errors by version and region.
- Cross-reference with deployments and feature flags.
- Pull traces for the slowest endpoints.
- Join with customer impact or business metrics.
If each query takes 20 to 30 seconds on a legacy observability platform, the feedback loop collapses. An AI-based workflow becomes painfully slow when every step waits minutes for data. The operator will always be faster using native dashboards.
Problem 4: The per-query tax
Human analysts and AI agents approach investigations differently. A human writes one or a handful of queries, waits for results, and examines the data.
An AI agent enters a "Chain of Thought" loop, firing up to 27 queries in a short time period to map dependencies, check outliers, and validate hypotheses.
If your observability data lives in a solution or database with per-query pricing (like New Relic or BigQuery), your AI agent will destroy your budget. If you're using a traditional database with strict concurrency limits, the agent spends more time waiting in the query queue than actually solving problems.
This leads to the core limitation: many AI SRE tools attempt to reason at scale on top of platforms not designed for high-volume, high-cardinality analytical queries with long retention. No prompt or fine-tuning can fully compensate for a data store that can't retain or serve what the copilot actually needs.
You can't "AI" your way out of a storage and query problem.
Get started today
Interested in seeing how ClickHouse works on your data? Get started with ClickHouse Cloud in minutes and receive $300 in free credits.
Sign upWhy ClickHouse is the right database for building an AI SRE Copilot
ClickHouse addresses three problems at their root: storage costs, high-cardinality performance, and query latency.
For observability workloads, modern observability solutions, such as ClickStack, which use ClickHouse as its core data engine, routinely achieve order-of-magnitude improvements over legacy observability platforms built on inverted indices.
At a high level, the differences look like this:
| Data problem | Legacy observability stacks built on inverted indices | ClickHouse-based observability |
|---|---|---|
| Retention | 7–14 days of full logs, then aggressive sampling or rollups | Months of full-fidelity logs, metrics, and traces at petabyte scale |
| Cardinality | High-cardinality dimensions dropped or pre-aggregated to control index size | Native support for billions of unique values with sparse indexing and compression |
| Query speed | Seconds to minutes for multi-dimensional aggregations | Sub-second scans and aggregates on billions of rows for typical incident queries |
| LLM Compatibility | Requires few-shot prompting or fine-tuning for custom DSLs. | Zero-shot compatible via standard SQL. |
The economics come from architecture, not marketing.
Columnar storage and compression = longer memory. Machine-generated logs and metrics compress extremely well when stored column-by-column. Real deployments often see 10x to 15x less storage compared to inverted index engines for the same raw telemetry volume. That difference translates directly into longer retention windows and more history for the copilot. For more on how raw event storage compares to pre-aggregated metrics in observability, see Is it over for metrics?.
Vectorized execution for analytical queries = the copilot’s feedback loop stays interactive. Incident queries rely on aggregations, filters, and time ranges. ClickHouse executes these operations in tight vectorized loops on compressed data. It can scan and aggregate billions of rows in a few milliseconds on modern hardware, keeping the AI feedback loop interactive even when the model issues dozens of queries.
Sparse primary indexes instead of global inverted indices = keep your high-cardinality fields. MergeTree tables in ClickHouse use ordered primary keys and lightweight indexes rather than heavy per-field inverted indices. This design tolerates high-cardinality dimensions, such as request IDs and user IDs, in the schema without causing catastrophic index growth.
Standard SQL = Zero-Shot Fluency. LLMs are trained on SQL from the entire internet. They struggle with proprietary query languages such as SPL, KQL, and PromQL. When you use a SQL-native database such as ClickHouse, you don't waste your context window teaching the model a new language or fine-tuning it on custom syntax. The model context focuses on the data, not the grammar.
When this storage engine powers a modern observability solution, the AI SRE copilot builds on a very different foundation. Retention spans months instead of days. Dimensions remain intact. Queries complete fast enough that a model can afford to iterate. This foundation gives AI the breadcrumbs it needs to traverse the stack.
How to solve the context window problem with SQL
Here's the common question: "How does an AI agent read months of logs with a 128k token limit?"
It doesn't. The database compresses the data. The agent uses SQL to scan petabytes of history and returns only the relevant insight (kilobytes) to the context window.
Legacy observability tools typically offer two modes: "search" (list logs) and "aggregations" (time-series metrics for line charts). ClickHouse offers full SQL.
Full SQL lets the agent run complex logic (joins, window functions, and subqueries) to filter signals from noise inside the database layer. This keeps data dumps out of the context window.
Note: You can absolutely build an AI SRE copilot without ClickHouse. Any database that gives you similar economics and query profiles can work. We’re biased because we’ve seen ClickHouse handle this at petabyte scale, but the architectural pattern matters more than the specific solution.
The reference observability architecture: AI copilot for SRE
With the data substrate in place, the AI SRE copilot becomes a precisely describable architectural pattern.
At a high level:
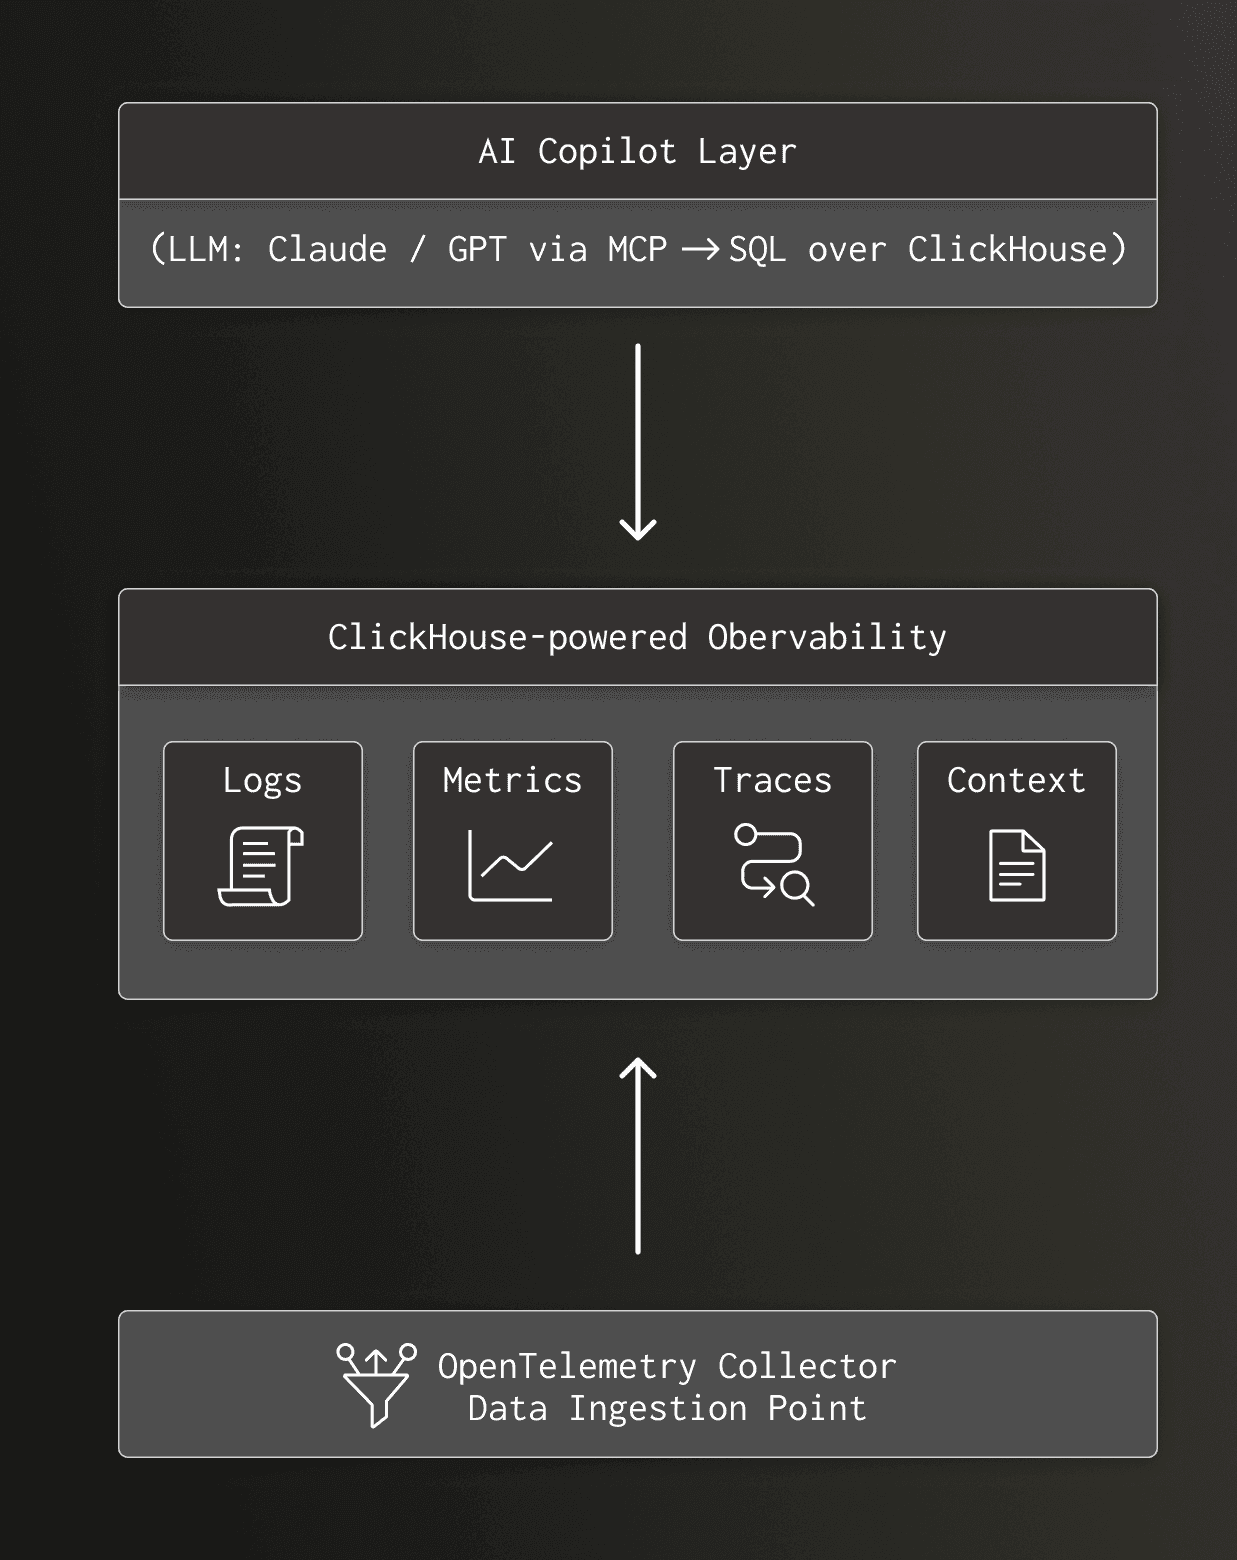
The key pieces are:
- OpenTelemetry collector Ships logs, metrics, and traces from applications, infrastructure, and services into ClickHouse. Different ingestion tools, such as Fluent Bit, Vector, and the OpenTelemetry Collector, can all converge on the same database.
- ClickHouse and the observability layer
- Logs stored in MergeTree tables with time, service, environment, and high-cardinality fields such as user_id and request_id.
- Metrics stored as raw events for full fidelity, with Materialized Views used only to accelerate common queries and dashboards. This means you can always re-aggregate by a new dimension, unlike systems that force rollups upfront.
- Traces are stored as span trees with trace_id, span_id, parent_span_id, service_name, and attributes.
- Context tables for deployments, feature flags, incidents, and customer signals.
- A simple logs table might look like:
CREATE TABLE otel_logs
(
Timestamp DateTime64(9),
ObservedTimestamp DateTime64(9),
-- Trace context
TraceId FixedString(32),
SpanId FixedString(16),
TraceFlags UInt8,
-- Severity
SeverityText LowCardinality(String),
SeverityNumber UInt8,
-- Body
Body String,
-- Common resource attributes
ServiceName LowCardinality(String),
ServiceNamespace LowCardinality(String),
DeploymentEnvironment LowCardinality(String),
-- Remaining resource attributes
ResourceAttributes Map(String, String),
-- Log attributes
LogAttributes Map(String, String),
-- Scope
ScopeName String,
ScopeVersion String
)
ENGINE = MergeTree
PARTITION BY toDate(Timestamp)
ORDER BY (ServiceName, Timestamp);- ClickHouse MCP server. The MCP server exposes ClickHouse to the LLM. The model doesn't receive raw credentials. Instead, it gets a catalog, a restricted SQL surface, and the ability to issue queries through a brokered channel.
In the ClickHouse experiment, the models issued between 6 and 27 SQL queries per incident investigation. That pattern works only because ClickHouse can handle that level of interactive querying across billions of rows without timing out.
- AI copilot layer. The copilot translates natural language questions into structured workflows. In the simplest case, this is just an LLM plus SQL. More advanced setups add retrieval-augmented generation and agentic routing, but the core remains the same: the model iteratively queries ClickHouse, inspects results, and refines its hypothesis. The same ClickHouse cluster can also power LLM observability — monitoring the AI agents themselves for latency, token usage, and hallucination rates.
For example, an on-call engineer might ask:
"Why did checkout error rates spike in us-east-1 in the last 20 minutes?"
A legacy tool might just show you the last hour. A ClickHouse-powered copilot can generate a query that scans months of history to confirm if this is a regression:
SELECT
min(Timestamp) AS first_seen,
max(Timestamp) AS last_seen,
count() AS errors
FROM otel_logs
WHERE
Timestamp >= now() - INTERVAL 30 DAY
AND ServiceName = 'checkout'
AND SeverityText = 'ERROR'
AND body ILIKE '%PaymentTimeout%'
AND ResourceAttributes['cloud.region'] = 'us-east-1'If the result shows first_seen was 10 minutes ago, the AI knows this is a fresh regression triggered by a recent change. If first_seen was 20 days ago, it directs the investigation elsewhere. This is only possible because the database can scan 30 days of logs in sub-seconds.
Fast execution combined with a rich schema makes this loop viable.
How to build a context layer for root cause accuracy
TL;DR: LLMs don’t need more vibes; they need the same context a senior SRE would gather manually.
In that ClickHouse experiment, the engineering team intentionally used simple, naive prompts to answer a narrow question: can a large model infer root causes directly from the kind of telemetry most organizations store today? The goal was to approximate how many AI SRE integrations behave out of the box, not to showcase an ideal, hand-tuned system with a custom retrieval layer.
That baseline matters. Better prompting and more sophisticated orchestration do help, and any serious deployment should use them. But they don't fix short retention, dropped dimensions, or missing context. If the database never stored the relevant history or topology, no prompt can retrieve it.
| Context type | Key question answered | Example data stored in ClickHouse |
|---|---|---|
| Deployment context | "What just changed in the system?" | A deployments table with commit_sha, version, author, and timestamp. |
| Service topology | "How are our systems related?" | Tables defining service dependency graphs, SLOs, and team ownership.* |
| Incident history | "Have we ever seen this before?" | An archive of past incidents, RCAs, and known failure modes, searchable via SQL. |
| Tribal knowledge | "What do our senior experts know?" | Vectorized embeddings of postmortems, wiki pages, and key Slack conversations for semantic search. |
*You can generate service maps dynamically from ClickHouse trace data, but a production-grade copilot shouldn't rely on telemetry alone. During real outages, telemetry often breaks or develops gaps. A "Source of Truth" for topology keeps the AI oriented when trace flows stop.
In real systems and production experience, models become significantly more reliable when they receive structured context that mirrors how human SREs think. That context can, and should, live alongside telemetry in ClickHouse.
Deployment context: what just changed?
The copilot needs to know what changed.
- Recent commits and authors
- Deployment events per service and environment
- Feature flag changes and rollout status
- Configuration updates
A deployment table might look like:
CREATE TABLE deployments
(
Timestamp DateTime64(9),
-- Service identification (matching otel_logs)
ServiceName LowCardinality(String),
ServiceNamespace LowCardinality(String),
ServiceVersion String,
-- Deployment context
DeploymentEnvironment LowCardinality(String),
DeploymentName String,
-- VCS/Git information
VcsRepositoryUrl String,
VcsCommitSha String,
VcsCommitAuthor String,
VcsCommitMessage String,
VcsBranch String,
-- Deployment metadata
ChangeType LowCardinality(String), -- e.g., 'rollout', 'rollback', 'hotfix'
DeploymentStatus LowCardinality(String), -- e.g., 'success', 'failed', 'in_progress'
-- Additional attributes
DeploymentAttributes Map(String, String)
)
ENGINE = MergeTree
PARTITION BY toDate(Timestamp)
ORDER BY (ServiceName, Timestamp);The copilot can then join error spikes to specific versions and authors.
Service topology and ownership: how are our systems related?
Topology and ownership are crucial for avoiding topology blindness, in which an agent focuses on the local failing service and misses the upstream dependency that actually failed.
- A service dependency graph, such as the caller, callee, and protocol
- Ownership mappings from service to team or pager group
- SLA/SLO definitions per service and endpoint
In ClickHouse, simple relational tables can represent this data and traverse it using recursive common table expressions over trace data when a multi-hop context is required.
Historical patterns and incidents: Have we seen this before?
Large models excel at pattern recognition when given representative examples.
- Past incidents with similar metrics and log signatures
- Known failure modes and playbook snippets per service
- Mappings from root cause to remediation steps
All of this can be indexed by service_name and tags, then retrieved through SQL before the model generates a summary or suggestion.
Context beyond traces and dashboards: What do our experts know?
During real incidents at Confluent, we didn't rely only on dashboards. We constantly hunted through Slack and other systems for soft signals.
Typical questions were:
- Has this happened before?
- Who last touched this service?
- Where is the postmortem from the similar outage last quarter?
We leaned heavily on previous incident logs, deployment announcements, and other ongoing incidents documented in chat. That tribal knowledge was critical, and it lived in unstructured text scattered across tools.
The context layer in ClickHouse isn't optional for an AI SRE. Storing logs and metrics isn't enough. You also need to ingest:
- Deployment history enriched with commit messages and rollout notes
- Incident archives and postmortems
- Summaries of Slack threads or incident channels
Implementation Note: Ingest vs. Federation (MCP)
You don't have to ETL everything into ClickHouse. You can use the Model Context Protocol (MCP) to enable the agent to query external tools (such as ArgoCD, GitHub, or Incident.io) directly.
This federated approach works well for data with complex permissions (such as Slack history) or data that changes constantly (such as "Who is on call right now?").
For the core correlation loop (connecting a metric spike to a deployment timestamp), co-locating the data in ClickHouse improves performance. The model can run a single SQL query that joins millions of log lines against deployment events, rather than making slow API calls to five different tools and trying to correlate them in the context window.
The ideal mix? Use MCP for "soft" context (Slack, Docs, PagerDuty state) and ClickHouse for "hard" context (Logs, Metrics, Deployment Events) that requires high-performance joins.
By having access to this context, the AI SRE starts to behave like the senior engineer who remembers the strange storage regression from six months ago. The copilot automates the retrieval of tribal knowledge that would otherwise vanish as people rotate off the team.
How rich context creates accurate insights
Without context, an incident query looks like:
"Users are reporting checkout failures. Find the root cause."
An effective AI SRE does more than pass raw text to a model. First, the orchestration layer queries ClickHouse for recent deployments, dependency health, and historical parallels. It then builds a grounded prompt, a data-rich set of instructions that gives the LLM everything it needs to respond accurately, zero-shot:
The grounded prompt (synthesized by the copilot engine): "Users are reporting checkout failures. The payment service had a deployment 47 minutes ago, commit abc123 by engineer X, version 2.3.7, in us-east-1. The payment service depends on the fraud service, which has shown elevated latency for the past 50 minutes. A similar incident occurred on 2025-03-15 with error code PAYMENT_TIMEOUT, where the root cause was cache saturation in the fraud service. Investigate the likely root cause."
The difference isn't stylistic. The second prompt encodes concrete facts from ClickHouse tables: deployments, traces, incidents, and metrics. The model grounds itself in the same information an experienced SRE would gather manually, which substantially increases the odds of a correct explanation.
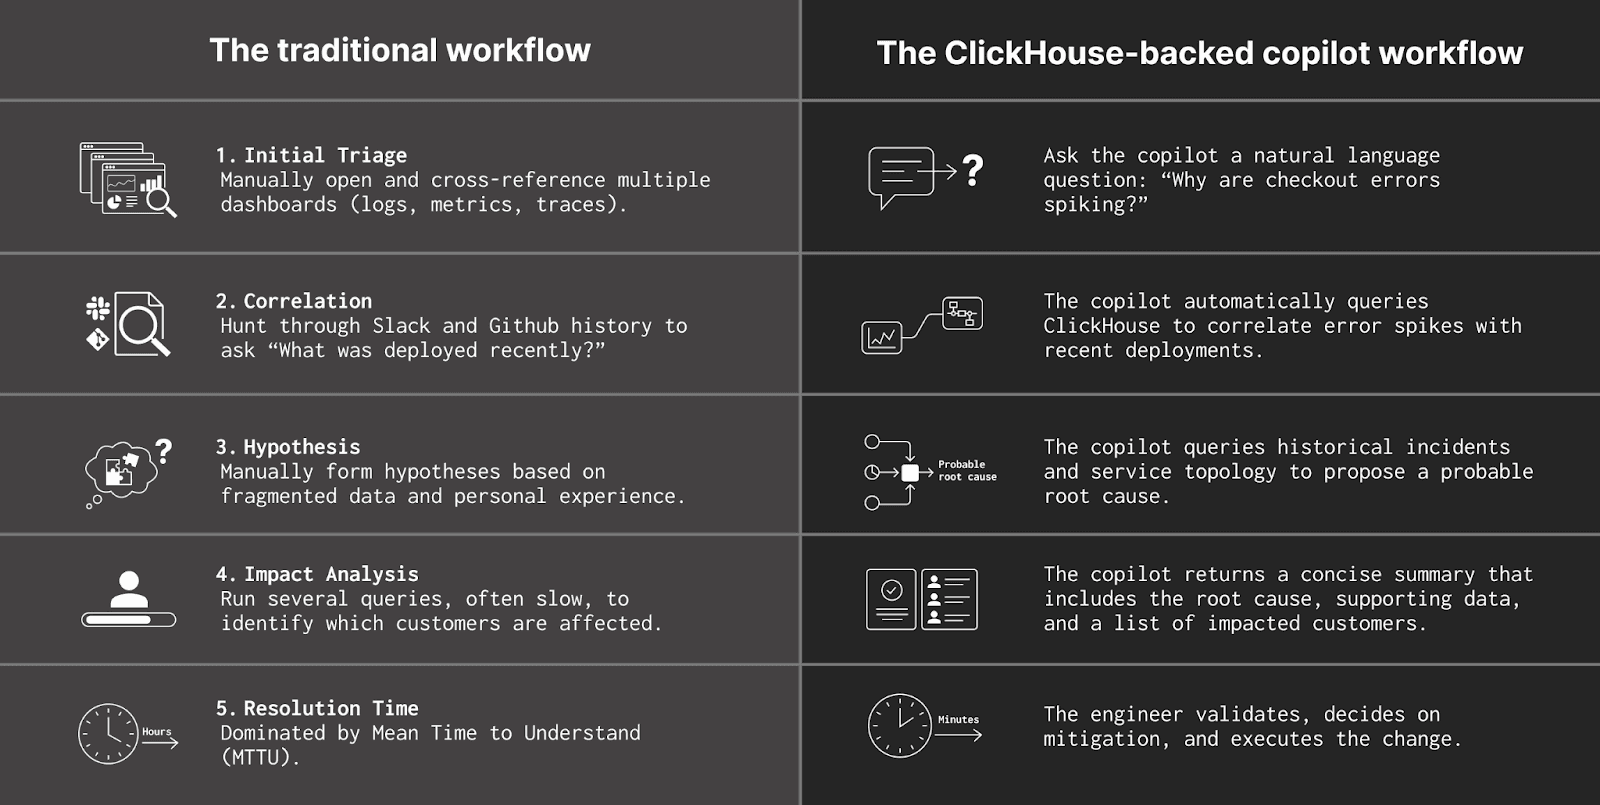
On-call engineers' workflow: before vs after an AI SRE
This system doesn't replace the on-call engineer. It supports the engineer when they wake up at 2 am to a buzzing pager.
The aftermath: Automating RCA and knowledge sharing
Reliability work doesn't end when the fire is out. At Confluent, a significant portion of on-call teams' time went into the aftermath: writing the root cause analysis document, assembling timelines, and ensuring learnings spread across a large, shared on-call rotation.
That work matters, but it's also repetitive. Engineers dig through shell history, query history, Slack channels, and dashboards to reconstruct what actually happened.
With a ClickHouse-based copilot, the system already has most of that information.
- It knows which queries ran during the incident and in what order.
- It sees which services, regions, and customers were impacted.
- It can correlate the mitigation actions with metrics returning to normal.
Because the copilot tracks the investigation in real time, it can draft the RCA for you. Instead of an engineer spending two hours reconstructing the incident, the copilot can generate a structured report with timelines, contributing factors, impact analysis, and links to relevant data.
The on-call engineer reviews and corrects the draft rather than starting from a blank page.
This also helps address a dissemination problem I repeatedly saw. Learnings spread poorly across engineers, mainly when a shared rotation exists, and a first-line-of-defense team changes over time.
When every incident produces a consistent, machine-readable RCA stored in ClickHouse, the entire organization becomes easier to search and easier to teach. The next on-call can ask the copilot, "Have we seen something like this before?" and immediately get back prior incidents, their timelines, and their fixes.
Independent research on production systems such as Microsoft's RCACopilot has already demonstrated that this pattern can significantly increase root-cause accuracy and shorten investigation time when the retrieval layer is well-designed and grounded in current telemetry.
My view aligns with those results. Use large language models to assist investigations, summarize findings, draft updates, and suggest next steps while engineers stay in control through a fast, searchable observability stack.
The database keeps real-time and historical data available. The copilot handles correlation and narrative. The human makes the final call.
The copilot doesn’t replace the on-call. It just lets them start on page 5 instead of page 1.
Going upstream: from faster RCA to fewer incidents
Once logs, metrics, traces, deployment context, topology, and customer signals live in a single, fast, queryable layer, something essential shifts. The same data foundation that powers an AI SRE copilot for incidents also supports upstream reliability work.
Several capabilities become feasible.
Pre-merge risk analysis. By correlating past incidents with specific code patterns, services, and deployment characteristics, teams can build models that flag risky pull requests before they are merged. The signal is learned directly from production history stored in ClickHouse, rather than from generic heuristics.
Proactive pattern detection. Queries that currently run during incidents can run continuously in the background. When a pattern that historically led to an outage reappears, the system can notify engineers before an incident occurs, giving them time to act.
Customer-centric reliability. Because customer and business impact live in the same database as telemetry, reliability work can be prioritized based on actual user pain rather than generic error counts. The copilot can answer questions such as "Which reliability issues affected our top ten customers this quarter?" or "Which services generate the most support tickets?"
This upstream angle is also what many AI SRE offerings miss today. If the only lever is incident response, the system remains perpetually reactive. When the observability foundation itself is AI-native, and ClickHouse serves as the core cognitive infrastructure, the organization can start reducing incident volume, not just resolving incidents faster.
Conclusion: build the foundation, own the future of operations
The pattern is clear.
- Build a cost-efficient, high-fidelity observability store on ClickHouse.
- Add a rich context layer for deployments, topology, incidents, and customers, including the soft signals that currently live in Slack and documents.
- Expose that substrate to an LLM copilot through MCP and carefully constrained SQL.
- Start with on-call assistance, then extend those capabilities to code review, testing, and planning.
The teams that make this architectural shift won't just have better AI SRE tools. They'll have a different reliability posture altogether, where incident response becomes a fallback rather than the default operating mode.
If your AI SRE project is stuck, don’t start with a new model. Start with a new database. Once observability is cheap, high-fidelity, and queryable, the copilot finally has something to be smart about.


