50.3k
50.3k
For those of you who can’t wait for these monthly ClickStack updates, we have weekly Demo Day videos. The dev team records demos of the features they’re working on, so you can see what’s taking shape before it reaches this newsletter. We share them in Slack too in the #o11y-clickstack channel.
Welcome to the August edition of What's New in ClickStack. Five releases shipped between v2.34 and v2.38, and dashboards took most of the attention.
Dashboard variables are now generally available. A filter's selection can be referenced anywhere in a tile, from raw SQL and builder fields to Lucene and PromQL, and one dropdown can narrow another. Charts also gained formulas, so two series on a chart can be combined into a rate or a ratio.
Two other additions make dashboards quicker to build and easier to read. A metrics explorer in the chart editor lets you browse what a deployment actually emits before you pick a metric.
Release markers overlay the moment each version of a service first appeared, so a latency spike can be lined up against the deploy that caused it.
We also shipped a beta LLM observability dashboard with Alerting receiving a long list of improvements, several of which came directly from user requests: up to ten notification targets per alert, alert names and tags, an evaluation history you can read over the API, and richer webhook payloads.
We’ll cover all of this below, alongside new dashboard filter types, OIDC authentication for the collector, and another round of MCP server improvements.
New contributors
Thank you to our open source contributors and to the users whose feedback shaped many of these features.
arj22, Vansh98789, truehazker, RIP21, espenloov, MFA-G, milansanjeev, Tyagiquamar, bsosnader, motsc
Contributing also doesn't have to mean writing code. Documentation fixes, ideas, feature requests, bug reports, and general feedback are all welcome through the repository. Small contributions count too, and each one improves ClickStack for the wider community.
Join the ClickStack Cloud waitlist
Get the performance and cost efficiency of ClickHouse in a fully managed observability service. With ClickStack Cloud, we handle the schemas, ingestion, and scaling.
Join the waitlistTime series engine for out-of-the-box Prometheus support
Many teams already store their logs and traces in ClickHouse, but bringing their Prometheus workloads across meant rewriting PromQL queries in SQL or maintaining a translation layer. For teams with existing Prometheus dashboards and tooling, we needed a way to support the query language they already used.
The TimeSeries engine and PromQL support are now in private preview in Managed ClickStack, and open source as experimental, allowing ClickHouse to replace Prometheus for storage and querying. You keep your existing collectors and scrape configuration, send metrics through Prometheus remote write, and query them using PromQL through ClickStack, Grafana, or directly in ClickHouse.
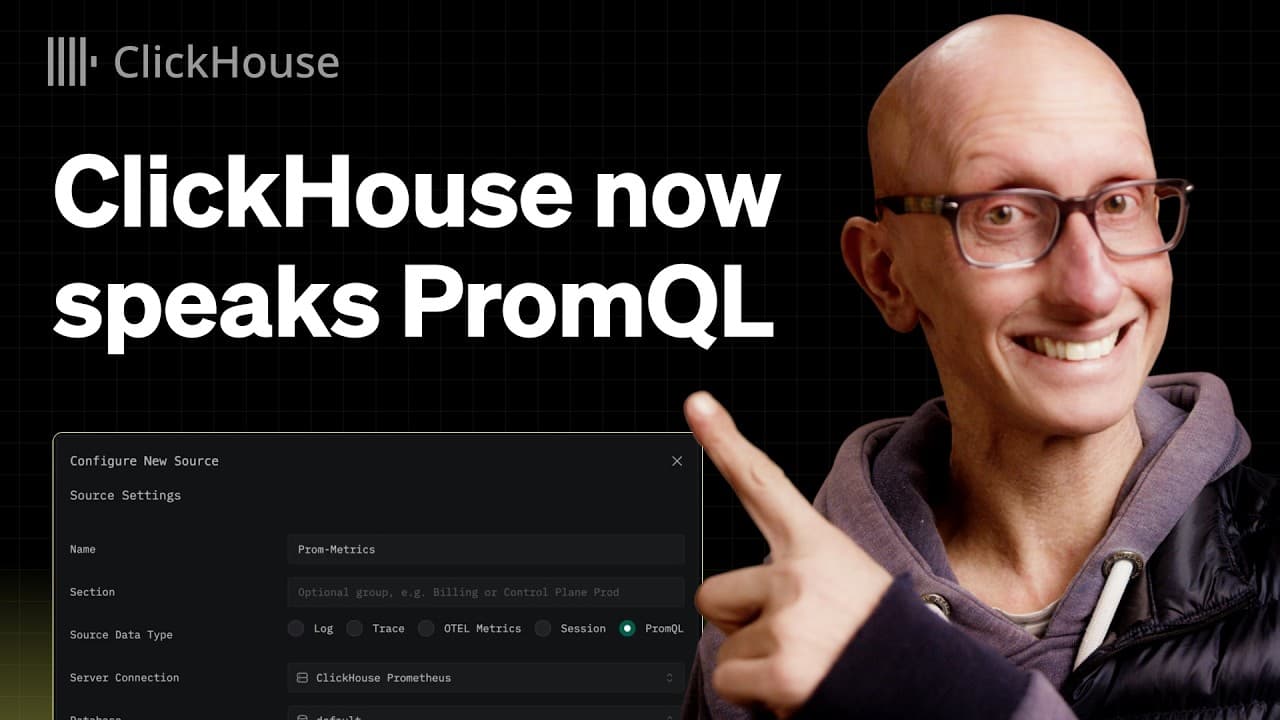
In ClickStack, you can configure a TimeSeries table as a PromQL data source and write PromQL directly in the chart editor. This lets you build dashboards with Prometheus metrics alongside your logs and traces. Dashboard variables, covered below, connect filters to those queries so you can explore services and environments without editing each expression. You can also connect ClickStack to an external Prometheus-compatible endpoint.
The preview focuses on storage, querying, and dashboards. PromQL coverage is still expanding, and a visual PromQL query builder and alerting on PromQL queries aren't supported yet.
Read the full announcement for the architecture and setup details, and to join the private preview to try it with your own metrics.
Dashboard variables
Historically, for dashboard filters, you would pick a value, and ClickStack would add a WHERE condition to every tile the filter applies to. This covers most cases, but not all of them.
Sometimes the selected value belongs in a SELECT expression, a HAVING clause, or a filter on a different column than the one the dropdown queries. With support for Prometheus data sources, dashboard selections also need to carry through to PromQL queries, where filtering uses label matchers rather than a SQL WHERE clause. A service dropdown might need to filter logs queried with SQL and metrics queried with PromQL on the same dashboard.
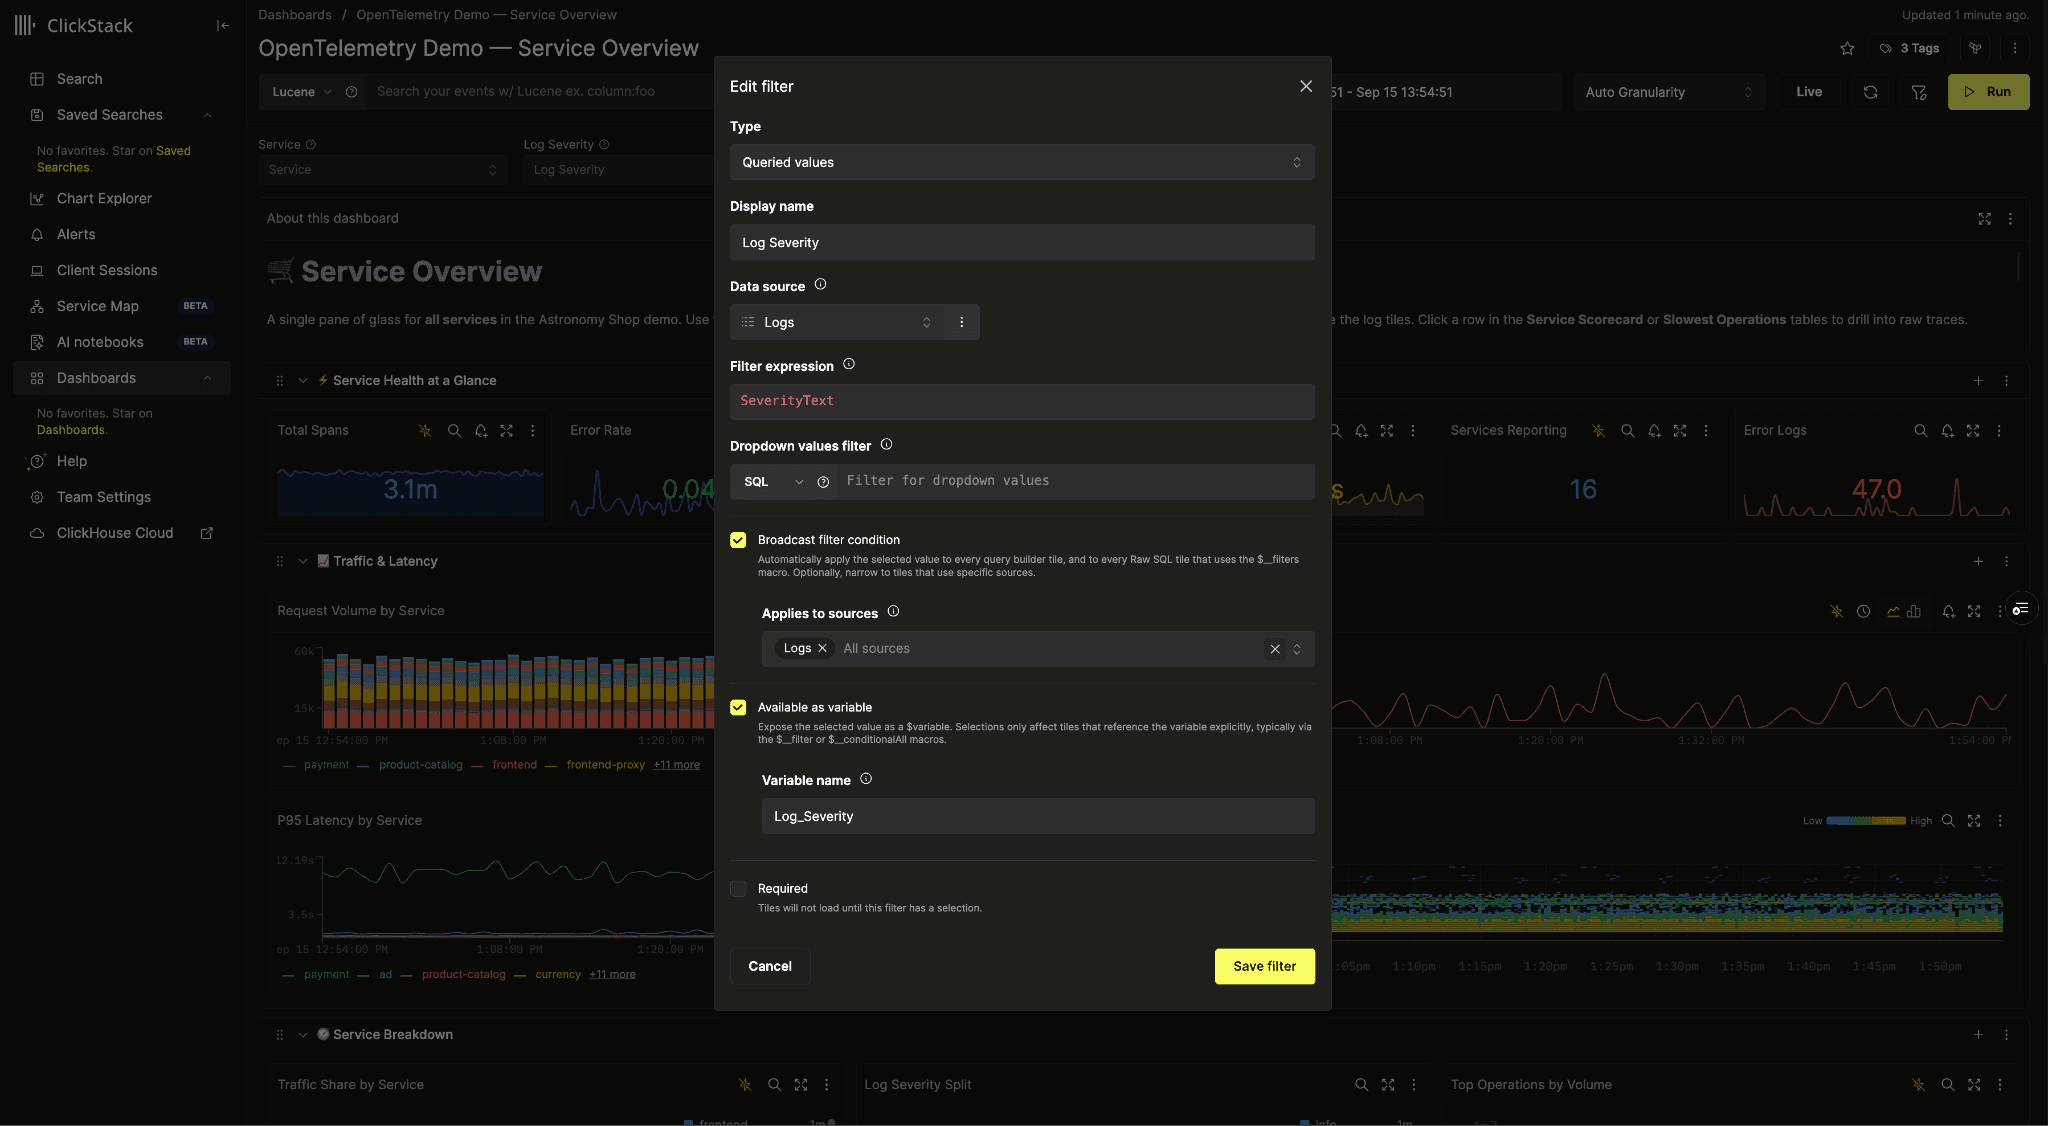
Dashboard variables make this possible by letting each tile reference the selected value wherever its query needs it.
Any filter, existing or new, can be marked “Available as variable” in the filters dialog. Its current selection is then exposed to tile queries as $variableName, and each tile decides where and how the value is used. Broadcast and variable mode can be enabled independently, so a filter can keep its existing behavior while also being available as a variable.
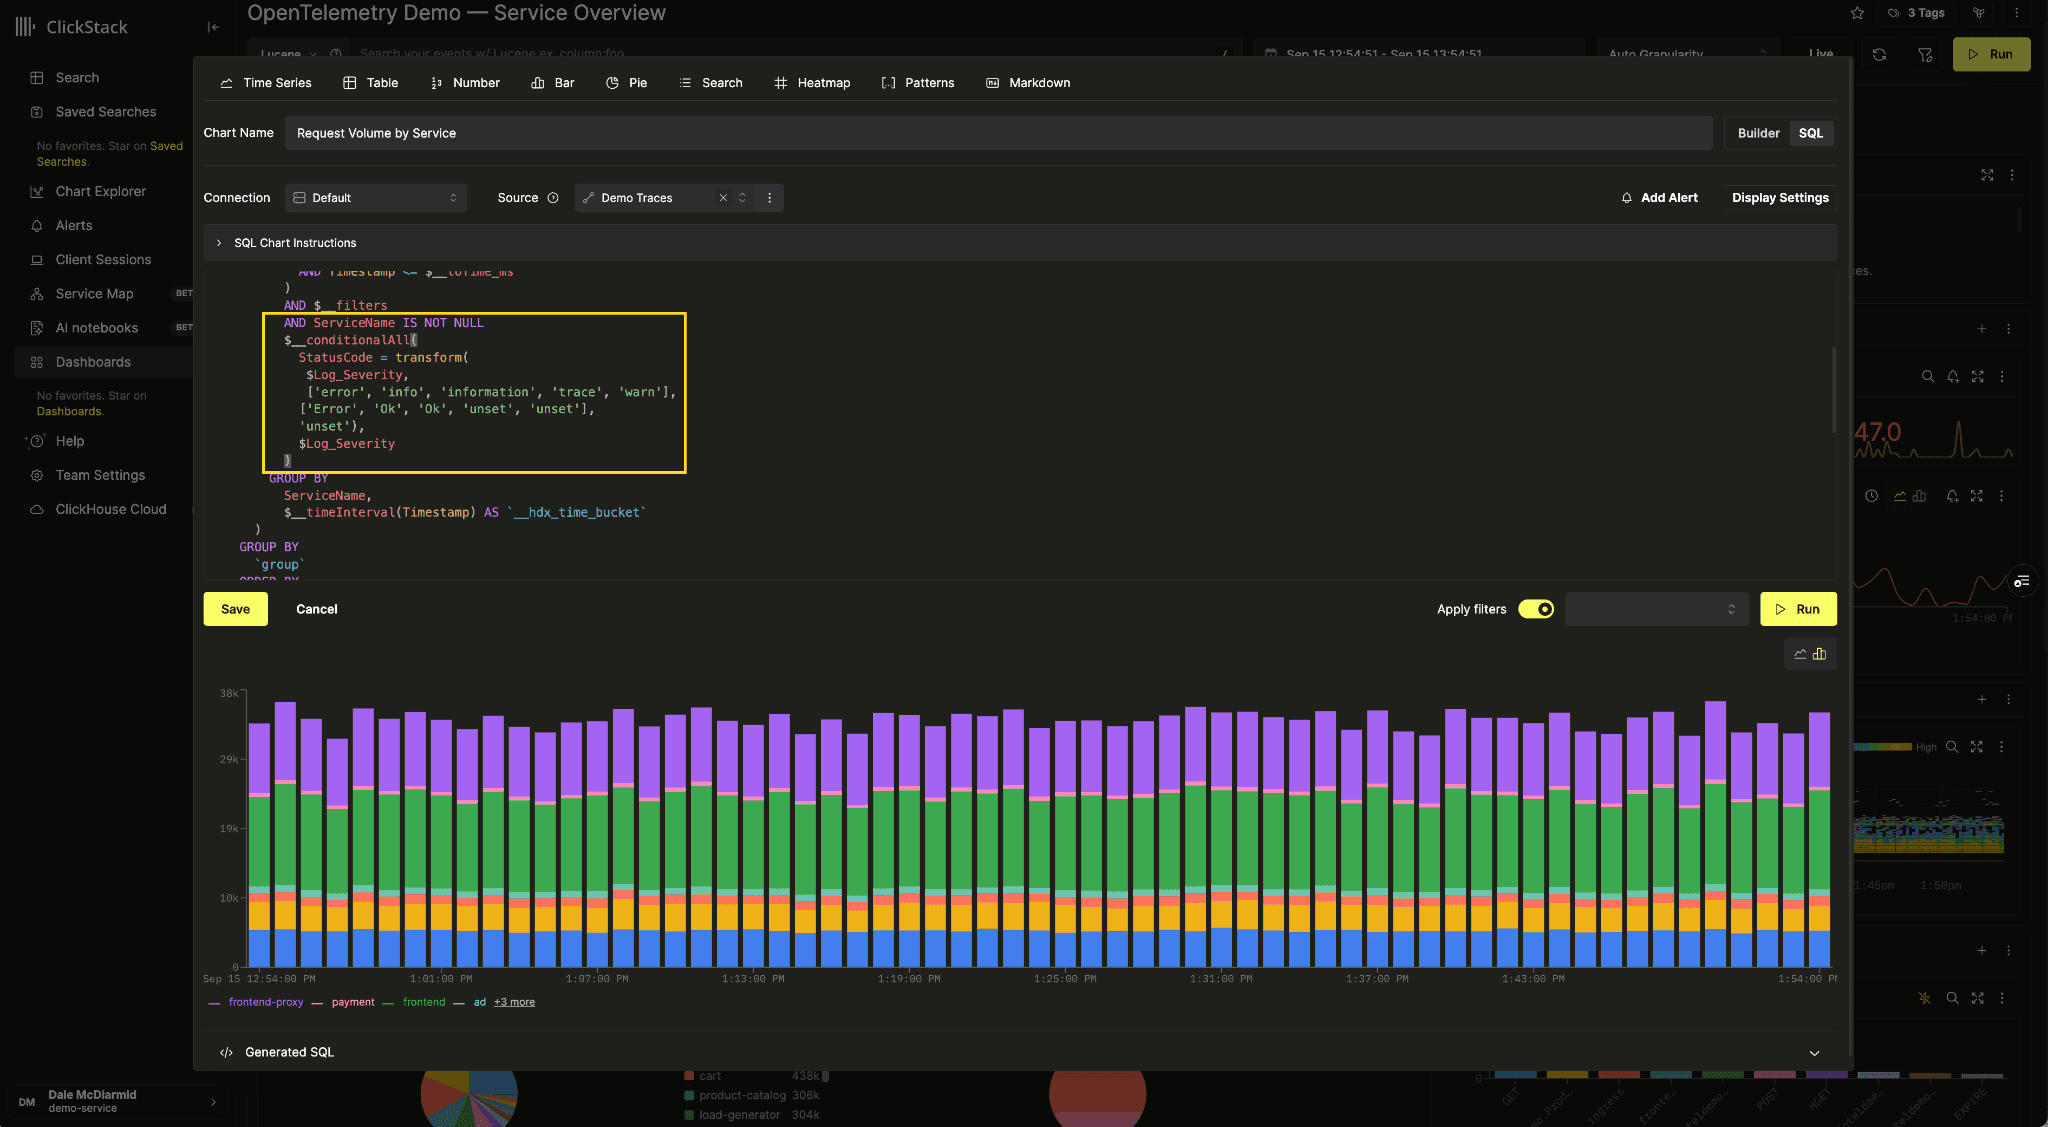
Here, the log severity dropdown filters trace volume by service over time by mapping the selected severity to a trace status, with all statuses included when nothing is selected.
Raw SQL tiles can reference a variable anywhere in the query. The reference form controls the rendering: $name expands to the selected values as SQL strings, while ${name:csv}, ${name:regex} and ${name:lucene} render them as a comma-separated list, a regex alternation, or an OR of quoted terms.
An empty selection is the awkward case. A bare
$namerenders as NULL before anything is selected, which would silently empty a chart. Two macros exist for exactly this.$__filter($var)expands to an IN condition when values are selected and to 1=1 otherwise.$__conditionalAll(condition, $var)includes an arbitrary condition only when the variable has a selection - as used in the example above.
SELECT
$__timeInterval(TimestampTime) AS ts,
ServiceName,
count() AS count
FROM otel_traces
WHERE $__timeFilter(TimestampTime)
AND $__filter(ServiceName, $service)
AND $__conditionalAll(
StatusCode = transform(
$Log_Severity,
['error', 'info', 'information', 'trace', 'warn'],
['Error', 'Ok', 'Ok', 'unset', 'unset'],
'unset'
),
$Log_Severity
)
GROUP BY ServiceName, ts
ORDER BY ts ASC;As shown in the example above, the conditional macro makes cross-source mappings possible. A dashboard can map trace status codes to error or info, allowing a severity filter defined against a logs table to filter a traces table. Select error at the dashboard level and the trace query filters for an error status.
Builder tiles use the same substitution in every SQL expression input: SELECT, WHERE, GROUP BY, HAVING, and ORDER BY all support variables as do Lucene queries.
Autocomplete suggests every available variable and macro. It also shows the actual expansion inline using the current selection, so you can see what the query will run before it runs.
Filters can also depend on each other, allowing users to create chained filters. For example, a filter's WHERE clause can reference other variables, so a severity dropdown that references the service filter offers only the severities found for the selected service.
Variable support is essential for filters to work in Prometheus dashboards and make PromQL visualizations interactive and responsive to filters. As part of the Prometheus support introduced above, dashboard variables connect filters to these queries, letting you explore different services and environments without editing the PromQL by hand.
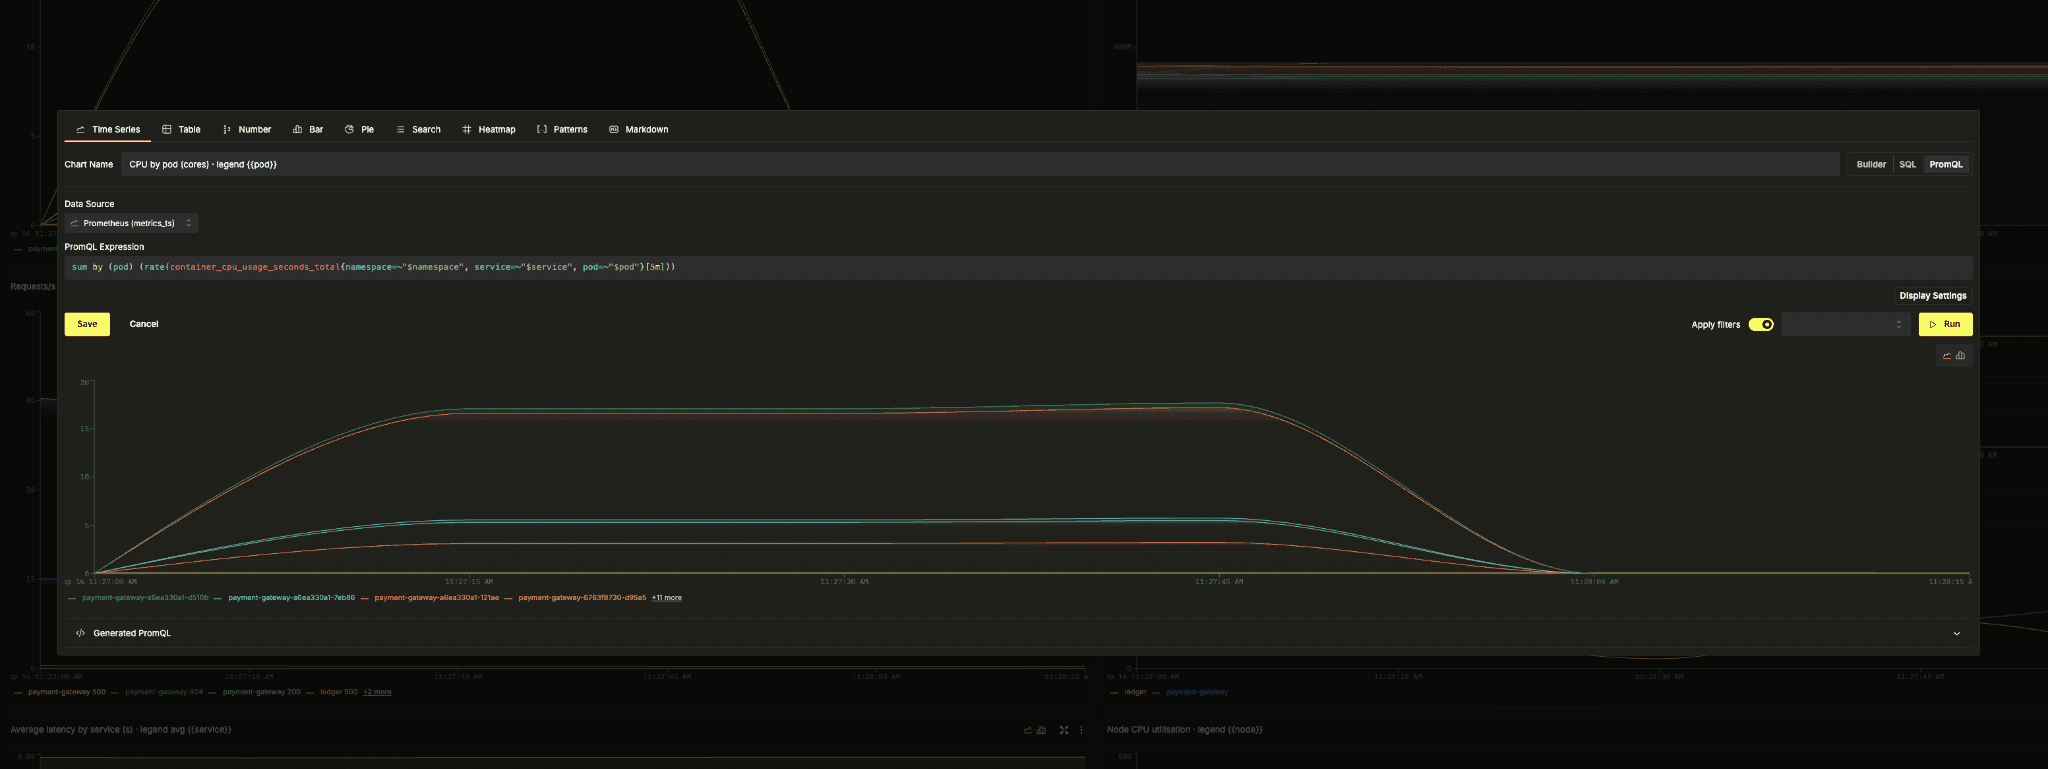
PromQL charts substitute variables before the query runs, with autocomplete for variable references and a generated PromQL preview alongside the existing generated SQL panel.
The external dashboards API, the MCP server, and, through the API, the ClickHouse Terraform provider all carry variable configuration. An agent can build a dashboard with variable filters, dependent dropdowns, and tiles that reference them, then check its own substitutions with the query tile tools before handing the dashboard over.
Sign up for the ClickStack newsletter
Get the latest ClickStack features and updates in your inbox.
Formulas on charts
Plotting errors and successful requests on the same chart gives you two counts. To see the failure rate, you need to combine them. Chart formulas let you do that directly in the chart editor.
Time series, table, and number charts now have an “Add Formula” row. Each series gets a letter reference, such as A or B, which you can use in an arithmetic expression. If A counts errors and B counts successful requests, A / (A + B) * 100 gives the percentage of requests that failed. Formulas work with metric, log, and trace sources, and you can add several to the same chart.
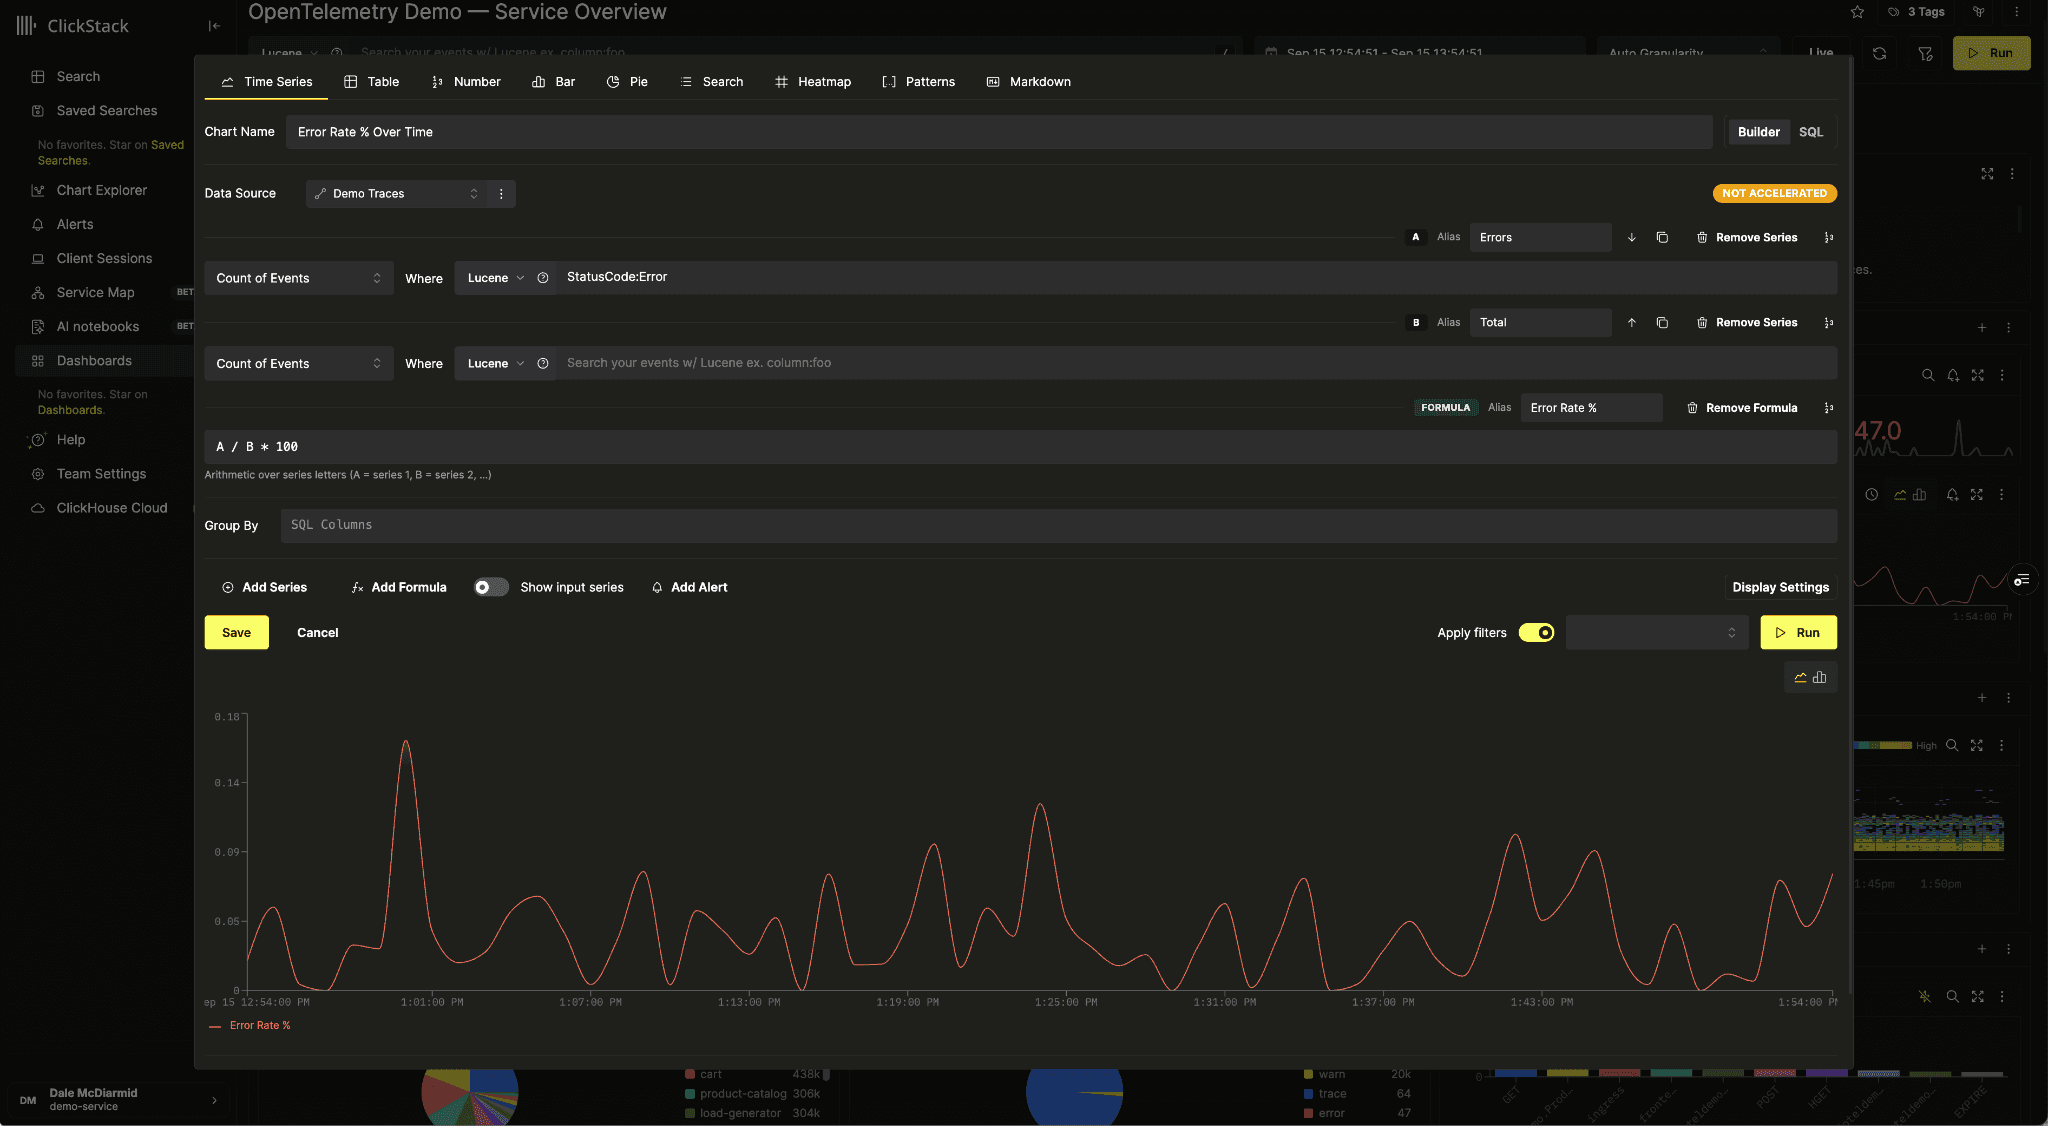
Each formula has its own alias and number format. The Show input series toggle lets you display the underlying series alongside the result or show only the calculated value.
ClickHouse computes the formulas as part of the chart query. Alerts on a formula chart evaluate the calculated result, so you can alert on a failure rate directly. Formulas are also supported through the dashboards API and the MCP server.
Formulas support arithmetic over series references. ClickHouse functions and references to other formulas aren't supported yet.
Browse metrics in the chart editor
The ClickStack metrics selector was optimized for when you knew a metric’s name. If you didn’t, the flat dropdown gave you little visibility into what your services were actually emitting. With more users moving their metrics workloads to ClickHouse following the release of the TimeSeries engine, we needed a better way to explore those metrics.
To address this, we've added a Browse metrics control beside the metric selector that opens a metrics explorer. Names are grouped into a tree, so system.cpu.utilization appears under system, then cpu. You can search across names and descriptions or switch to a flat list.
Selecting a metric shows its type, unit, description, reporting services, and available tags. You can explore tag values, choose filters and group-bys, and apply them together with the metric to your chart. The explorer also sets an aggregation suited to the metric type: average for gauges, sum for counters, and p95 for histograms.
Release markers on dashboard charts
ClickStack dashboards showed changes in latency and error rates, but gave you no indication of when a service had been updated. To see whether a release might explain a spike, you had to check your deployment tools and compare timestamps yourself.
We've added release markers to bring that context into the dashboard. Enable Show release markers from the dashboard menu, and charts display a dashed vertical line when a new service version first appears in your telemetry. Hover over a marker to see the service, version, and time.
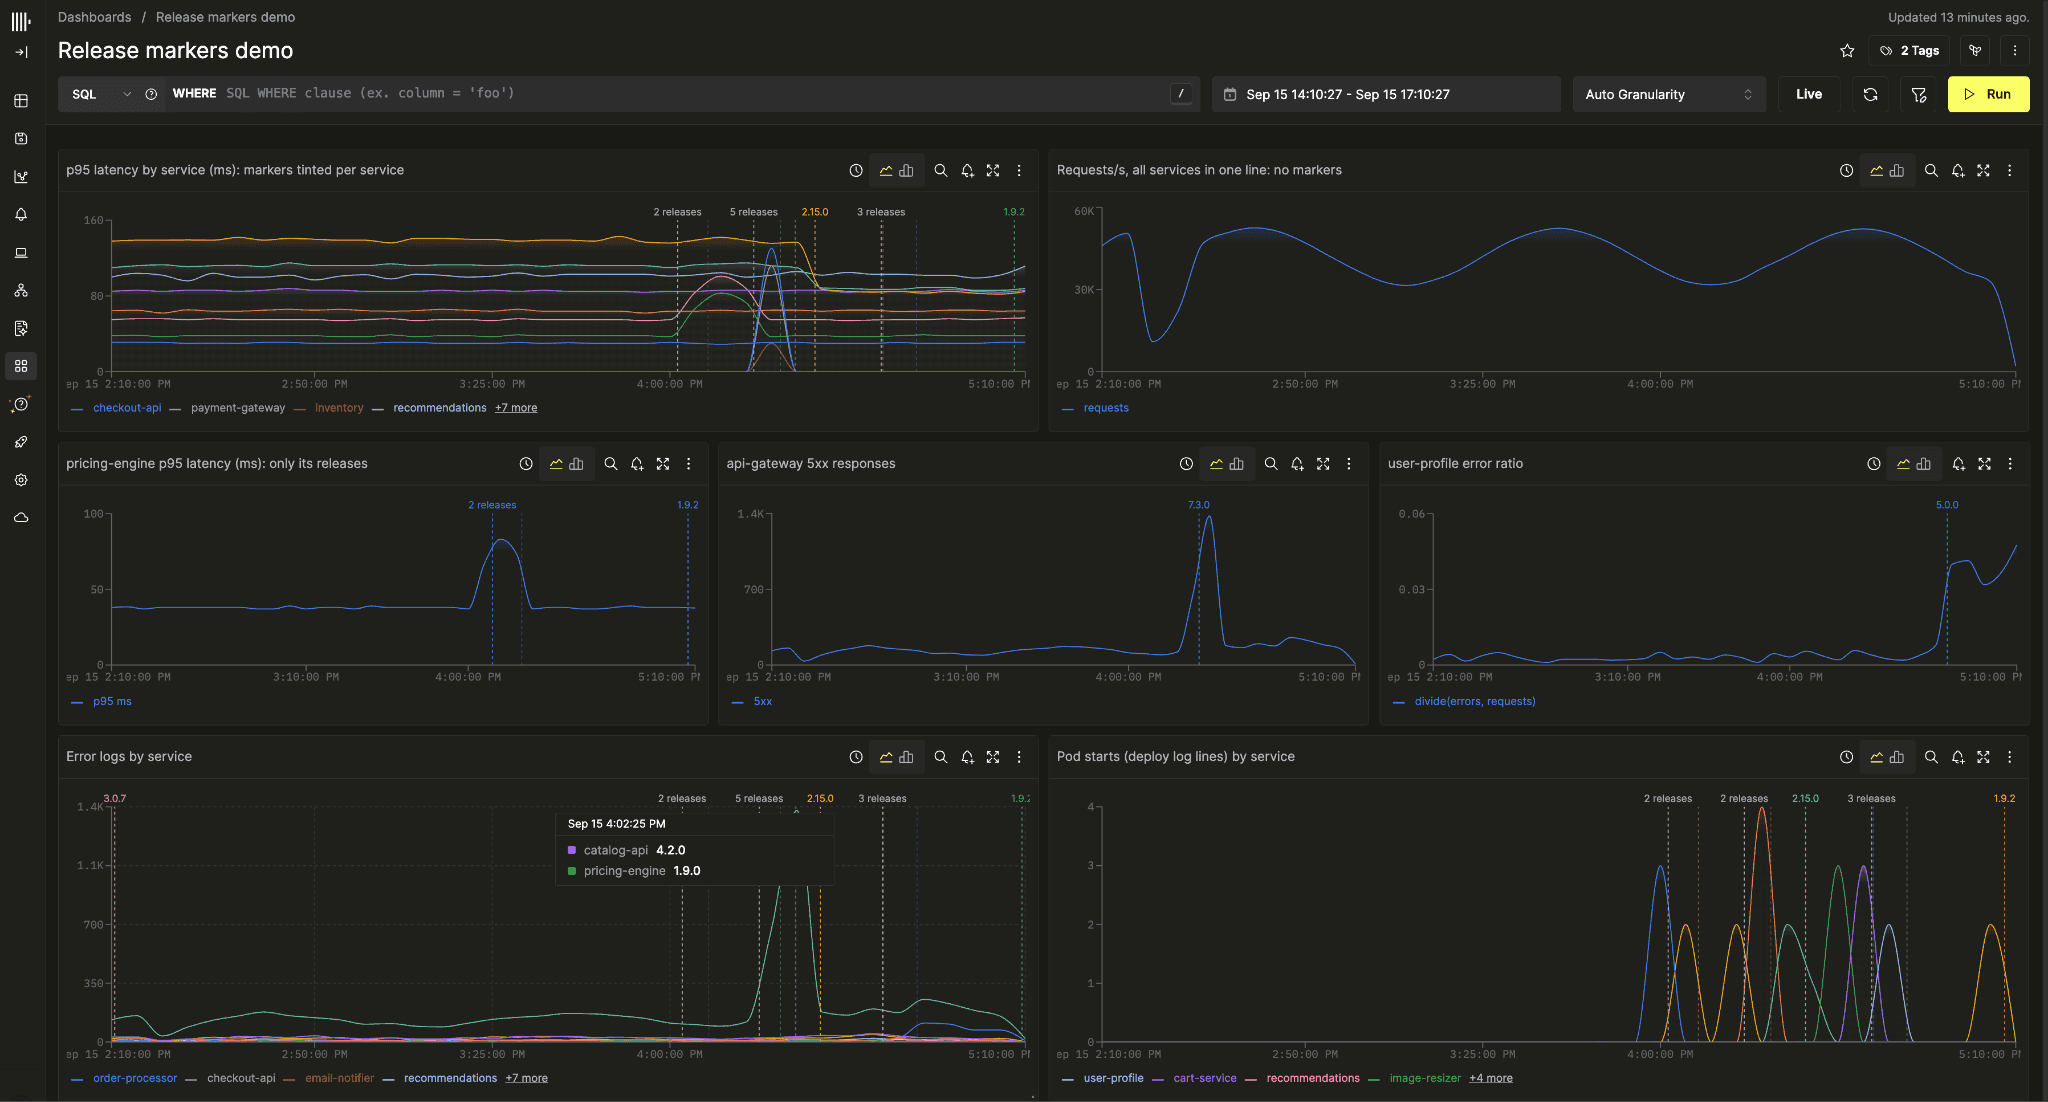
Release markers use version information from your existing logs and traces. By default, they read the OpenTelemetry service.version resource attribute. If you record versions elsewhere, you can configure a Service Version Expression on the source. For example, teams using container image tags can point it at ResourceAttributes['container.image.tag'].
Markers follow the services shown in each chart. A chart filtered to one service shows its releases, while a chart grouped by service shows markers colored to match each service's line. Charts that combine multiple services into a single line don't show markers.
LLM observability dashboard (beta)
ClickStack users are already sending logs and traces from LLM applications and coding agents. Until now, though, there was no dedicated view for understanding which models they were using, how many tokens they consumed, or what happened during a conversation.
We've added a beta LLM observability dashboard alongside the existing ClickHouse, Kubernetes, and services presets. It covers token usage, model calls, tool calls, cache hits, error rates, and response times, with a breakdown by user when that information is available.
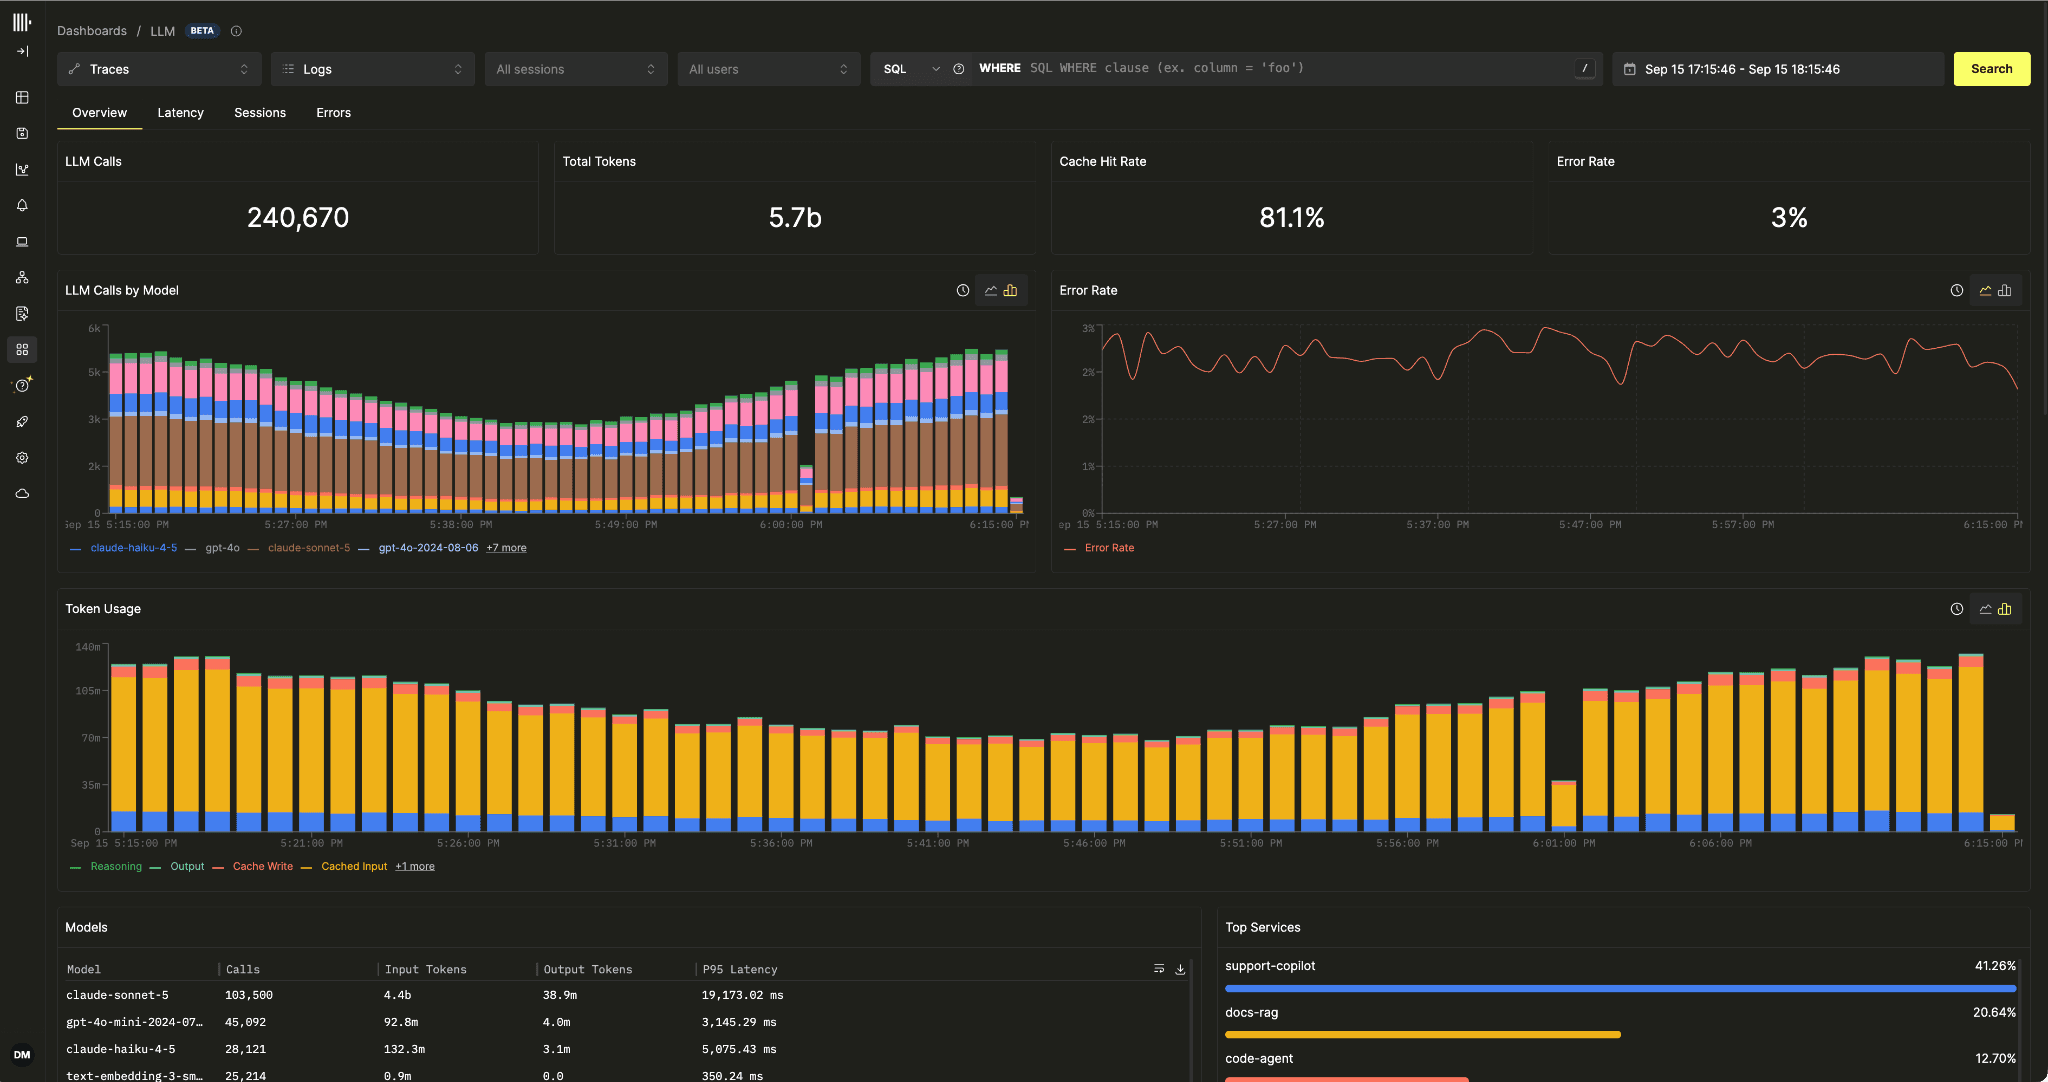
The dashboard reads your existing traces and logs, so it also works on telemetry collected before this release. It supports the OpenTelemetry GenAI semantic conventions, OpenLLMetry, OpenInference, and Vercel AI SDK telemetry, with no dedicated tables or ingestion changes required.
The Sessions tab groups calls by conversation. Open a session to see its timeline, then expand a call to read the messages, inspect tool calls, and see token usage.
The Latency tab helps you investigate slow model and tool calls. Select a region of the duration heatmap to see which attributes distinguish those calls, such as the model or token count. The Errors tab brings failing LLM spans together with related error logs.
This dashboard isn't a full LLM observability or AI engineering solution. If you need broader capabilities, such as evaluations and prompt management, we recommend Langfuse.
Alerting improvements
We've made several alerting improvements this month, many of them based on requests from users. These cover sending notifications to more destinations, organizing alerts, and understanding what happened when an alert was evaluated.
Multiple notification targets
ClickStack alerts were limited to a single notification target. If you wanted to page an on-call engineer and post to a team channel, you had to create two alerts and keep their conditions in sync.
An alert can now notify up to ten targets. You can add and remove them directly in the alert editor for saved searches and dashboard tiles, and the alerts page shows all configured destinations.
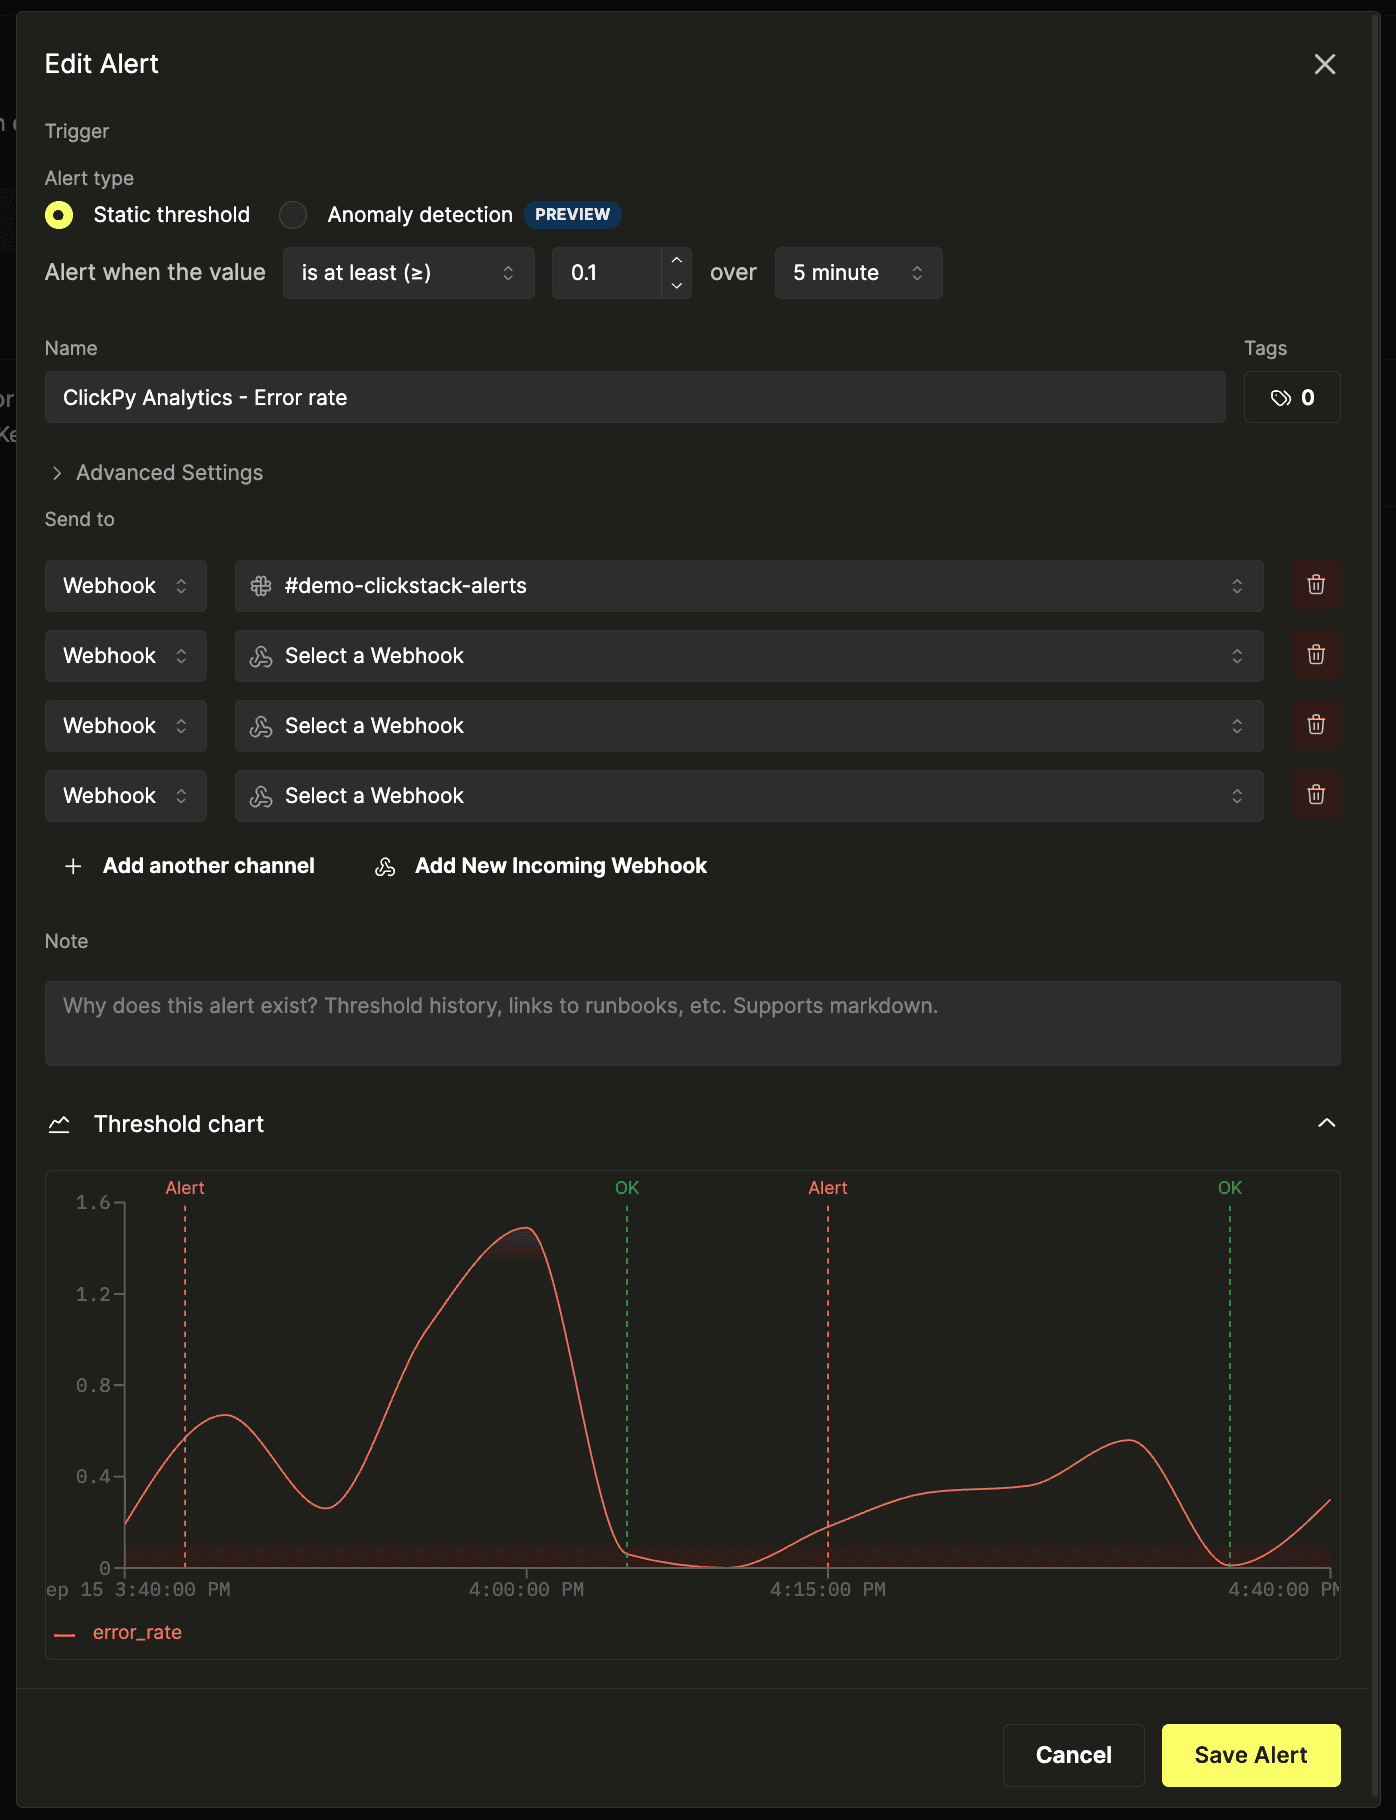
The evaluation history also shows notification duration and failures for each target, helping you identify which integration is slow or failing. Multiple targets are supported through the external API and MCP server.
Alert names and tags
Alerts previously took their names from the saved search or dashboard tile they monitored. As teams added more alerts, this made them harder to distinguish and organize.
You can now give each alert its own name and tags, then search and filter by them on the alerts page. New alerts start with the name and tags of the dashboard or saved search they belong to, which you can change in the alert editor.
Evaluation history
When an alert failed, ClickStack showed its latest error, but that didn't tell you whether earlier evaluations had succeeded or whether the alert was keeping up with its schedule.
Each evaluation is now recorded separately, including query errors, timeouts, and notification failures. The history also records query duration and backfilled time windows, so you can see when an alert is falling behind.
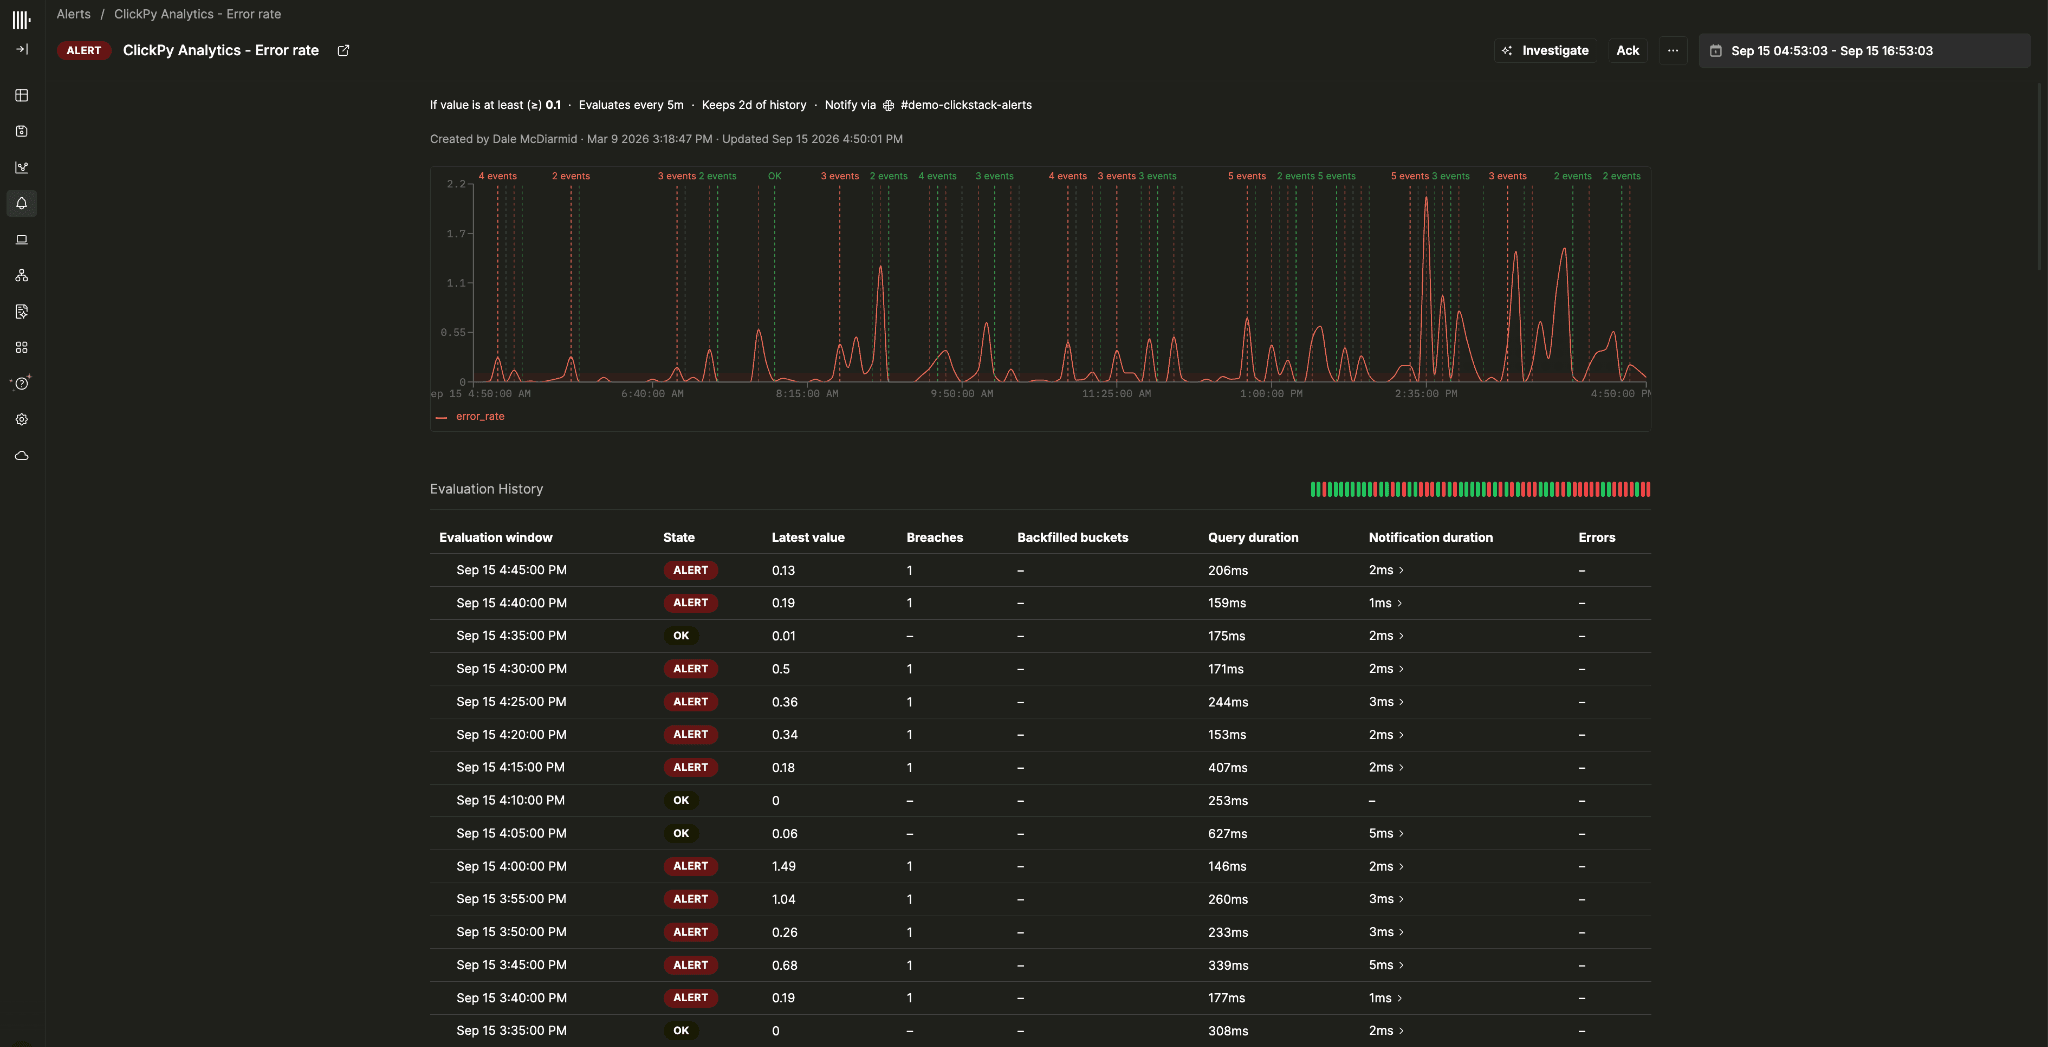
You can inspect errored evaluations from the history on the alerts page. The same history is available through the API at GET /alerts/:id/evaluations, with filtering by time range and a breakdown by group for grouped alerts.
Richer webhook payloads
Routing or deduplicating an alert in another system previously meant extracting information from its rendered title and message.
Generic and incident.io webhook templates now expose fields for the alert's ID, status, condition, observed value, and evaluation time range. The stable alertId identifies the same alert across repeated notifications, giving downstream systems a key for deduplication.
The webhook editor lists the available variables with descriptions, and Test Webhook includes sample values so you can check your integration before an alert fires.
New dashboard filter types
ClickStack dashboard filters populated their dropdowns by querying a column in ClickHouse. That works when the options come from your data, but sometimes you already know the values you want to offer. With Prometheus data sources, we also needed a way to populate dropdowns from metric labels.
We've added two filter types to the filters and variables dialog.
Static values let you define the options yourself. For example, an environment filter can offer “dev”, “staging”, and “prod” without running a query to discover them. Static filters work through the variables we highlighted above, with each tile referencing the selected value in its query.
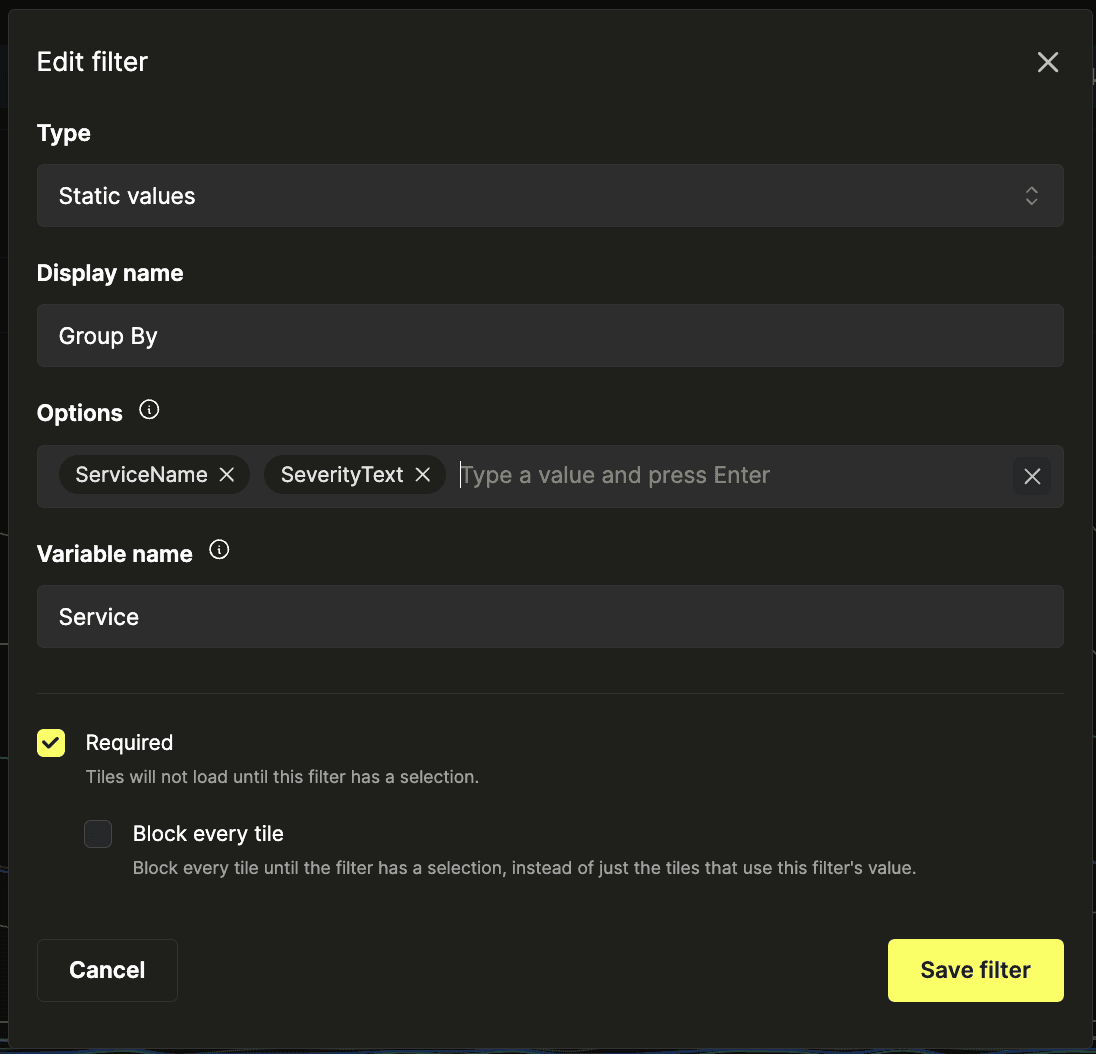
You can also use them to control how a chart displays data. For example, a dropdown containing ServiceName and SeverityText lets users choose how the chart groups its results.
The PromQL label values filter type lets you build a dropdown from the metric labels in a PromQL source. When configuring the filter, you choose a label using autocomplete and can optionally add a series matcher to narrow the values offered in the dropdown.
The matcher can reference other dashboard variables, allowing filters to depend on each other. An instance dropdown can use the selected environment to show only instances in that environment, with PromQL charts using those selections to filter their results.
OIDC authentication for the OTLP receiver
The standalone ClickStack collector authenticated incoming telemetry using a single shared token. This was straightforward to set up, but every application sending data needed the same long-lived credential. For teams running larger fleets, rotating that token meant coordinating updates across all of those applications.
The collector now supports OpenID Connect (OIDC) authentication, so applications can send telemetry using short-lived tokens from your existing identity provider or workload identity system.
To configure it, set OIDC_ISSUER_URL and OIDC_AUDIENCE on the collector. Applications then send a JWT in the Authorization: Bearer <token> header with their OTLP requests. The collector retrieves the provider's signing keys and validates the token's signature, issuer, audience, and expiry.
This lets teams manage credentials through their identity provider and issue tokens to individual applications, without distributing one shared secret across the fleet.
OIDC authentication is available in standalone collector mode. Shared-token authentication remains supported, but the two options are mutually exclusive. Setting
OIDC_ISSUER_URLenables OIDC.
MCP server improvements
We continue to expand the ClickStack MCP server, using our evaluation framework to test how agents investigate problems and build dashboards. This month, we've added tools for finding changes in log patterns and checking dashboards, along with improvements based on how agents are using the server.
Finding new and disappearing log patterns
The existing pattern tools helped agents find common log messages and compare attribute values, but they couldn't identify a log pattern that had just started appearing. This matters during an investigation, when a new error message might explain what changed.
The new clickstack_emerging_signals tool compares log patterns across two time windows. It reports patterns that are new or becoming more frequent, as well as those that have disappeared.
In our service-health-check evaluation, agents found a planted new log pattern in eight of ten runs with the tool, compared with none without it.
Checking a whole dashboard
Agents previously had to query each tile separately to check whether a dashboard they'd built actually worked. On larger dashboards, this added a lot of calls just to validate the result.
The new clickstack_query_tiles tool checks multiple tiles in one call and returns a summary of results, errors, and query warnings for each. In our dashboard-building evaluation, an agent used it to validate a 17-tile dashboard in a single call.
Helping agents choose the right tools
Production usage showed agents increasingly choosing raw SQL as the number of available tools grew. It accounted for around 73% of querying calls and had roughly twice the error rate of the builder tools.
We've updated the tool descriptions and server instructions to guide agents toward the builder tools first, which, on average, are almost 20% more accurate and use 27% fewer tool calls. These produce charts and tables that users can drill into, while raw SQL remains available for queries that the builder can't express.
Tools also now declare whether they read data or can modify it, helping clients decide which actions need approval.
Span links in both directions
When an application offloads work through Kafka, the producer sending a message and the consumer processing it may appear in separate traces. OpenTelemetry span links connect those operations, letting you follow the work across services.
ClickStack already let you follow these links from a consumer back to its producer. If you started at the producer, though, there was no way to find the consumers that linked to it. That made it harder to investigate what happened after a message was published.
We've added a Linked from section to the span detail panel, so you can find the spans that reference the one you're viewing. You can now follow a consumer's link to its producer and see the consumer listed there.
The existing Span Links section also shows more detail. Each linked span includes its name, service, duration, and timestamp, helping you choose which one to investigate before opening it. If the target span can't be found, the Open trace action is still available.
Navigating back to a span you've already visited also returns to its existing breadcrumb, keeping the navigation history manageable as you move between linked spans.
Little but useful things
What's new, in the app
You can now see what's changed in your version of ClickStack from the Help menu. It shows release highlights, badges for new features and breaking changes, and a View all releases option for browsing earlier updates.
Replay a tile's query in Search
Log and trace dashboard tiles now have a Replay search action. It opens Search in a new tab with the tile's source, query, dashboard filters, and time range preserved, so you can investigate the events behind a chart without rebuilding the query.
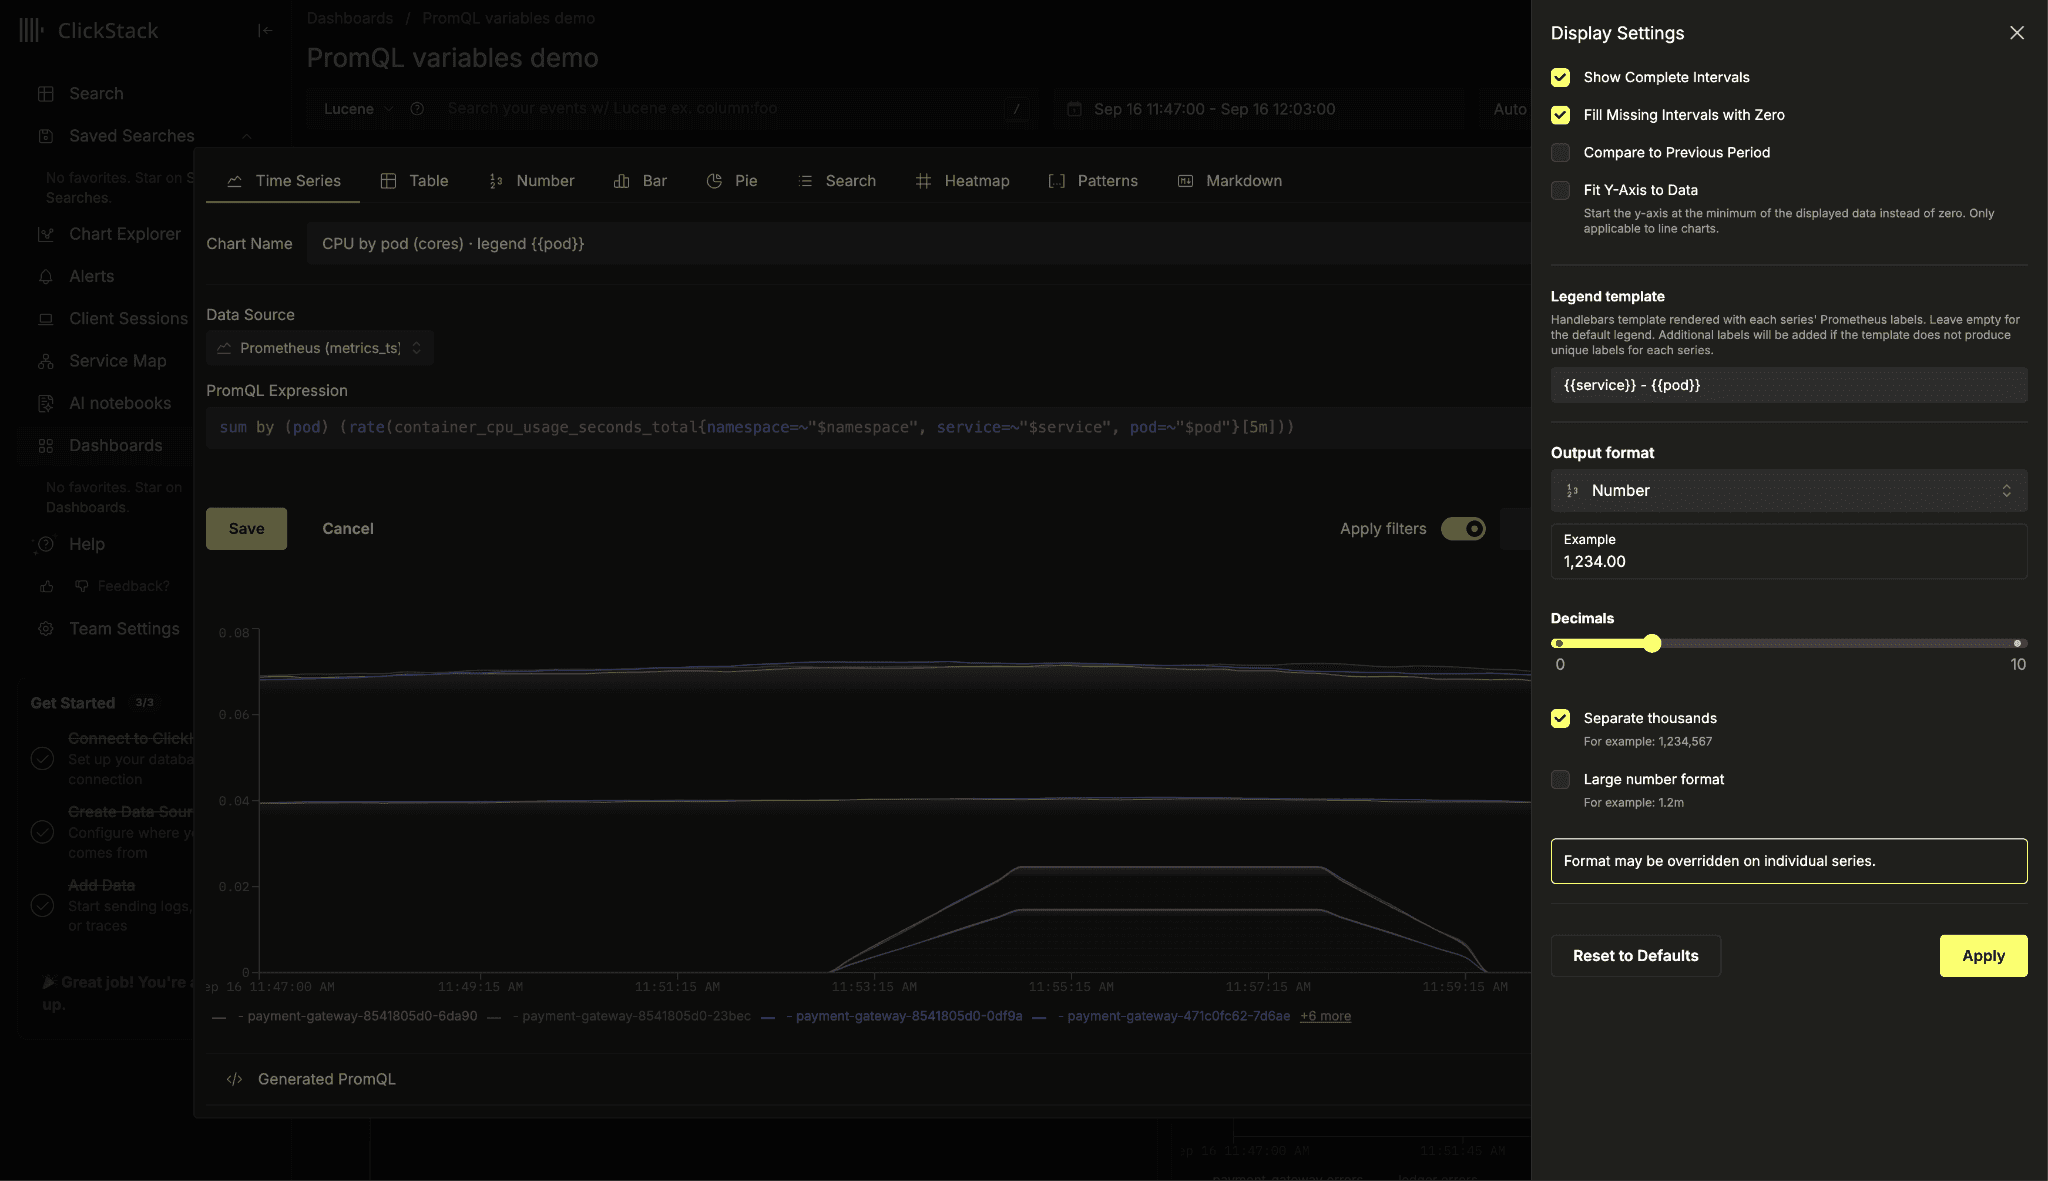
PromQL legend templates
PromQL charts previously labeled each series using the metric name and its distinguishing labels, which could make legends difficult to read. You can now define a handlebars template in display settings that uses only the labels you want to show.
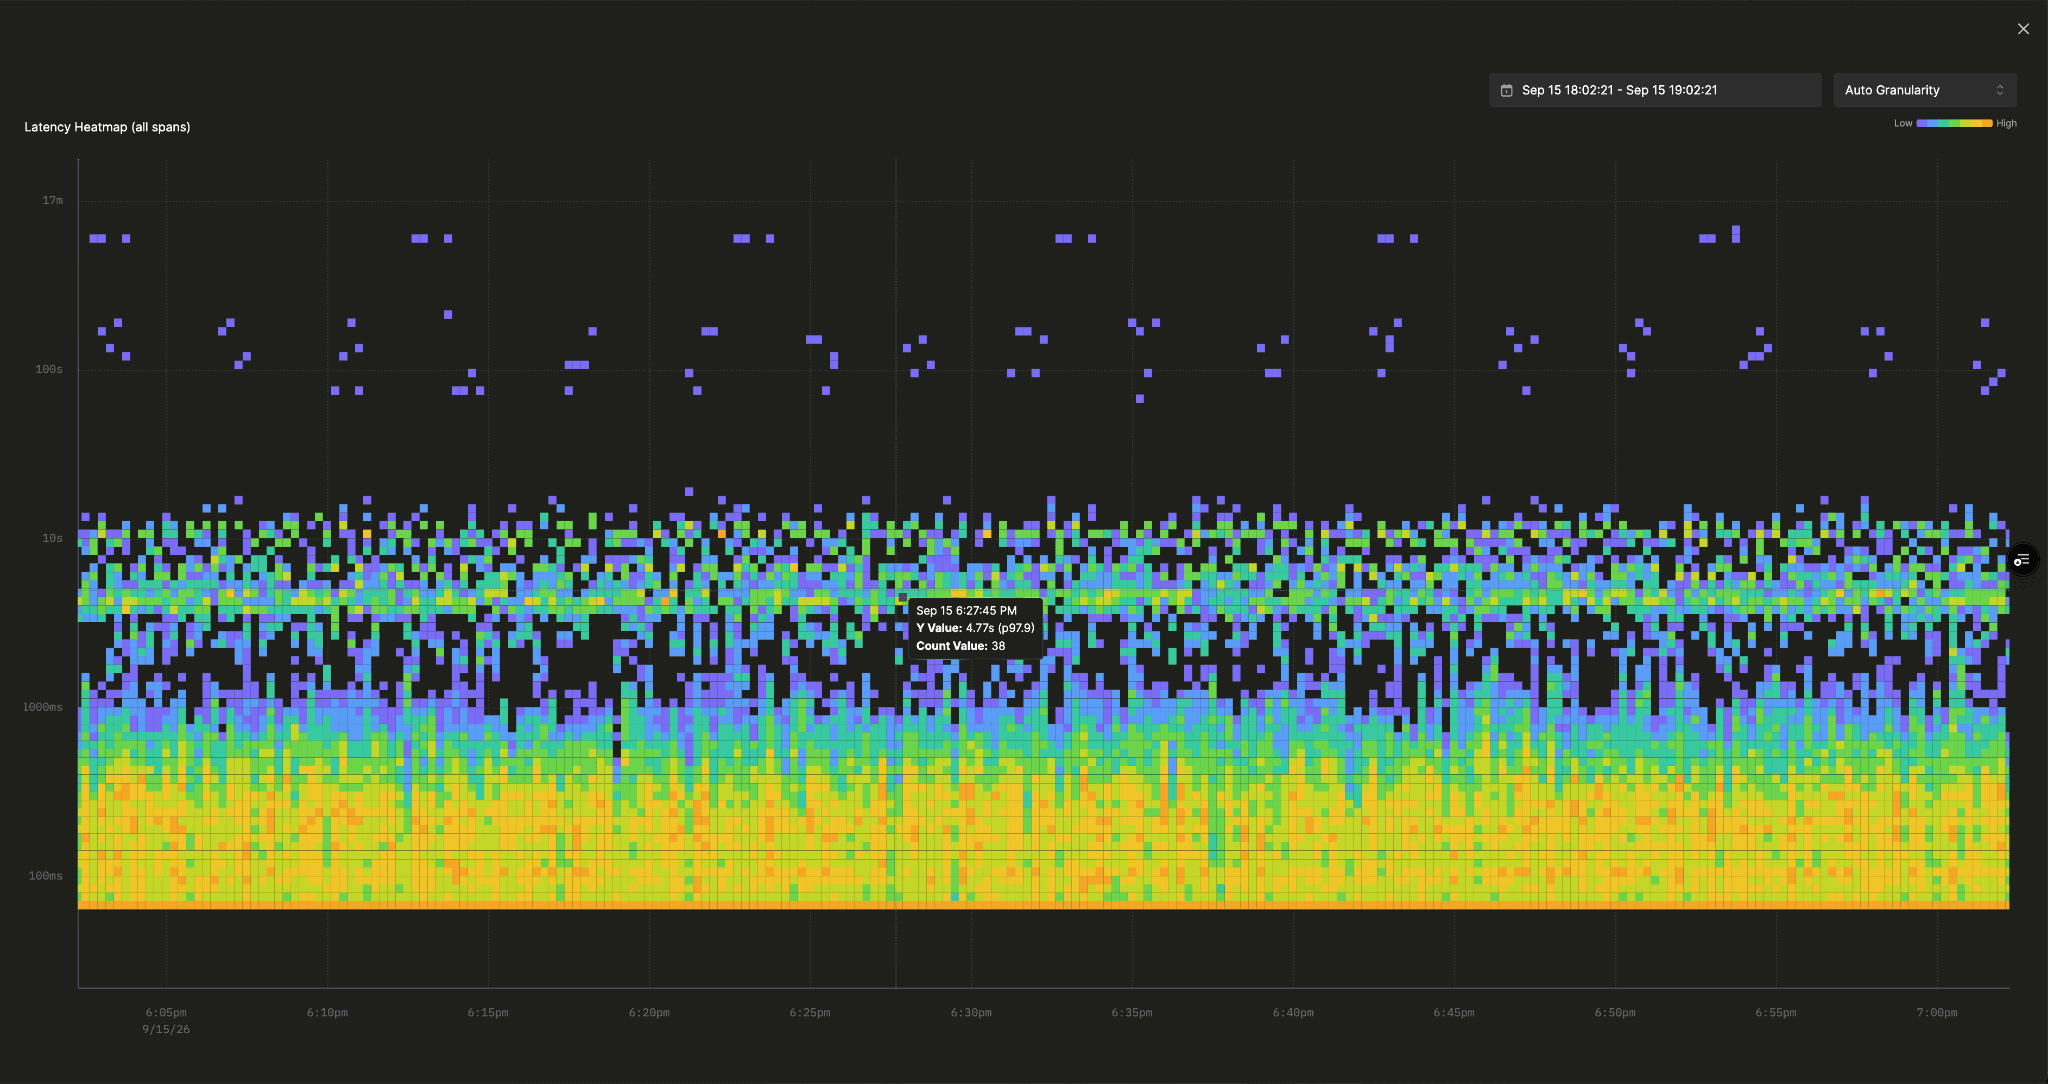
Heatmap percentile tooltip
Hovering over a heatmap cell now shows where that bucket sits in the distribution. You can see its percentile directly, helping you understand whether a duration is typical or among the slowest observations.
A faster alerts page
The alerts page could overwhelm the browser when a team had thousands of alerts. The list now renders only the rows currently in view, making those larger alert collections easier to browse.
Link to sources by name
Links into ClickStack can now identify a source by its name as well as its ID. This is useful for runbooks and alerting integrations, where source IDs may differ between environments or change when a source is recreated.
Conclusion
That's it for August. Much of this month's work focused on making dashboards easier to build and more useful during investigations, alongside improvements to alerting, the MCP server, and support for Prometheus and LLM workloads.
Many of these changes came directly from users running ClickStack and telling us where the experience fell short. Keep that feedback coming, try the features covered above, and let us know what you'd like to see next.
Get started today
Interested in seeing how ClickHouse works on your data? Get started with ClickHouse Cloud in minutes and receive $300 in free credits.
Sign up