Table of Contents #
Introduction #
As a high-performance OLAP database, ClickHouse is used for many use cases, including real-time analytics for time series data. Its diversity of use cases has helped drive a huge range of analytical functions, which assist in querying most data types. These query features and high compression rates have increasingly led users to utilize ClickHouse to store Observability data. This data takes three common forms: logs, metrics, and traces. In this series of blog posts, we will explore how these “pillars” can be collected, optimally stored, queried, and visualized.
For this post, we start with logs and possibilities for collection and querying. We have attempted to ensure examples can be reproduced. We also note that agent support for specific data types with ClickHouse is constantly evolving, with this post representing the current state of play of the ecosystem as of January 2023. We thus always encourage our users to review documentation and linked issues.
While our examples assume a modern architecture where a user must collect logs from a Kubernetes cluster, the recommendations and advice are not Kubernetes-dependent and apply equally to self-managed servers or other container orchestration systems. We used our development cloud environment for testing, producing around 100GB of logs daily from about 20 nodes. Note that we have made no effort to tune agents or measure their resource overhead - something we recommend users research or do before production deployment. This post also focuses on data collection, proposing a schema and data model but leaving optimizations to a later post.
For our examples, we store data in a ClickHouse Cloud service where you can spin up a cluster on a free trial in minutes, let us deal with the infrastructure and get you querying!
Note: All the reproducible configuration examples used in this article are available to consult in this repository
Observability architectures #
Most agents use a common architecture pattern for collecting Observability data at scale, promoting an agent and aggregator concept. The latter can be ignored for small deployments, with agents deployed close to their data source and responsible for processing and sending data directly to ClickHouse over either HTTP or the native protocol. In a Kubernetes environment, this means deploying the agent as a Daemonset. This deploys an agent pod to each K8s node, responsible for collecting the logs of other containers (typically read from disk).
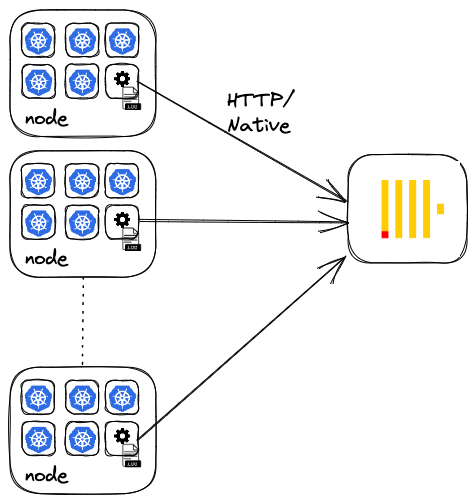
This architecture is sufficient for users not requiring high durability or availability and for a small number of agents with low friction to make configuration changes. However, users should be aware that this may result in many small inserts, especially if agents are configured to flush data frequently, e.g., because of a need for data to be available promptly for analysis and issue identification. In this case, the users should consider configuring agents to use asynchronous inserts to avoid common problems resulting from too many parts.
Larger deployments introduce an aggregator or gateway concept. This aims to configure lighter-weight agents close to their data source, only responsible for forwarding data to an aggregator. This reduces the possibility of disrupting existing services. The aggregator is responsible for processing steps such as enrichment, filtering, and ensuring a schema is applied, as well as batching and reliable delivery to ClickHouse. This aggregator is usually deployed as a Deployment or Statefulset and can be replicated for high availability if required.
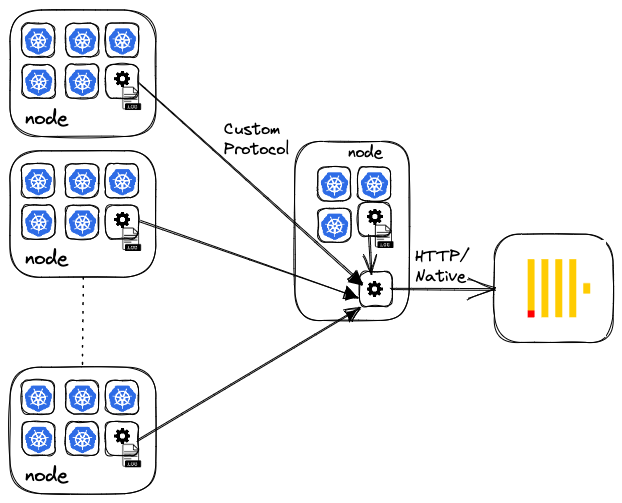
As well as minimizing load at the data source on potentially critical services, this architecture allows data to be batched and inserted as larger blocks into ClickHouse. This property is significant since it aligns with ClickHouse insert best practices.
The above architecture simplifies an enterprise architecture which, in reality, also needs to consider where data should be buffered, load-balancing, high availability, complex routing, and the need to separate your record (archive) and analysis systems. These concepts are covered in detail well by the Vector documentation here. While Vector-specific, the principles here apply to other agents discussed. An important quality of these architectures is that the agent and aggregator can also be heterogeneous with mixes of technology common, especially when collecting data of different types since some agents excel at different Observability pillars.
Agents #
At ClickHouse, our users gravitate toward four principal agent technologies: Open Telemetry Collector, Vector, FluentBit, and Fluentd. The latter of these two share the same origin and many of the same concepts. For brevity, we explore FluentBit, which is more lightweight and sufficient for log collection in Kubernetes, but Fluentd would represent a valid approach. These agents can assume an aggregator or collector role and can be used together (with some limitations). Although they use different terminology, they all utilize a common architecture with pluggable inputs, filters/processors, and outputs. ClickHouse is either supported as official output or integration is achieved via generic HTTP support.
In the initial examples below, however, we deploy each agent in both the aggregator and collector roles. We utilize each agent's official Helm chart for a simple getting-started experience, note the important configuration changes, and share the values.yaml file.
Our examples use a single replica for our aggregator, although these can be easily deployed with multiple replicas and load-balanced for performance and fault tolerance. All of the agents support the enrichment of the logs with Kubernetes metadata, critical for future analysis, such as the pod name, container id, and node from which the log originated. Annotations and labels can also be included on log entries (enabled by default for FluentBit and Vector). These are typically sparse but potentially numerous (hundreds); a production architecture should assess their value and filter them. We recommend using a Map type for these to avoid column explosion, which has query implications.
All agents required tuning (via the resources YAML key) in the aggregator role to avoid OOM issues and to keep up with our throughput (around 100GB a day). Your mileage may vary here depending on the number of aggregators and log throughput, but tuning resources will almost always be required in large environments.
Open Telemetry (OTEL) Collector (alpha) #
OpenTelemetry is a collection of tools, APIs, and SDKs for instrumenting, generating, collecting, and exporting Observability data. As well as offering agents in most of the popular languages, a Collector component written in Golang provides a vendor-agnostic implementation of how to receive, process, and export Observability data. By supporting several input formats, such as Prometheus and OTLP, as well as a wide range of export targets, including ClickHouse, the OTEL Collector can provide a centralized processing gateway. The Collector uses the terms receiver, processor, and exporter for its three stages and gateway for an aggregator instance.
While more commonly used as a gateway/aggregator, handling tasks such as batching and retries, the Collector can also be deployed as an agent itself. OTLP represents the Open Telemetry data standard for communication between gateway and agent instances, which can occur over gRPC or HTTP. As we will see below, this protocol is also supported by Vector and FluentBit.
ClickHouse support #
ClickHouse is supported in the OTEL exporter through a community contribution, with support for logs and traces (a PR is under review for metrics). Communication with ClickHouse occurs over the optimized native format and protocol via the official Go client.
Before using the Open Telemetry Collector, users should consider the following points:
- The ClickHouse data model and schema used by the agent are hard coded. As of the time of writing, there is no ability to change the types or codecs used. Mitigate this by creating the table before deploying the connector, thus enforcing your schema.
- The exporter is not distributed with the core OTEL distribution but rather as an extension through the
contribimage. Practically this means using the correct docker image in the Helm chart. - The exporter is in alpha, and although we have had no issues collecting over a TB of logs, users should adhere to the advice provided by Open Telemetry. The logs use case for OTEL is still relatively new and less mature than the Fluent Bit or Vector offerings.
Kubernetes Deployment #
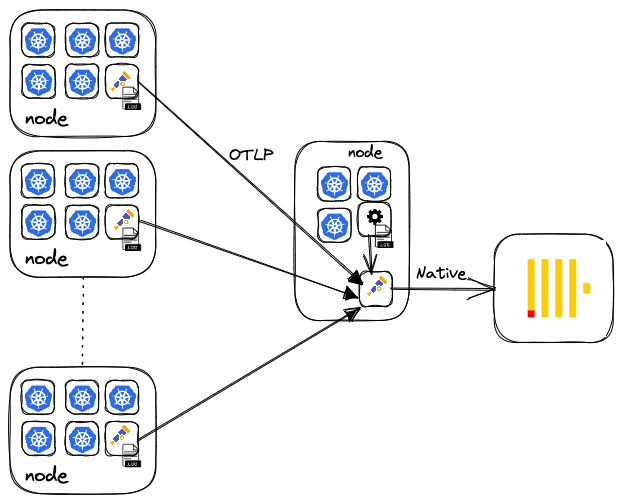
The official Helm chart represents the simplest deployment means if only collecting logs. In future posts, when we instrument applications, the operator offers auto-instrumentation features and other deployment modes, e.g., as a sidecar. For logs, however, the basic chart is sufficient. The full details on installing and configuring the chart can be found here, including the steps for deploying a gateway and agent as well as sample configurations.
Note that the exporter also supports ClickHouse’s native TTL features for data management and relies on partitioning by date (enforced by the schema). We set TTL to 0 in our example, disabling data expiration, but this represents a useful feature and a common requirement in logs that could easily be used in the schema of other agents.
Data & Schema #
Our earlier example has configured the aggregator to send data to an otel.otel_logs table. We can confirm the successful collection of data with a simple SELECT.
SELECT * FROM otel.otel_logs LIMIT 1 FORMAT Vertical

Row 1:
──────
Timestamp:          2023-01-04 17:27:29.880230118
TraceId:
SpanId:
TraceFlags:         0
SeverityText:
SeverityNumber:     0
ServiceName:
Body:               {"level":"debug","ts":1672853249.8801103,"logger":"activity_tracker","caller":"logging/logger.go:161","msg":"Time tick; Starting fetch activity"}

ResourceAttributes: {'k8s.container.restart_count':'0','k8s.pod.uid':'82bc65e2-145b-4895-87fc-4a7db48e0fd9','k8s.container.name':'scraper-container','k8s.namespace.name':'ns-fuchsia-qe-86','k8s.pod.name':'c-fuchsia-qe-86-server-0'}
LogAttributes:      {'log.file.path':'/var/log/pods/ns-fuchsia-qe-86_c-fuchsia-qe-86-server-0_82bc65e2-145b-4895-87fc-4a7db48e0fd9/scraper-container/0.log','time':'2023-01-04T17:27:29.880230118Z','log.iostream':'stderr'}

1 row in set. Elapsed: 0.302 sec. Processed 16.38 thousand rows, 10.59 MB (54.18 thousand rows/s., 35.02 MB/s.)
Note that the collector is opinionated on the schema, including enforcing specific codecs. While these represent sensible choices for the general case, it prevents users from tuning the configuration to their needs, e.g., modifying the table's ordering key to fit user-specific access patterns.
The schema uses PARTITION BY to assist TTL. Specifically, this allows a day's worth of data to be efficiently deleted. It may positively and negatively impact queries. The use of data-skipping bloom indices is an advanced topic we defer to later posts on schema optimization. The use of the Map type here for Kubernetes and log attributes impacts our query syntax.
SHOW CREATE TABLE otel.otel_logs

CREATE TABLE otel.otel_logs
(
    `Timestamp` DateTime64(9) CODEC(Delta(8), ZSTD(1)),
    `TraceId` String CODEC(ZSTD(1)),
    `SpanId` String CODEC(ZSTD(1)),
    `TraceFlags` UInt32 CODEC(ZSTD(1)),
    `SeverityText` LowCardinality(String) CODEC(ZSTD(1)),
    `SeverityNumber` Int32 CODEC(ZSTD(1)),
    `ServiceName` LowCardinality(String) CODEC(ZSTD(1)),
    `Body` String CODEC(ZSTD(1)),
    `ResourceAttributes` Map(LowCardinality(String), String) CODEC(ZSTD(1)),
    `LogAttributes` Map(LowCardinality(String), String) CODEC(ZSTD(1)),
    INDEX idx_trace_id TraceId TYPE bloom_filter(0.001) GRANULARITY 1,
    INDEX idx_res_attr_key mapKeys(ResourceAttributes) TYPE bloom_filter(0.01) GRANULARITY 1,
    INDEX idx_res_attr_value mapValues(ResourceAttributes) TYPE bloom_filter(0.01) GRANULARITY 1,
    INDEX idx_log_attr_key mapKeys(LogAttributes) TYPE bloom_filter(0.01) GRANULARITY 1,
    INDEX idx_log_attr_value mapValues(LogAttributes) TYPE bloom_filter(0.01) GRANULARITY 1,
    INDEX idx_body Body TYPE tokenbf_v1(32768, 3, 0) GRANULARITY 1
)
ENGINE = MergeTree
PARTITION BY toDate(Timestamp)
ORDER BY (ServiceName, SeverityText, toUnixTimestamp(Timestamp), TraceId)
SETTINGS index_granularity = 8192, ttl_only_drop_parts = 1
Vector (beta) #
Vector is an open-source (licensed under the Mozilla Public License, version 2.0) observability data pipeline tool maintained by DataDog that supports the collection, transformation, and routing of logs, metrics, and trace data. It aims to be vendor agnostic and support multiple inputs and outputs, including the OTLP protocol allowing it to operate as an aggregator for Open Telemetry agents. Written in Rust, Vector uses the terminology sources, transforms, and sinks for its 3-stage pipeline. It represents a feature-rich log collection solution and is increasingly popular within the ClickHouse community.
ClickHouse support #
ClickHouse is supported in Vector through a dedicated sink (currently in Beta), with communication occurring over the HTTP protocol using JSON format and requests batched on insert. While not as performant as other protocols, this offloads data processing to ClickHouse and simplifies debugging network traffic. While a data model is enforced, the user must create the target table and choose their types and encodings. A skip_unknown_fields option allows the user to create a table with a subset of the available columns. This causes any columns not in the target table to be ignored. Below we create a target table in the vector database covering all post columns, including those added from Kubernetes enrichment. For now, we utilize a table ordering key optimized for filtering by container name. Future posts will discuss optimizing this schema.
CREATE database vector

CREATE TABLE vector.vector_logs
(
   `file` String,
   `timestamp` DateTime64(3),
   `kubernetes_container_id` LowCardinality(String),
   `kubernetes_container_image` LowCardinality(String),
   `kubernetes_container_name` LowCardinality(String),
   `kubernetes_namespace_labels`  Map(LowCardinality(String), String),
   `kubernetes_pod_annotations`  Map(LowCardinality(String), String),
   `kubernetes_pod_ip` IPv4,
   `kubernetes_pod_ips` Array(IPv4),
   `kubernetes_pod_labels` Map(LowCardinality(String), String),
   `kubernetes_pod_name` LowCardinality(String),
   `kubernetes_pod_namespace` LowCardinality(String),
   `kubernetes_pod_node_name` LowCardinality(String),
   `kubernetes_pod_owner` LowCardinality(String),
   `kubernetes_pod_uid` LowCardinality(String),
   `message` String,
   `source_type` LowCardinality(String),
   `stream` Enum('stdout', 'stderr')
)
ENGINE = MergeTree
ORDER BY (`kubernetes_container_name`, timestamp)
By default, the Kubernetes log input for Vector creates columns with . in the column name, e.g., kubernetes.pod_labels. We don’t recommend using dots in Map column names and may deprecate its use, so use an _. A transform achieves this in the aggregator (see below). Note how we also get namespace and node labels.
Kubernetes deployment #
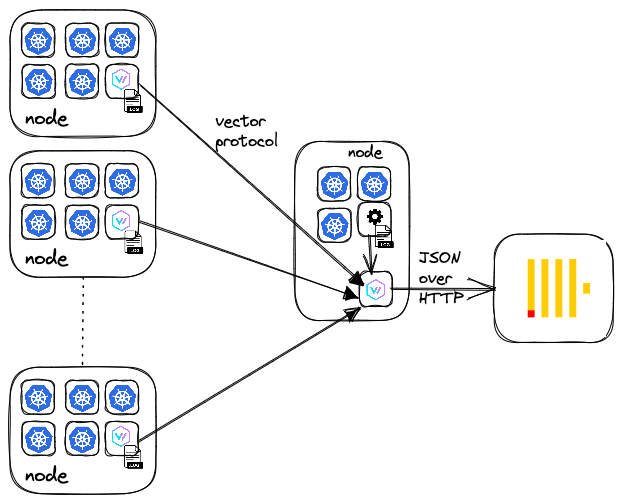
Again, we use Helm as our preferred installation method by utilizing the official chart. Full installation details for the aggregator and agent are here, as well as sample configurations. Other than changing the output source to ClickHouse, the principle change is the need to use a remap transform, which uses Vector Remap Language (VRL) to ensure columns use _ as delimiter and not ..
Data #
We can confirm log data is being inserted with a simple query:
SELECT *
FROM vector.vector_logs
LIMIT 1
FORMAT Vertical

Row 1:
──────
file:                        /var/log/pods/argocd_argocd-application-controller-0_33574e53-966a-4d54-9229-205fc2a4ea03/application-controller/0.log
timestamp:                   2023-01-05 12:12:50.766
kubernetes_container_id:
kubernetes_container_image:  quay.io/argoproj/argocd:v2.3.3
kubernetes_namespace_labels: {'kubernetes.io/metadata.name':'argocd','name':'argocd'}
kubernetes_node_labels:      {'beta.kubernetes.io/arch':'amd64','beta.kubernetes.io/instance-type':'r5.xlarge'...}
kubernetes_container_name:   application-controller
kubernetes_pod_annotations:  {'ad.agent.com/application-controller.check_names':'["openmetrics"]...'}
kubernetes_pod_ip:           10.1.3.30
kubernetes_pod_ips:          ['10.1.3.30']
kubernetes_pod_labels:       {'app.kubernetes.io/component':'application-controller'...}
kubernetes_pod_name:         argocd-application-controller-0
kubernetes_pod_namespace:    argocd
kubernetes_pod_node_name:    ip-10-1-1-210.us-west-2.compute.internal
kubernetes_pod_owner:        StatefulSet/argocd-application-controller
kubernetes_pod_uid:          33574e53-966a-4d54-9229-205fc2a4ea03
message:                     {"level":"info","msg":"Ignore '/spec/preserveUnknownFields' for CustomResourceDefinitions","time":"2023-01-05T12:12:50Z"}
source_type:                 kubernetes_logs
stream:                      stderr
Fluent Bit #
Fluent Bit is a logs and metrics processor and forwarder. With a historical focus on logs and written in C to minimize any overheads, FluentBit aims to be lightweight and fast. The code was initially developed by TreasureData but has long been open-sourced as a Cloud Native Computing Foundation project under an Apache 2.0 license. Adopted as a first-class citizen by multiple cloud providers, it offers comparable input, processing, and output features to the above tools.
FluentBit uses inputs, parsers/filters, and outputs for its pipeline (and buffer and router concepts beyond scope of this post). An aggregator instance is referred to as an aggregator.
ClickHouse support #
luentBit does not have a ClickHouse-specific output, relying on generic HTTP support. This works well and relies on inserting data in JSONEachRow format. However, users need to be cautious with this approach as the output does not perform any batching. FluentBit thus needs to be configured appropriately to avoid lots of small inserts and “too many part” issues. Users should be aware that Fluent bit stores everything in chunks. These chunks have a data structure of a tag and a payload size of up to 2MB. When using Kubernetes, each container outputs to a separate file identified by a dynamic tag. The tag is also used to read individual chunks.. These chunks are flushed independently by tag, by the agent, to the aggregator per the flush interval. The aggregator retains tag information for any downstream routing needs. It will use its own flush interval setting for each tag to determine writes to ClickHouse. Users thus have two options:
- Configure a large flush interval, i.e., at least 10s, on the agent and aggregator. This can be effective but can also result in a thundering-herd effect, causing spikes in inserts to ClickHouse. However, internal merges should keep up if the interval is large enough.
- Configure the output to use ClickHouse’s asynchronous inserts - this is especially recommended if you don’t deploy an aggregator instance. This causes ClickHouse to buffer inserts and is the recommended approach to dealing with this write pattern. The behavior of async inserts can be tuned with implications on delivery guarantees to Fluent Bit. Specifically, the setting
wait_for_async_insertcontrols if the write is acknowledged when it is written to the buffer (0) or when it has been written as an actual data part (and available for read queries). A value of 1, provides greater delivery guarantees at the expense of a possible reduction in throughput. Note that the Fluent Bit offset management and advancing is based on the acknowledgment from the output. A value of 0 forwait_for_async_insertmaybe mean data is acknowledged prior to it being fully processed, i.e., subsequent failure could occur, causing data loss. This may be acceptable in some cases. Note also the settingsasync_insert_max_data_sizeandasync_insert_busy_timeout_ms, which control the exact flushing behavior of the buffer.
Without an explicit understanding of ClickHouse, users must pre-create their tables before deployment. Similar to Vector, this leaves the schema decisions to the user. FluentBit creates a nested JSON Schema with a depth greater than 1. This can potentially contain hundreds of fields as a unique column is created for each unique label or annotation. Our previous post proposed using the JSON type for this kubernetes column. This defers column creation to ClickHouse and allows dynamic sub-columns to be created based on the data. This offers a great starting experience but is sub-optimal as users can’t use codecs or use specific sub-columns in the table's ordering key (unless using JSONExtract), leading to poorer compression and slower queries. It can also lead to column explosion in environments without controls over label and annotation use. Furthermore, this feature is currently experimental. A more optimized approach for this schema is moving labels and annotations to a Map type - this conveniently reduces the kubernetes column to a depth of 1. This requires us to modify the data structure slightly in our processor pipeline and results in the following schema.
CREATE TABLE fluent.fluent_logs
(
    `timestamp` DateTime64(9),
    `log` String,
    `kubernetes` Map(LowCardinality(String), String),
    `host` LowCardinality(String),
    `pod_name` LowCardinality(String),
    `stream` LowCardinality(String),
    `labels` Map(LowCardinality(String), String),
    `annotations` Map(LowCardinality(String), String)
)
ENGINE = MergeTree
ORDER BY (host, pod_name, timestamp)
Kubernetes deployment #
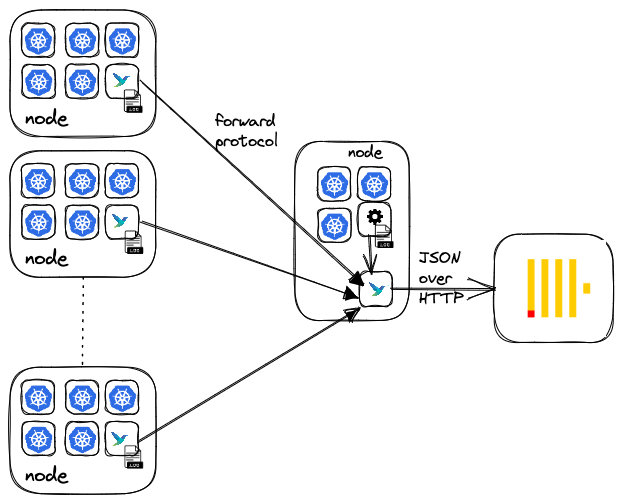
A previous blog post discussed the deployment of Fluent Bit to collect Kubernetes logs to ClickHouse in detail. This post focused on deploying an agent-only architecture with no aggregator. The general configuration still applies with a few differences to improve the schema and introduce the aggregator.
The complete installation details for both the aggregator and agent can be found here, as well as sample configurations. A few important details regarding the configuration:
- We utilize a different Lua script to move specific fields to the root out of the
kuberneteskey, allowing these to be used in the ordering key. We also move annotations and labels to the root. This allows them to be declared as a Map type and excluded from Compression statistics later as they are very sparse. Furthermore, this means ourkubernetescolumn has only a single layer of nesting and can be declared as a Map also. - An aggregator output specifies the use of async_inserts in the URI. We combine this with a flush interval of 5 seconds. In our example, we do not specify
wait_for_async_insert=1but this can be appended as a parameter as required.
Data #
We can confirm log data is being inserted with a simple query:
SELECT *
FROM fluent.fluent_logs
LIMIT 1
FORMAT Vertical


Row 1:
──────
timestamp:   2023-01-05 13:11:36.452730318
log:         2023.01.05 13:11:36.452588 [ 41 ] {}  RaftInstance: Receive a append_entries_request message from 1 with LastLogIndex=298734, LastLogTerm=17, EntriesLength=0, CommitIndex=298734 and Term=17

kubernetes:  {'namespace_name':'ns-chartreuse-at-71','container_hash':'609927696493.dkr.ecr.us-west-2.amazonaws.com/clickhouse-keeper@sha256:e9efecbef9498dea6ddc029a8913dc391c49c7d0b776cb9b1c767cdb1bf15489',...}
host:        ip-10-1-3-9.us-west-2.compute.internal
pod_name:    c-chartreuse-at-71-keeper-2
stream:      stderr
labels:      {'controller-revision-hash':..}
Interoperability and choosing a stack #
Our previous examples will assume the same use of technology for both the agent and aggregator. Often this is not optimal or simply impossible due to organizational standards or lack of support for a specific data type in an agent. For example, if you’re using the Open Telemetry language agents for tracing, you will likely have an OTEL Collector deployed as an aggregator. In this case, you may choose Fluent Bit as your preferred logs collection agent (due to its greater maturity for this data type) but continue using the OTEL collector as your aggregator for a consistent data model.
Fortunately, the OTLP protocol, promoted as part of the broader Open Telemetry project, and support for the forward protocol (Fluent Bit’s preferred communication standard) allow interoperability in some cases.
Vector supports these protocols as sources and can act as a logs aggregator for Fluent Bit and the Open Telemetry Collector. However, it does not support these protocols as a sink, making it challenging to deploy as an agent in environments where either the OTEL collector or Fluent Bit is already deployed. Note that Vector is strongly opinionated on which components of your stack you should replace Vector with.
Fluent Bit recently added OTLP support as an input and output, potentially allowing a high degree of interoperability with the OTEL collector (which also supports the forward protocol as a receiver). Fluent Bit as a log collection agent, sending to an OTEL collector over either the forward or OTEL protocol, has become increasingly popular, especially in environments where Open Telemetry is already a standard.
Note: as of the time of writing, we have experienced issues with the OTLP input and output for Fluent Bit, although we expect this to be addressed soon.
We summarize the current compatibility state below for log collection and link to example Helm configurations, with details on known issues that can be used similarly to the above. Note that this is for log collection only.
| agent | Vector | OTEL Collector | Fluent Bit |
|---|---|---|---|
| aggregator | |||
| Vector | Y ✎ | Y ✎ | Y ✎ |
| OTEL Collector | N | Y ✎ | X ✎ |
| Fluent Bit | N | X ✎ | Y ✎ |
Y=Supported N=Not Supported X=Known Issues |
When an agent is configured as an aggregator to receive events from a different technology, the resulting data schema will differ from an equivalent homogeneous architecture. The above links show examples of the resulting schema. Users may need to use the transformation capabilities of each agent if consistent schemas are required.
Compression #
One of the principal benefits of storing log data in ClickHouse is its great compression: a product of its column-orientated design and configurable codecs. The following query shows that our compression rates range from 14x to 30x on the previously collected data, depending on the aggregator. These represent non-optimized schemas (although the default OTEL schema is sensible), so further compression could be achieved with tuning. An astute reader will notice that we exclude Kubernetes labels and annotations, which are added for the Fluent Bit and Vector deployments by default but not by the OTEL collector (this is supported for the OTEL Collector but requires additional configuration). This data is highly sparse and compresses exceptionally well since most annotations exist on a small subset of pods. This distorts compression ratios (increasing them) as most values are empty, so we choose to exclude them - the good news is they occupy little space when compressed.
SELECT
    database,
    table,
    formatReadableSize(sum(data_compressed_bytes)) AS compressed_size,
    formatReadableSize(sum(data_uncompressed_bytes)) AS uncompressed_size,
    round(sum(data_uncompressed_bytes) / sum(data_compressed_bytes), 2) AS ratio
FROM system.columns
WHERE (database IN ('fluent', 'vector', 'otel')) AND (name NOT LIKE '%labels%') AND (name NOT LIKE '%annotations%')
GROUP BY
    database,
    table
ORDER BY
    database ASC,
    table ASC

┌─database─┬─table───────┬─compressed_size─┬─uncompressed_size─┬─ratio─┐
│ fluent   │ fluent_logs │ 2.43 GiB        │ 80.23 GiB         │ 33.04 │
│ otel     │ otel_logs   │ 5.57 GiB        │ 78.51 GiB         │  14.1 │
│ vector   │ vector_logs │ 3.69 GiB        │ 77.92 GiB         │ 21.13 │
└──────────┴─────────────┴─────────────────┴───────────────────┴───────┘
We look into the reasons for these varying compression rates in a later post, but even for a first attempt, the above compression rates show huge potential vs. other solutions. These schemas can be normalized, and comparable compression rates achieved independent of the agent, so these results should not be used to compare the agents.
Example of high compression for annotations:
SELECT
    name,
    table,
    formatReadableSize(sum(data_compressed_bytes)) AS compressed_size,
    formatReadableSize(sum(data_uncompressed_bytes)) AS uncompressed_size,
    round(sum(data_uncompressed_bytes) / sum(data_compressed_bytes), 2) AS ratio
FROM system.columns
WHERE (database IN ('fluent', 'vector', 'otel')) AND ((name LIKE '%labels%') OR (name LIKE '%annotations%'))
GROUP BY
    database,
    table,
    name
ORDER BY
    database ASC,
    table ASC

┌─name────────────────────────┬─table───────┬─compressed_size─┬─uncompressed_size─┬──ratio─┐
│ labels                      │ fluent_logs │ 2.95 MiB        │ 581.31 MiB        │ 196.93 │
│ annotations                 │ fluent_logs │ 14.97 MiB       │ 7.17 GiB          │ 490.57 │
│ kubernetes_pod_annotations  │ vector_logs │ 36.67 MiB       │ 23.97 GiB         │ 669.29 │
│ kubernetes_node_labels      │ vector_logs │ 18.67 MiB       │ 4.18 GiB          │ 229.55 │
│ kubernetes_pod_labels       │ vector_logs │ 6.89 MiB        │ 1.88 GiB          │ 279.92 │
│ kubernetes_namespace_labels │ vector_logs │ 3.91 MiB        │ 468.14 MiB        │ 119.62 │
└─────────────────────────────┴─────────────┴─────────────────┴───────────────────┴────────┘
We explore this in future posts but recommend Optimizing ClickHouse with Schemas and Codecs as interim reading.
Querying & Visualizing Logs #
Common queries #
Log data is effectively time-series data for which ClickHouse has many functions to assist with queries. We cover these extensively in a recent blog post where most query concepts are relevant. Most dashboards and investigations require aggregation over time to draw time-series charts, followed by subsequent filters on server/pod names or error codes. Our examples below use logs collected by Vector, but these can be adapted for other agent data which collect similar fields.
Logs over time by pod name #
Here, we group by a custom interval and use a fill to populate missing groups. Adapt as required. See our recent blog for further details.
SELECT
    toStartOfInterval(timestamp, toIntervalDay(1)) AS time,
    kubernetes_pod_name AS pod_name,
    count() AS c
FROM vector.vector_logs
GROUP BY
    time,
    pod_name
ORDER BY
    pod_name ASC,
    time ASC WITH FILL STEP toIntervalDay(1)
LIMIT 5

┌────────────────time─┬─pod_name──────────────────────────────────────────┬─────c─┐
│ 2023-01-05 00:00:00 │ argocd-application-controller-0                   │  8736 │
│ 2023-01-05 00:00:00 │ argocd-applicationset-controller-745c6c86fd-vfhzp │     9 │
│ 2023-01-05 00:00:00 │ argocd-notifications-controller-54495dd444-b824r  │ 15137 │
│ 2023-01-05 00:00:00 │ argocd-repo-server-d4787b66b-ksjps                │  2056 │
│ 2023-01-05 00:00:00 │ argocd-server-58dd79dbbf-wbthh                    │     9 │
└─────────────────────┴───────────────────────────────────────────────────┴───────┘

5 rows in set. Elapsed: 0.270 sec. Processed 15.62 million rows, 141.97 MB (57.76 million rows/s., 524.86 MB/s.)
Logs within a specific time window for a pod #
SELECT
    timestamp,
    kubernetes_pod_namespace AS namespace,
    kubernetes_pod_name AS pod,
    kubernetes_container_name AS container,
    message
FROM vector.vector_logs
WHERE (kubernetes_pod_name = 'argocd-application-controller-0') AND ((timestamp >= '2023-01-05 13:40:00.000') AND (timestamp <= '2023-01-05 13:45:00.000'))
ORDER BY timestamp DESC
LIMIT 2
FORMAT Vertical

Row 1:
──────
timestamp: 2023-01-05 13:44:41.516
namespace: argocd
pod:       argocd-application-controller-0
container: application-controller
message:   W0105 13:44:41.516636       1 warnings.go:70] policy/v1beta1 PodSecurityPolicy is deprecated in v1.21+, unavailable in v1.25+

Row 2:
──────
timestamp: 2023-01-05 13:44:09.515
namespace: argocd
pod:       argocd-application-controller-0
container: application-controller
message:   W0105 13:44:09.515884       1 warnings.go:70] policy/v1beta1 PodSecurityPolicy is deprecated in v1.21+, unavailable in v1.25+

2 rows in set. Elapsed: 0.219 sec. Processed 1.94 million rows, 21.59 MB (8.83 million rows/s., 98.38 MB/s.)
Querying the Map type #
Many of the above agents produce a similar schema and use the Map data type for Kubernetes annotations and labels. Users can use a map notation to access the nested keys in addition to specialized ClickHouse map functions if filtering or selecting these columns.
SELECT
    kubernetes_pod_labels['statefulset.kubernetes.io/pod-name'] AS statefulset_pod_name,
    count() AS c
FROM vector.vector_logs
WHERE statefulset_pod_name != ''
GROUP BY statefulset_pod_name
ORDER BY c DESC
LIMIT 10

┌─statefulset_pod_name────────┬──────c─┐
│ c-snow-db-40-keeper-2       │ 587961 │
│ c-coral-cy-94-keeper-0      │ 587873 │
│ c-ivory-es-35-keeper-2      │ 587331 │
│ c-feldspar-hh-33-keeper-2   │ 587169 │
│ c-steel-np-64-keeper-2      │ 586828 │
│ c-fuchsia-qe-86-keeper-2    │ 583358 │
│ c-canary-os-78-keeper-2     │ 546849 │
│ c-salmon-sq-90-keeper-1     │ 544693 │
│ c-claret-tk-79-keeper-2     │ 539923 │
│ c-chartreuse-at-71-keeper-1 │ 538370 │
└─────────────────────────────┴────────┘

10 rows in set. Elapsed: 0.343 sec. Processed 16.98 million rows, 3.15 GB (49.59 million rows/s., 9.18 GB/s.)

// use groupArrayDistinctArray to list all pod label keys
SELECT groupArrayDistinctArray(mapKeys(kubernetes_pod_annotations))
FROM vector.vector_logs
LIMIT 10

['clickhouse.com/chi','clickhouse.com/namespace','release','app.kubernetes.io/part-of','control-plane-id','controller-revision-hash','app.kubernetes.io/managed-by','clickhouse.com/replica','kind','chart','heritage','cpu-request','memory-request','app.kubernetes.io/version','app','clickhouse.com/ready','clickhouse.com/shard','clickhouse.com/settings-version','control-plane','name','app.kubernetes.io/component','updateTime','clickhouse.com/app','role','pod-template-hash','app.kubernetes.io/instance','eks.amazonaws.com/component','clickhouse.com/zookeeper-version','app.kubernetes.io/name','helm.sh/chart','k8s-app','statefulset.kubernetes.io/pod-name','clickhouse.com/cluster','component','pod-template-generation']
Find pods with logs containing a specific string #
Pattern matching on log lines is possible via ClickHouse string and regex functions, as shown below:
SELECT
    kubernetes_pod_name,
    count() AS c
FROM vector.vector_logs
WHERE message ILIKE '% error %'
GROUP BY kubernetes_pod_name
ORDER BY c DESC
LIMIT 5

┌─kubernetes_pod_name──────────────────────────────────────────┬───c─┐
│ falcosidekick-ui-redis-0                                     │ 808 │
│ clickhouse-operator-clickhouse-operator-helm-dc8f5789b-lb88m │  48 │
│ argocd-repo-server-d4787b66b-ksjps                           │  37 │
│ kube-metric-forwarder-7df6d8b686-29bd5                       │  22 │
│ c-violet-sg-87-keeper-1                                      │  22 │
└──────────────────────────────────────────────────────────────┴─────┘

5 rows in set. Elapsed: 0.578 sec. Processed 18.02 million rows, 2.79 GB (31.17 million rows/s., 4.82 GB/s.)
Find pods having problems using a regex #
SELECT
    kubernetes_pod_name,
    arrayCompact(extractAll(message, 'Cannot resolve host \\((.*)\\)')) AS cannot_resolve_host
FROM vector.vector_logs
WHERE match(message, 'Cannot resolve host')
LIMIT 5
FORMAT PrettyCompactMonoBlock

┌─kubernetes_pod_name─────┬─cannot_resolve_host──────────────────────────────────────────────────────────────────────────┐
│ c-violet-sg-87-keeper-0 │ ['c-violet-sg-87-keeper-1.c-violet-sg-87-keeper-headless.ns-violet-sg-87.svc.cluster.local'] │
│ c-violet-sg-87-keeper-0 │ ['c-violet-sg-87-keeper-2.c-violet-sg-87-keeper-headless.ns-violet-sg-87.svc.cluster.local'] │
│ c-violet-sg-87-keeper-0 │ ['c-violet-sg-87-keeper-1.c-violet-sg-87-keeper-headless.ns-violet-sg-87.svc.cluster.local'] │
│ c-violet-sg-87-keeper-0 │ ['c-violet-sg-87-keeper-2.c-violet-sg-87-keeper-headless.ns-violet-sg-87.svc.cluster.local'] │
│ c-violet-sg-87-keeper-0 │ ['c-violet-sg-87-keeper-1.c-violet-sg-87-keeper-headless.ns-violet-sg-87.svc.cluster.local'] │
└─────────────────────────┴──────────────────────────────────────────────────────────────────────────────────────────────┘

5 rows in set. Elapsed: 0.690 sec. Processed 18.04 million rows, 2.76 GB (26.13 million rows/s., 3.99 GB/s.)
Optimizing performance #
Query performance on the data generated by the above agents will depend mainly on the ordering keys defined during table creation. These should match your typical workflows and access patterns. Ensure that the columns you typically filter by in your workflows are present in the ORDER BY table declaration. The ordering of these columns should also consider their respective cardinalities to ensure the optimal filtering algorithms can be used in ClickHouse. In most cases, order your columns in order of increasing cardinality. For logs, this typically means placing the server or pod name first, followed by the timestamp: but again, this depends on how you plan to filter. Beyond 3-4, columns within a key are typically not recommended and provide little value. Instead, consider alternatives for accelerating queries as discussed in the post Supercharging your ClickHouse queries and Working with time series data in Clickhouse.
The Map type is prevalent in many of the schemas in this post. This type requires the values and keys to have the same type - sufficient for Kubernetes labels. Be aware that when querying a subkey of a Map type, the entire parent column is loaded. If the map has many keys, this can incur a significant query penalty. If you need to query a specific key frequently, consider moving it into its own dedicated column at the root.
Note that we currently find the OTEL collector's default table schema and ordering key can make some queries expensive once datasets get larger, especially if your access patterns do not match the key. Users should evaluate the schema against their workflows and create their tables in advance to avoid this.
The OTEL schema provides inspiration for using partitions to manage data using TTLs. This is especially relevant to log data, where retention is typically only required for days before deletion can occur. Note that partitions can either positively or negatively impact query performance: If most queries hit a single partition, query performance improvement can improve. Conversely, if queries usually hit multiple partitions, it can result in degraded performance.
Finally, even if your access patterns deviate from your ordering keys, linear scans are extremely fast in ClickHouse, making most queries still practical. A future post will explore optimizing schemas and ordering keys for logs in more detail.
Visualization Tools #
We currently recommend Grafana for visualizing and exploring log data using the official ClickHouse plugin. Previous posts and videos have explored this plugin in depth.
Our previous blog post using Fluent Bit demonstrated visualizing log data from Kubernetes in Grafana. This dashboard can be downloaded from here and imported into Grafana as shown below - note the dashboard id 17284. Adapting this to a specific choice of agent is left to the reader.
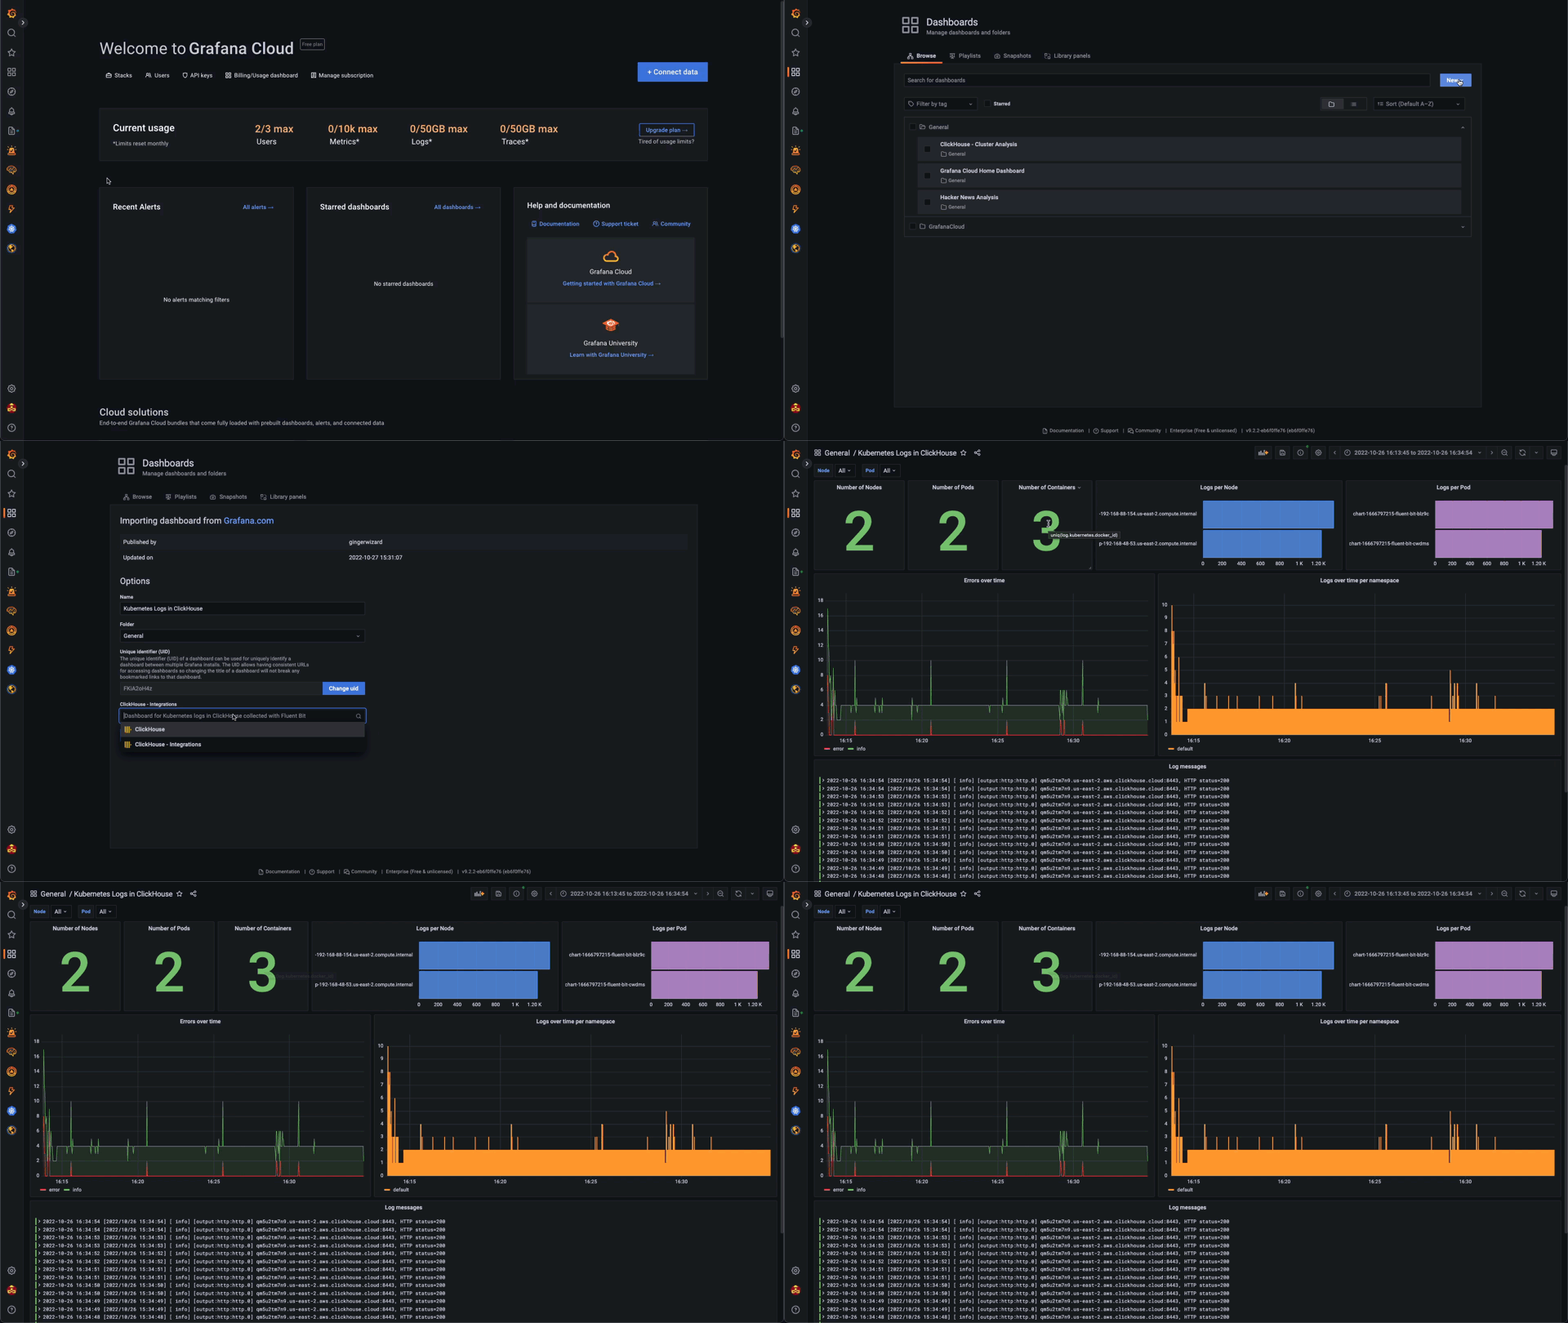
A read only version of this dashboard is available here
Conclusion #
This blog post shows how logs can easily be collected and stored in ClickHouse using a combination of agents and technologies. While we have used a modern Kubernetes architecture to illustrate this, these tools apply equally to more legacy self-managed servers or container orchestration systems. We also have touched on queries and possible interoperability approaches and challenges. For further reading, we encourage users to explore topics beyond this post, such as how agents handle queues, backpressure, and the delivery guarantees they promise. We will explore these topics in a later post and add metrics and trace data to our ClickHouse instance before also exploring how schemas can be optimized and data managed with lifecycle features.


