We’re open sourcing pg_stat_ch: a PostgreSQL extension that turns every query execution into a fixed-size ~4.6KB event and streams them into ClickHouse.
Once events are in ClickHouse, you can slice and drill into query behavior like an APM: p50 to p99 latency over time, top queries by runtime, errors by app, and “what changed between 2pm and 3pm” across days or months of history.
It’s open-source, Apache 2.0, and supports PostgreSQL 16 to 18. If you want to try it, give the quickstart a go.
In this post, I’ll walk through how it works under the hood, the tradeoffs we made, and how it compares with existing extensions.
Why build pg_stat_ch?
In January, we launched Postgres managed by ClickHouse. We need to understand how the clusters we manage are running, and we want to provide the same level of insight to our customers.
ClickHouse, the analytical database we’re best known for, comes with its own internal system tables that collect everything happening within the server. It’s also built for analytics, so you can just analyse your ClickHouse usage within ClickHouse itself. We rely on this for the managed ClickHouse service in ClickHouse Cloud, as do our customers.
Postgres doesn’t have that level of introspection capability out of the box, and isn’t built for analytics. So, we wanted a way to match that level of detail about what's happening inside Postgres, and the same level of analytical capability to work with it. See below for examples of the kind of insights you can get with pg_stat_ch.
We frequently use extensions like pg_stat_statements, pg_stat_monitor and pg_tracing, and while they cover some parts of the problem, we had 3 primary goals that they didn’t cover:
-
Capture everything a PostgreSQL cluster does: every SELECT, INSERT, DDL, and even the queries that fail.
-
Ship events off to an external system to handle analyses
-
Incur minimal overhead to PostgreSQL
We haven’t shipped pg_stat_ch to production yet, but we’re actively driving it there as part of ClickHouse’s managed Postgres effort. Today it streams per-query events into ClickHouse with a 2KB query text cap and no plan capture yet.
If you operate PostgreSQL at scale, we’d love feedback, and we’ll keep sharing what we learn as it hardens.
Try the unified data stack
ClickHouse + Postgres has become the unified data stack for applications that scale. With Managed Postgres now available in ClickHouse Cloud, this stack is a day-1 decision.
Get accessThe architecture in 30 seconds
Under the hood, pg_stat_ch does the minimum work possible: on the hot path it’s just a memcpy into a shared-memory ring buffer. A background worker wakes up once a second, batches what’s in the buffer, and flushes it using ClickHouse’s native binary protocol with LZ4 compression.
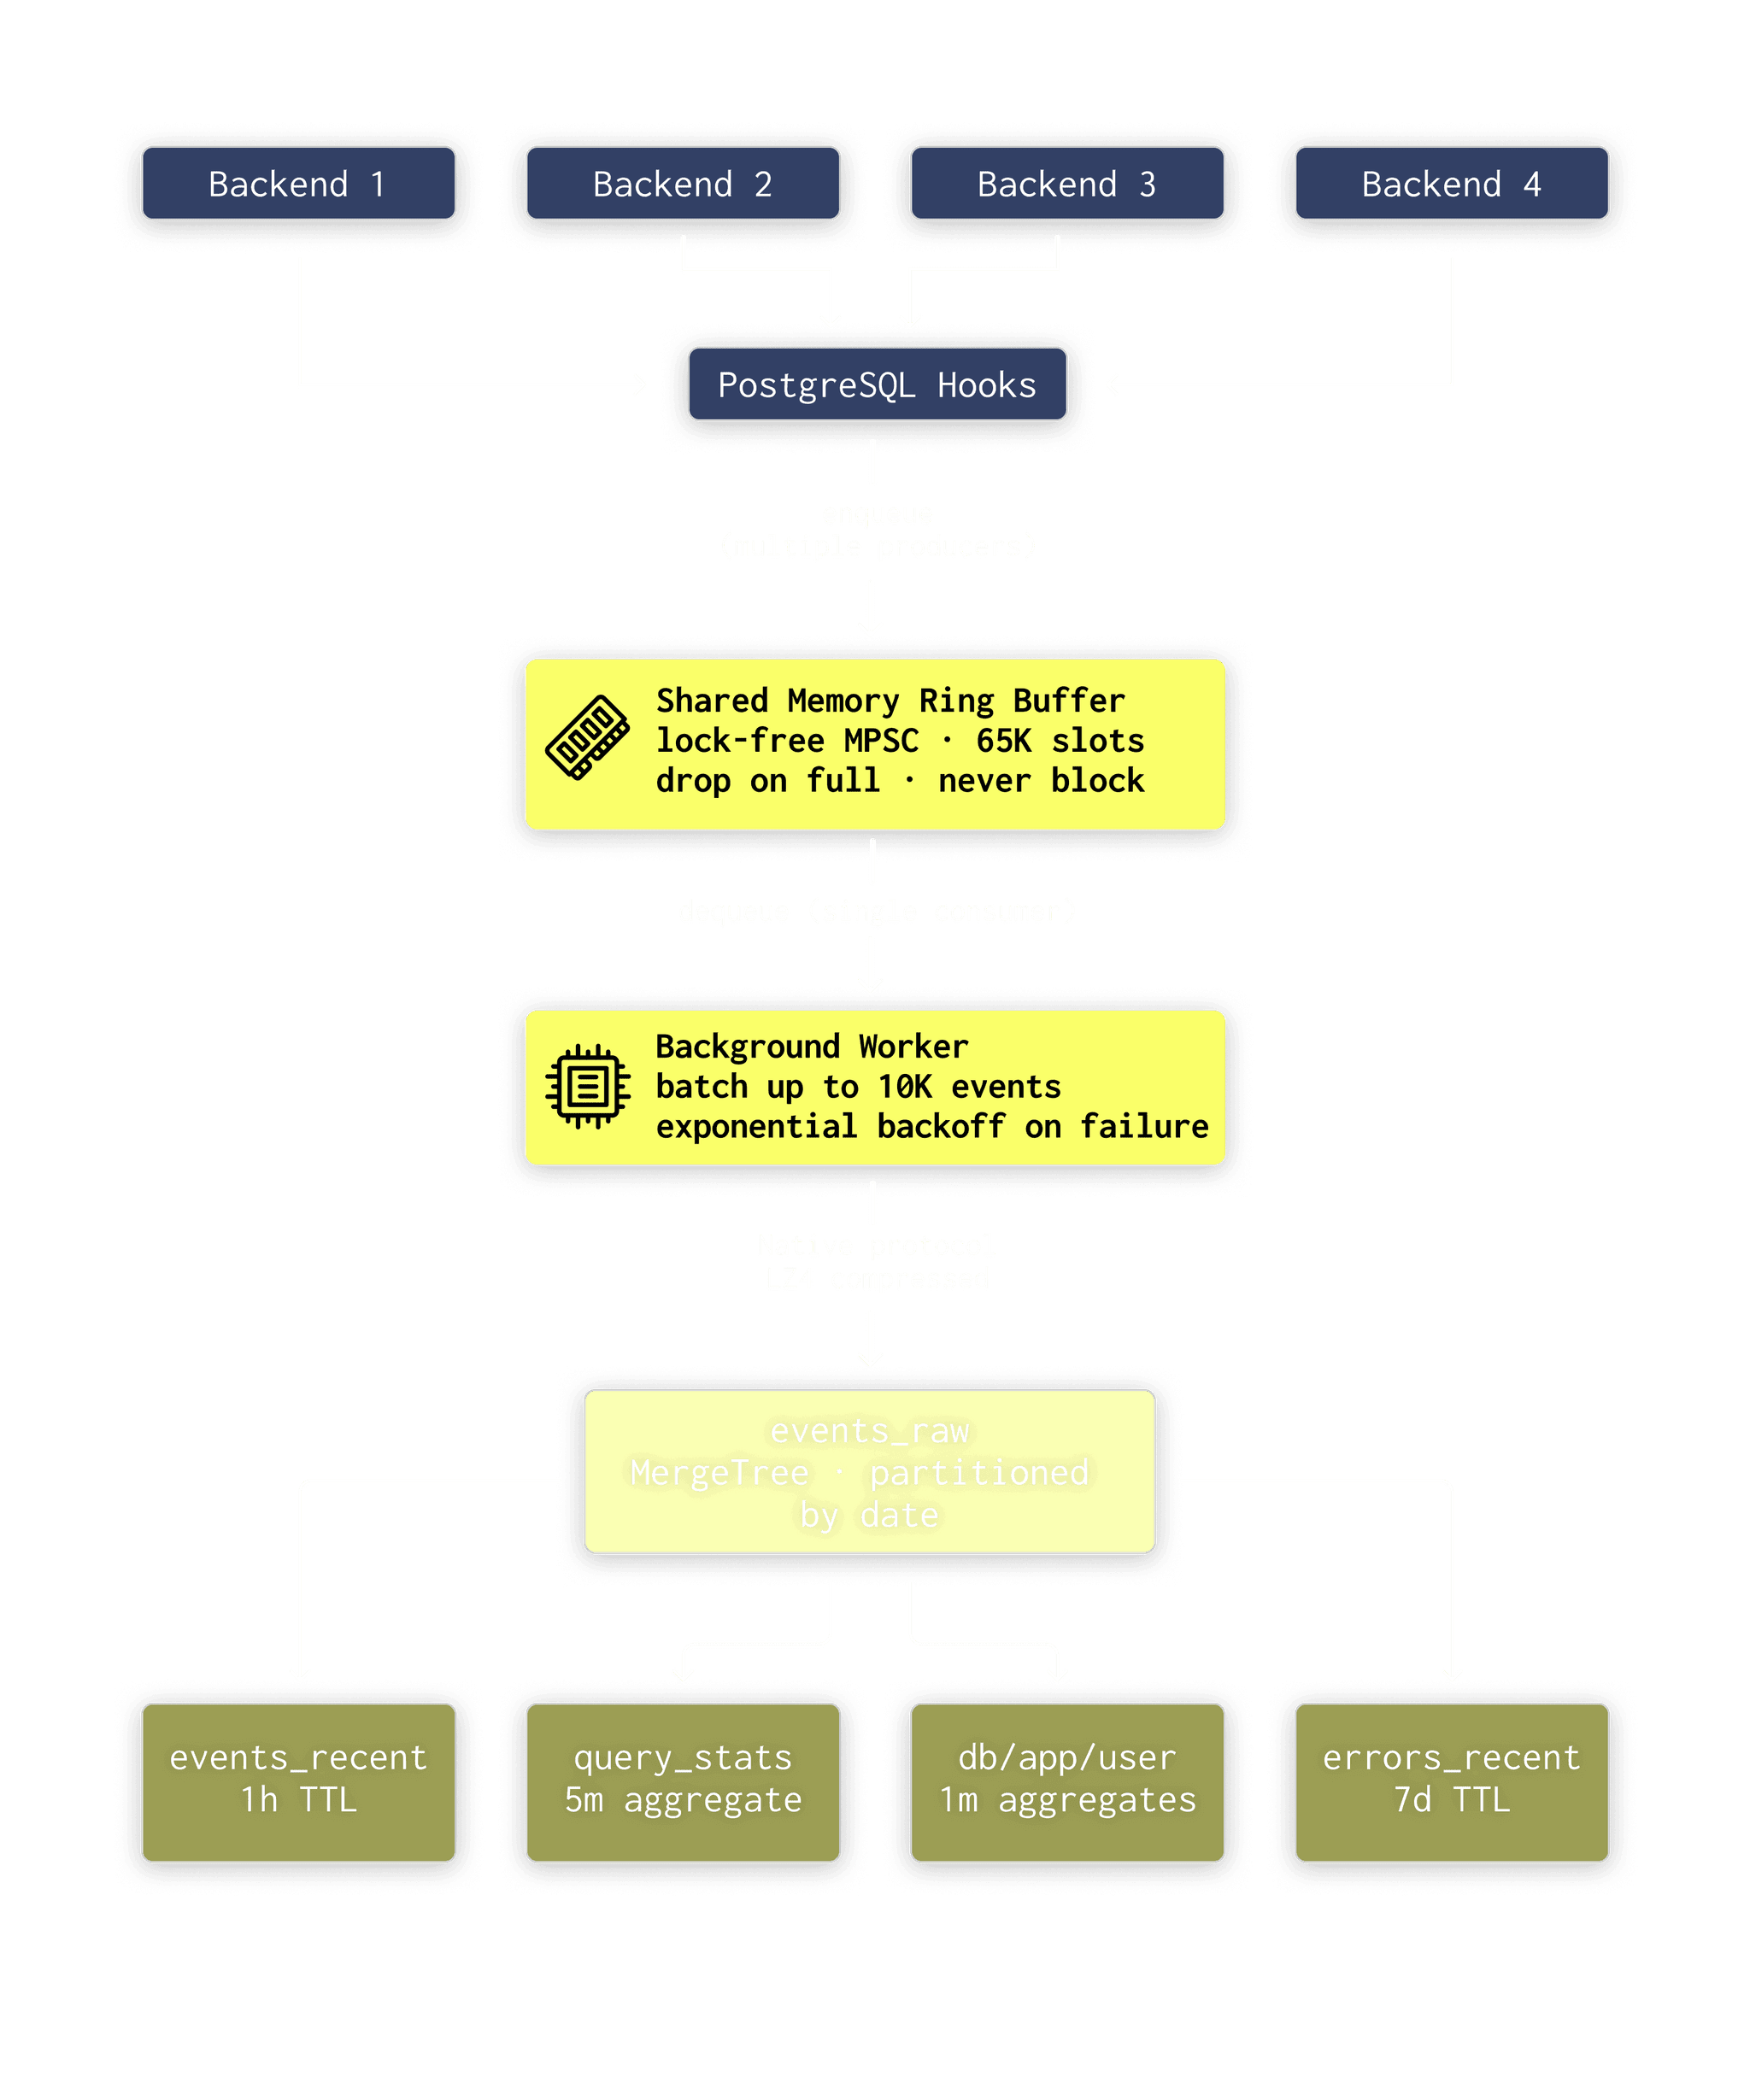
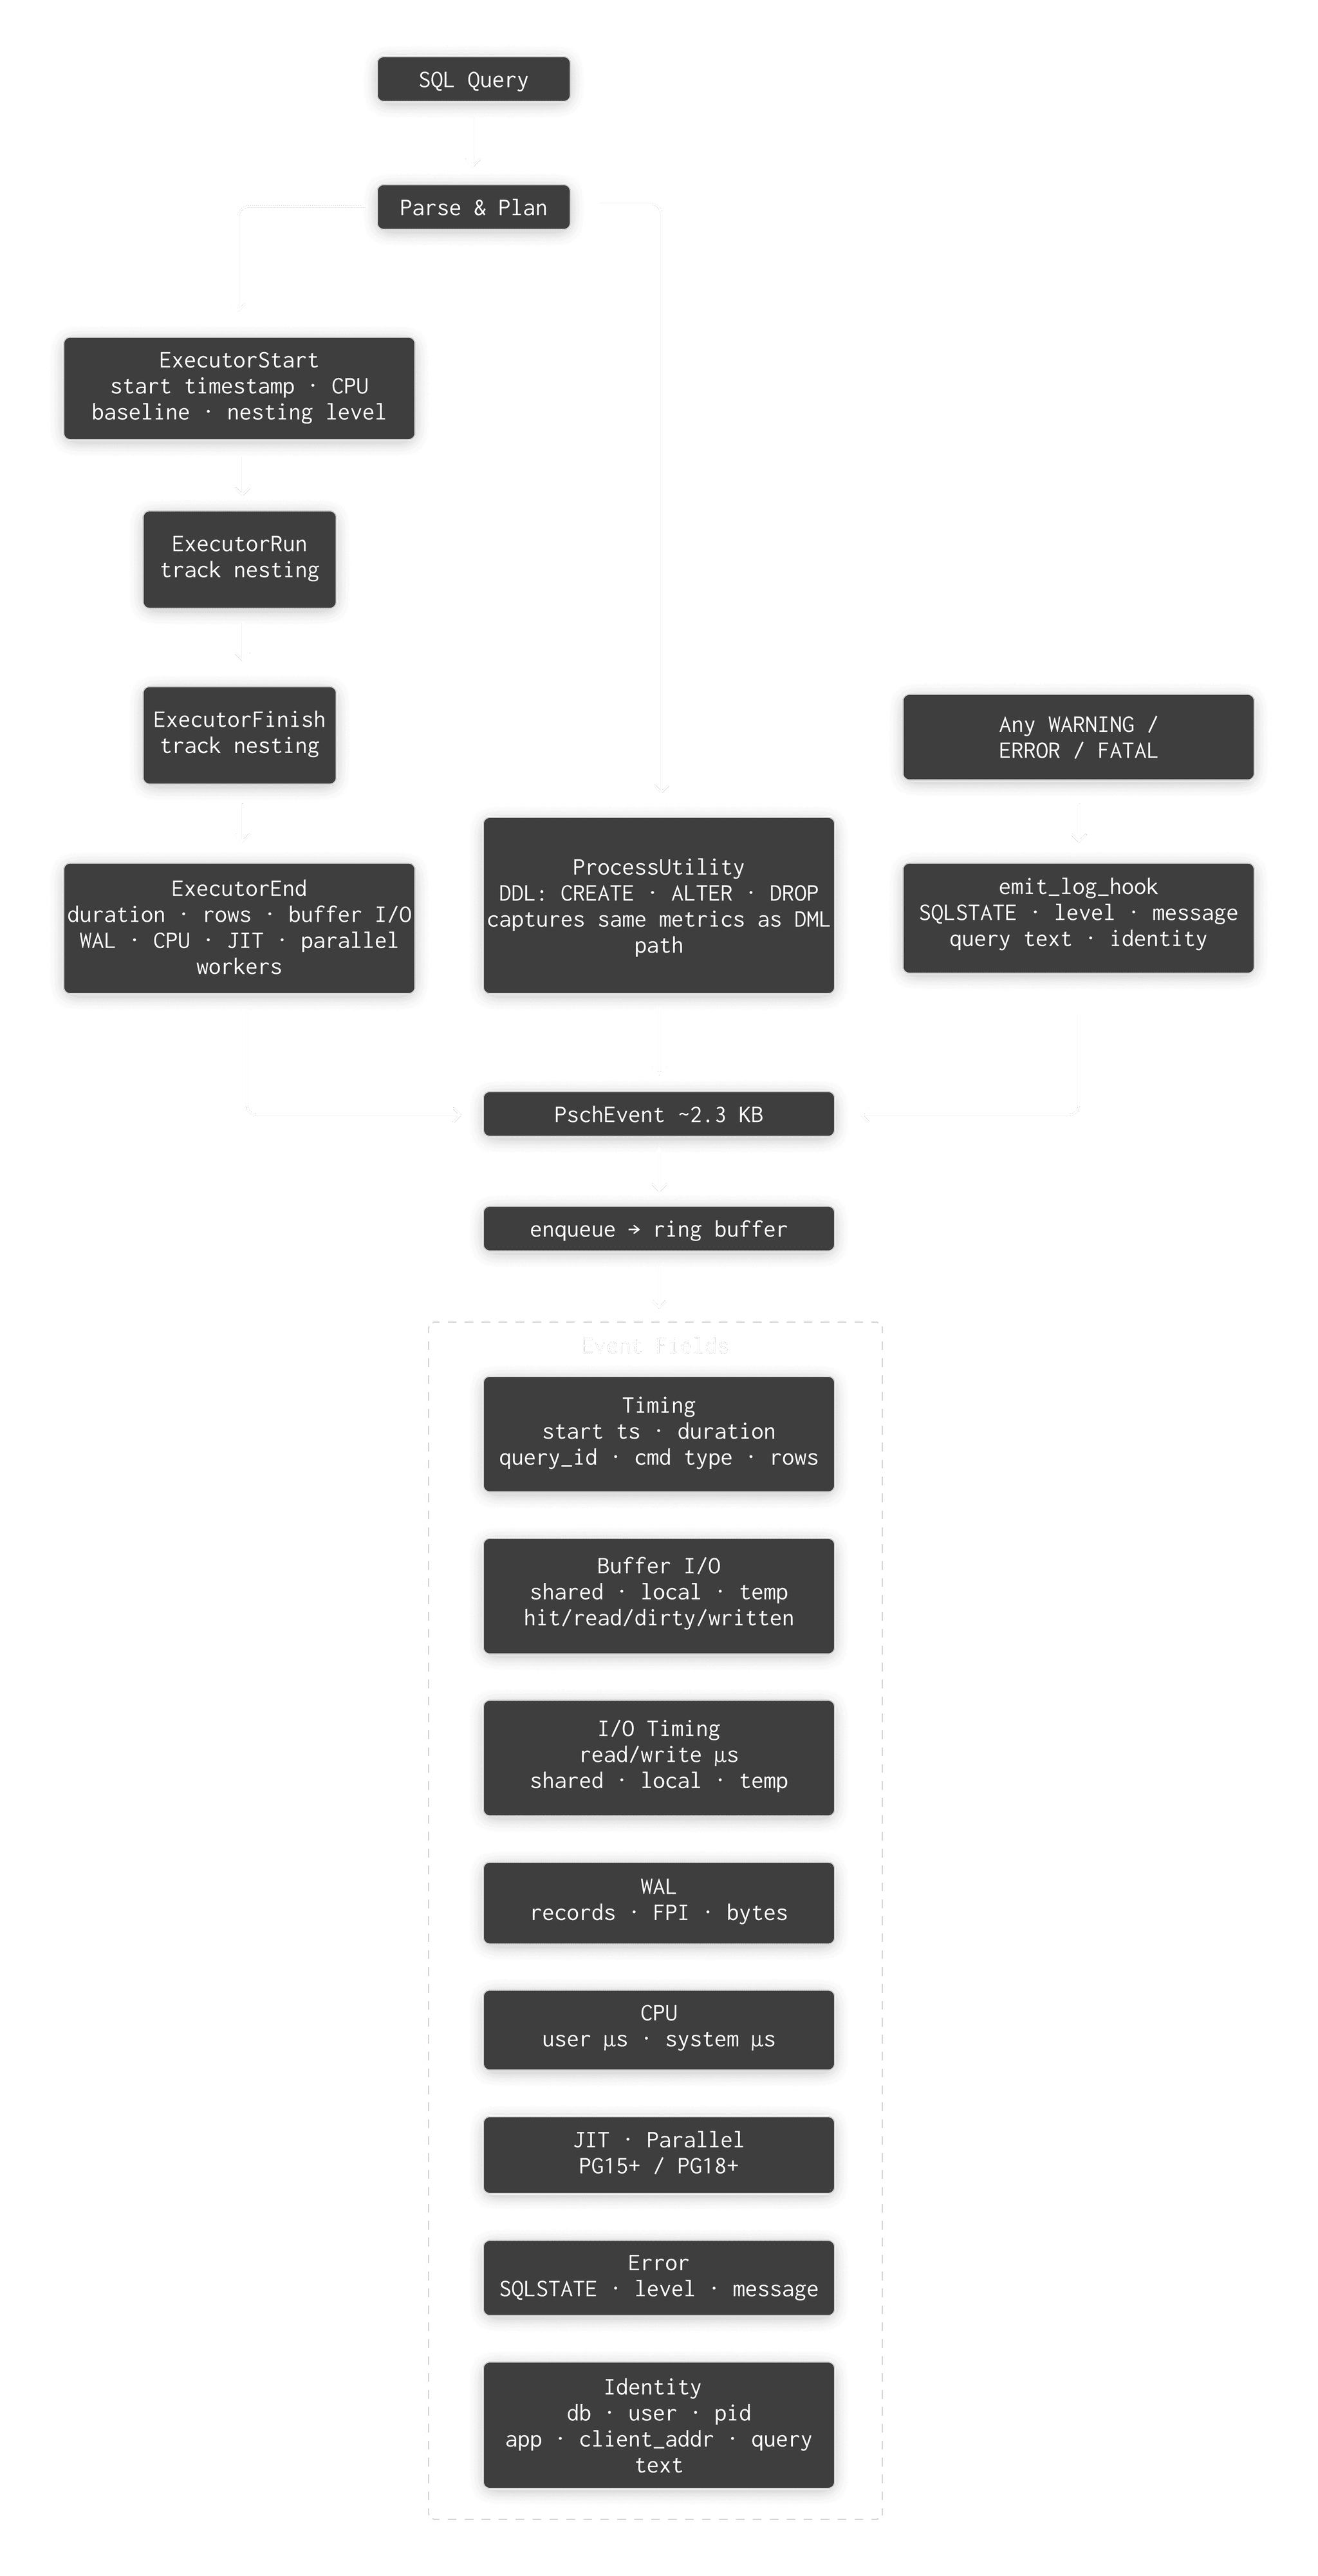
Every time PostgreSQL executes a statement, whether it’s a SELECT, an INSERT, DDL, or even a query that fails with a syntax error, pg_stat_ch records it as a fixed size event. Each event includes 45 fields, covering timing, buffer I/O, WAL, CPU and JIT stats, error details, and basic client context.
From there, the backend does one quick copy into a shared-memory ring buffer and moves on. Once a second, a background worker drains up to 10,000 events, packs them into a columnar block, compresses it with LZ4, and sends it to ClickHouse over the native binary protocol.
On the ClickHouse side, raw events land in the events_raw table, and four materialized views pre-aggregate them into dashboards you can query immediately:
| View | What it does |
|---|---|
| events_recent_1h | Rolling 1-hour copy for “what’s happening right now” |
| query_stats_5m | 5-minute buckets with p95/p99 via quantilesTDigest |
| db_app_user_1m | Per-database/app/user load attribution, 1-minute granularity |
| errors_recent | 7-day rolling window of every error with full context |
The important bit here is that all aggregation happens in ClickHouse, not in PostgreSQL. Postgres captures events and pushes them out. ClickHouse compresses, stores, and answers analytical queries.
Engineering decisions
Decision 1: fixed-size events
We had two options for event data: variable-length (allocate per event based on query text size, like pg_stat_monitor does with PostgreSQL’s DSA allocator) or fixed-size.
We chose fixed-size. The memcpy is fast, but the real cost is LWLock acquisition, name resolution (get_database_name, GetUserNameFromId, GetClientAddress), and getrusage() for CPU timing. We’ll get to the measured overhead below.
The bigger advantage of fixed-size is a predictable memory footprint you can reason about at startup:
queue_capacity = 65,536 events (default)
event_size = ~4.6 KB
total memory = 65,536 × 4.6 KB = 294.4 MBYou know exactly how much shared memory you need at shared_preload_libraries time. The queue capacity and event size are configurable settings, so you can tune based on your workload.
There is a tradeoff: query texts longer than 2KB (or the configured event size) get truncated. You still get the fingerprint (query_id) and all 45 metrics. If it’s running, you can look up the full text by the query_id in pg_stat_statements.
Decision 2: ensure negligible impact on Postgres
The ring buffer is the hottest data structure in the extension. Every backend process writes to it (producers), and one background worker reads from it (consumer). On a busy 32-core system, that’s potentially dozens of concurrent writers.
Here’s the layout:
┌───────────────────────────────────────────┐
│ [Rarely changed] │
│ LWLock* lock │
│ uint32 capacity │
│ │
│ ─── CACHE LINE BOUNDARY (64 bytes) ───────│
│ │
│ [Producer-hot: many backends write] │
│ atomic_uint64 head │
│ atomic_uint64 enqueued │
│ atomic_uint64 dropped │
│ atomic_flag overflow_logged │
│ │
│ ─── CACHE LINE BOUNDARY ──────────────────│
│ │
│ [Consumer-hot: bgworker reads/writes] │
│ atomic_uint64 tail │
│ atomic_uint64 exported │
│ │
│ ─── CACHE LINE BOUNDARY ──────────────────│
│ │
│ [Stats: bgworker writes, anyone reads] │
│ atomic_uint64 send_failures │
│ TimestampTz last_success_ts │
│ TimestampTz last_error_ts |
│ char last_error_text[256] │
│ atomic_uint32 bgworker_pid │
└───────────────────────────────────────────┘The PG_CACHE_LINE_SIZE padding between sections is the critical detail. Without it, every time the background worker updates tail, it invalidates the cache line containing head on every producer’s CPU core. That’s false sharing — and on multi-socket systems it can cost 50–100ns per access. With the separation, producer cores and the consumer core work on independent cache lines and never interfere.
The capacity is always a power of 2 (1,024 to 65,536), so slot addressing uses a bitmask (index & (capacity - 1)) instead of modulo. One fewer division instruction in the hot path.
Decision 3: no back-pressure
There are exactly two ways events can be lost, and both are deliberate:
-
Queue overflow. The ring buffer fills up faster than the background worker drains it. New events are dropped — the producer atomically increments a dropped counter and returns in nanoseconds.
-
Export failure. The background worker dequeues a batch, then the ClickHouse insert fails. Those events are gone. We don’t re-enqueue them.
The alternative is back-pressure. That would mean if ClickHouse slows down or goes offline, PostgreSQL starts feeling it too, and your queries get slower. For us, that’s a non-starter.
For an OLTP system doing 50,000 queries/second, if back-pressure adds a 10ms stall per query during a ClickHouse blip, p99 latency goes from 5ms to 15ms. This would have a material impact on SLOs and users will notice. This is not an acceptable tradeoff for monitoring.
This is the same philosophy behind UDP-based metrics systems (StatsD, DogStatsD): a few lost data points are infinitely preferable to affecting the system you’re observing.
Observability should observe, not obstruct.
The dropped counter is visible via the included pg_stat_ch_stats() function so you can monitor overflow and tune queue_capacity. In practice, with a 1-second flush interval and 10K batch size, you need sustained 65K QPS with a completely stalled ClickHouse to start dropping.
Decision 4: minimize lock contention
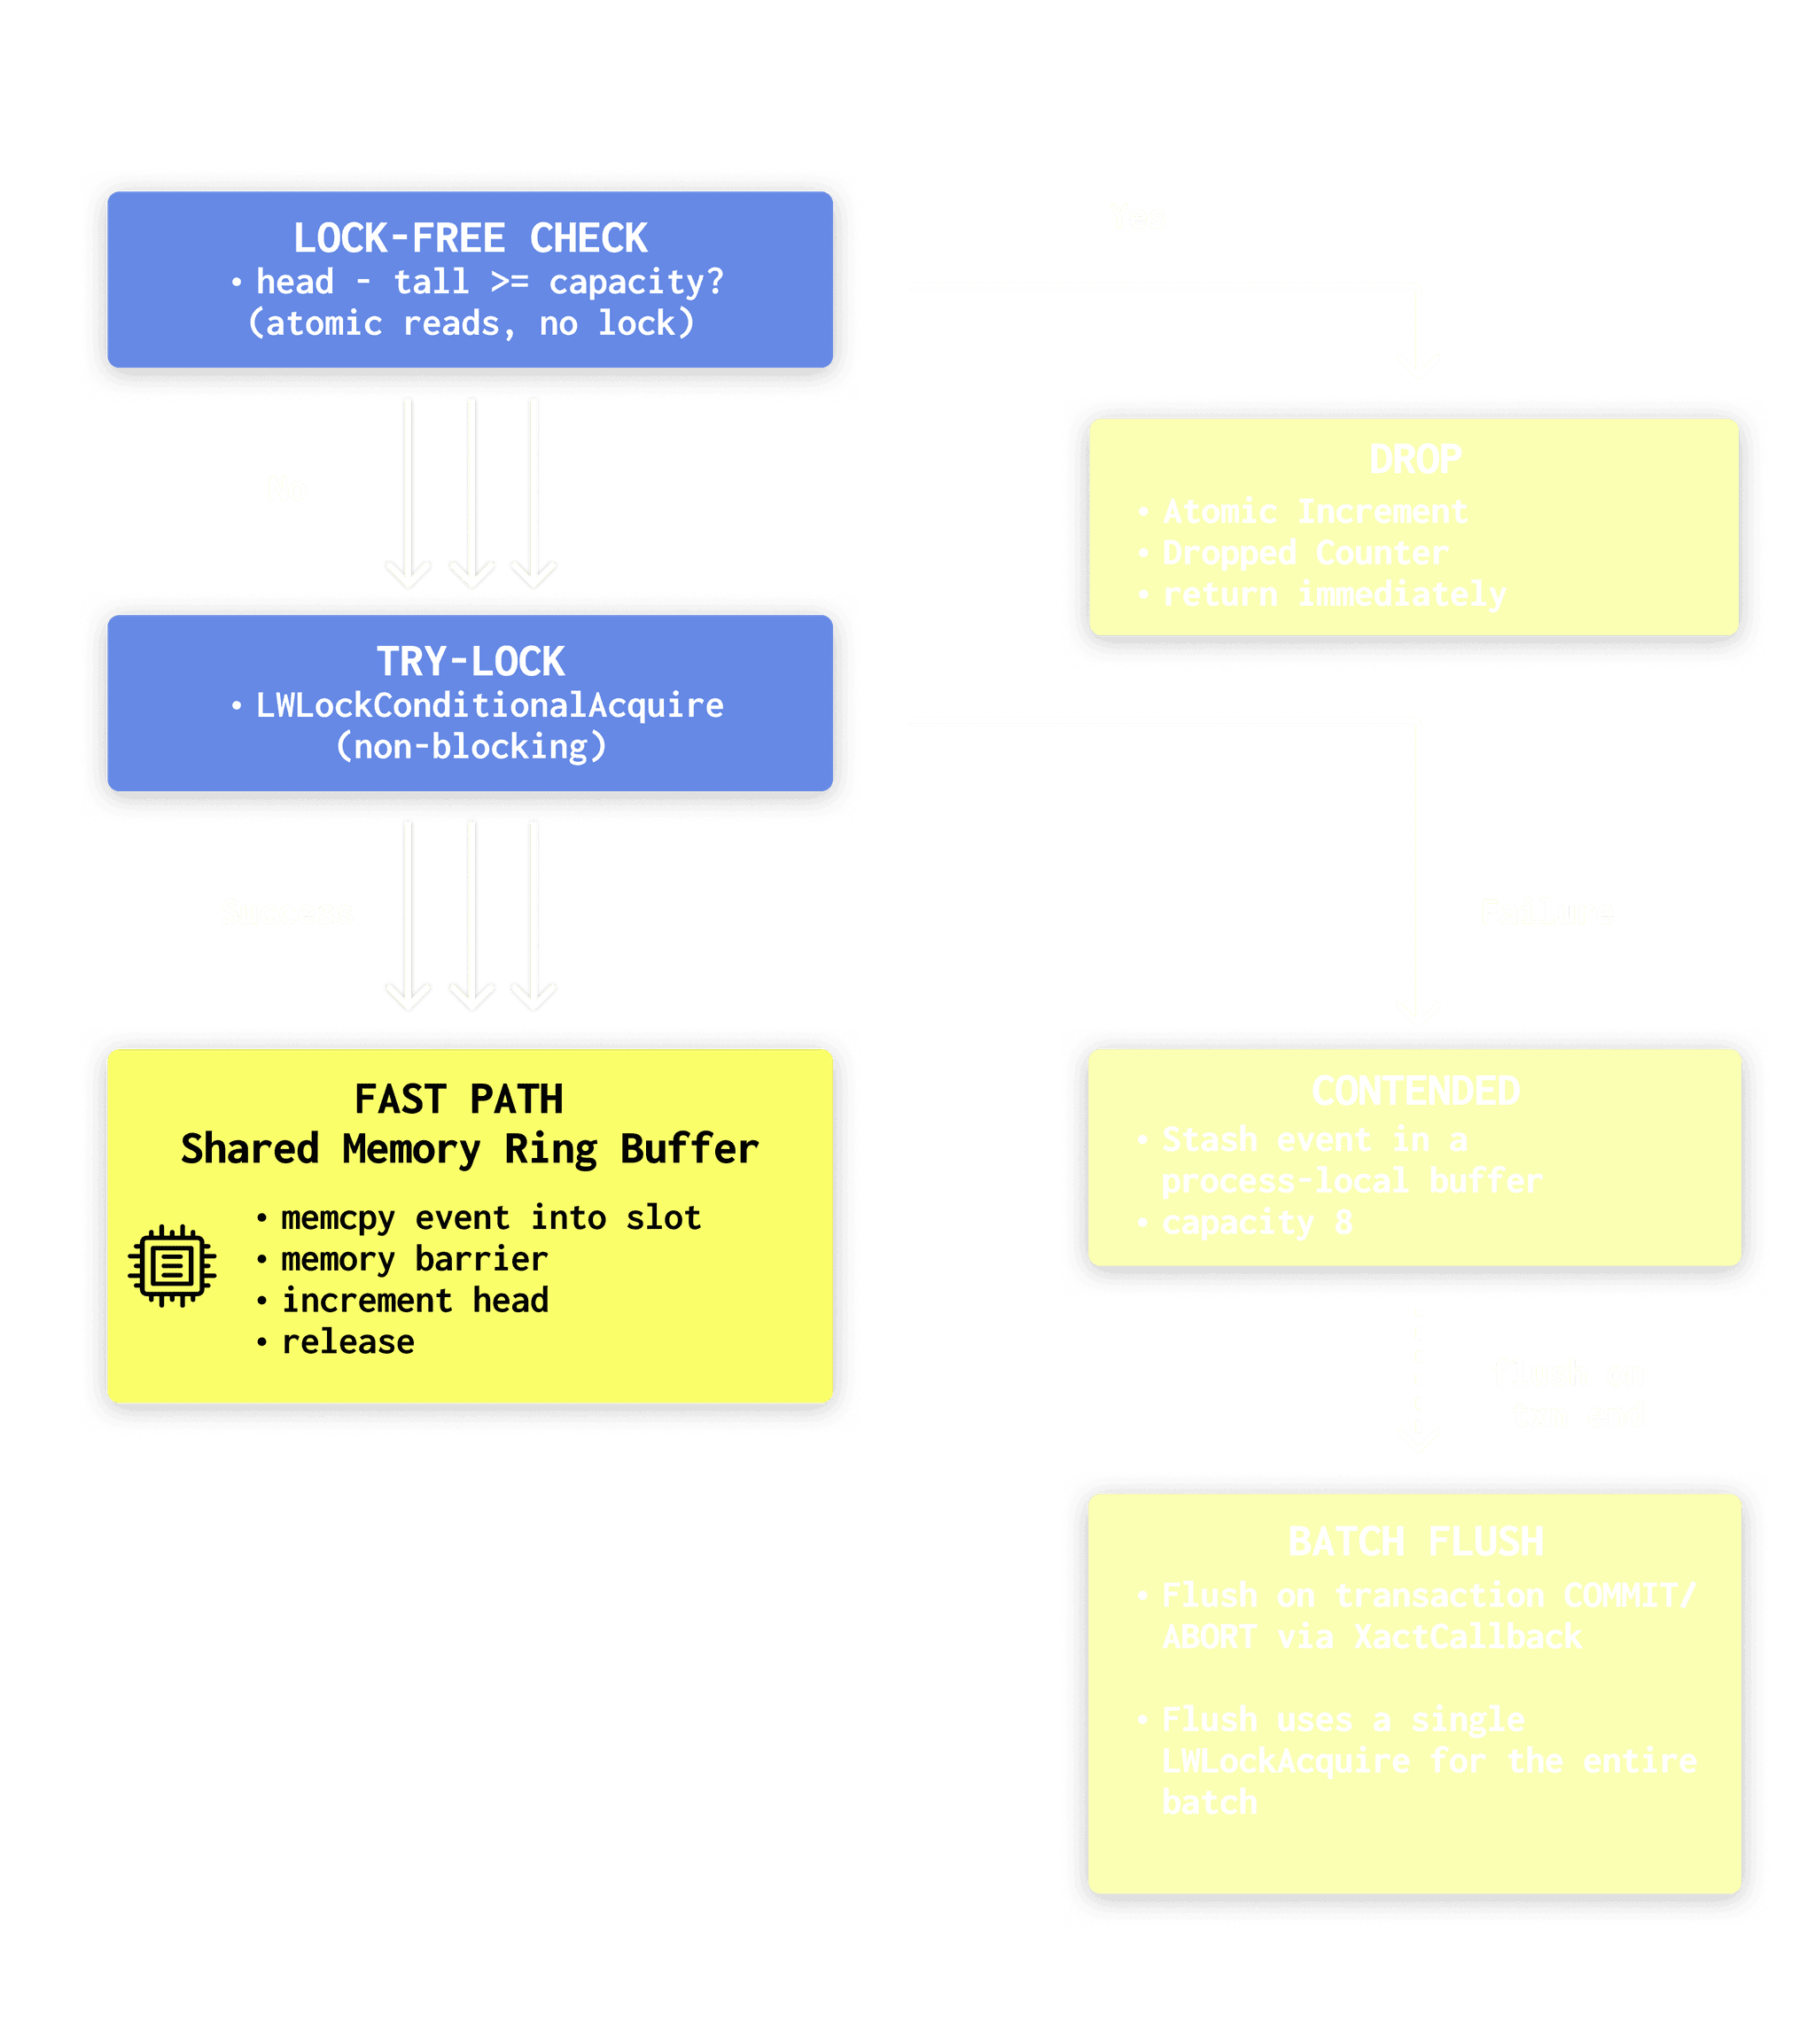
The enqueue path uses three tiers to minimize lock contention:
-
Step 1 is the safety valve. We check for overflow using atomics only. If the ring is full, we drop the event and return immediately. Overflow handling never takes a lock.
-
Step 2 is the normal case. We try to grab the LWLock without blocking. When there is no contention, enqueue looks just like the simple design: take the lock, memcpy into the slot, bump head, release.
-
Step 3 allows it to scale when you have lots of backends running at once (say 32+). Instead of every backend vying for the same exclusive lock for every query, each backend stashes events in a small process-local buffer and flushes them once per transaction. On TPC-B, with about 5 queries per transaction, this design cuts lock acquisitions from roughly 150K per second to about 30K per second, around a 5x reduction.
That process-local buffer lives in static BSS, about 37KB per backend (8 events × ~4.6KB each). pg_stat_ch also registers an on_shmem_exit handler to flush anything left at backend shutdown, exporting buffered events even when a backend exits mid-transaction.
Decision 5: native protocol with LZ4
We use ClickHouse’s native binary protocol via clickhouse-cpp (statically linked into the extension .so) rather than HTTP. Three reasons:
-
LZ4 block compression — critical for reducing bandwidth when shipping thousands of events/second over the network
-
Columnar encoding — data is sent column-major, which ClickHouse can ingest directly without row-to-column transposition
-
Type-safe binary encoding — no JSON parsing overhead
We compile the clickhouse-cpp client into the extension as a static library. That keeps deployment simple: no extra runtime dependencies beyond PostgreSQL (and optionally OpenSSL). The downside is size. Static linking pushes the extension over 20 MB, but we’re fine with that tradeoff if it means fewer “it works on my box” surprises.
We intentionally set socket timeouts to 30 seconds. The background worker still needs to respond to PostgreSQL signals, especially during operations like DROP DATABASE (via procsignal_sigusr1_handler). If we used infinite timeouts and the network to ClickHouse stalled, we could end up hanging DROP DATABASE until the socket unwedged, which is not acceptable.
How we hook into PostgreSQL
PostgreSQL offers extensions a handful of hooks. pg_stat_ch wires into those hooks to capture the right data at the right moment, before Postgres tears down the state we need. Here are the hooks we use, what we do in each one, and why each matters.
| Hook | What pg_stat_ch Does | Why Here? |
|---|---|---|
| ExecutorStart | Record query_start_ts, CPU baseline via getrusage(), enable INSTRUMENT_ALL | Need a time-zero reference before any work. If we don’t enable instrumentation here, Postgres won’t collect buffer/WAL/timing stats at all. |
| ExecutorRun | Increment/decrement nesting level (with PG_FINALLY for exception safety) | Tracks query nesting for CTEs, subqueries, function calls. Otherwise, a nested query’s metrics bleed into the parent. |
| ExecutorFinish | Same nesting-level tracking | AFTER triggers fire here and can execute nested queries — would corrupt the nesting count without tracking. |
| ExecutorEnd | Main collection point. Finalize timing, compute CPU delta, extract all 45 fields, enqueue event. | Must happen before standard_ExecutorEnd() because it nulls out estate, planstate, totaltime. |
| ProcessUtility | Snapshot buffer/WAL/CPU counters, execute, compute delta | DDL/COPY/VACUUM bypass the executor entirely — no QueryDesc, no instrumentation. We manually compute the delta. |
| emit_log_hook | Capture SQLSTATE, severity, message text for errors | Error tracking is impossible from executor hooks alone. Syntax errors, permission denials, constraint violations — none of them reach ExecutorEnd. |
All hooks chain to previous hook values, so pg_stat_ch coexists with pg_stat_statements, auto_explain, pg_tracing, and anything else. The chaining order follows shared_preload_libraries load order.
Overhead on PostgreSQL
We ran pgbench (TPC-B, scale factor 10, 32 clients, 8 threads, 30 seconds) on an AMD Ryzen AI MAX+ 395 (16c/32t, 64MB L3, 128GB RAM) against PostgreSQL 18 with and without pg_stat_ch. ClickHouse was running locally in Docker.
| TPS | latency avg | |
|---|---|---|
| without pg_stat_ch | 41,309 | 0.775 ms |
| with pg_stat_ch | 36,656 | 0.873 ms |
| overhead | ~11% | ~11% |
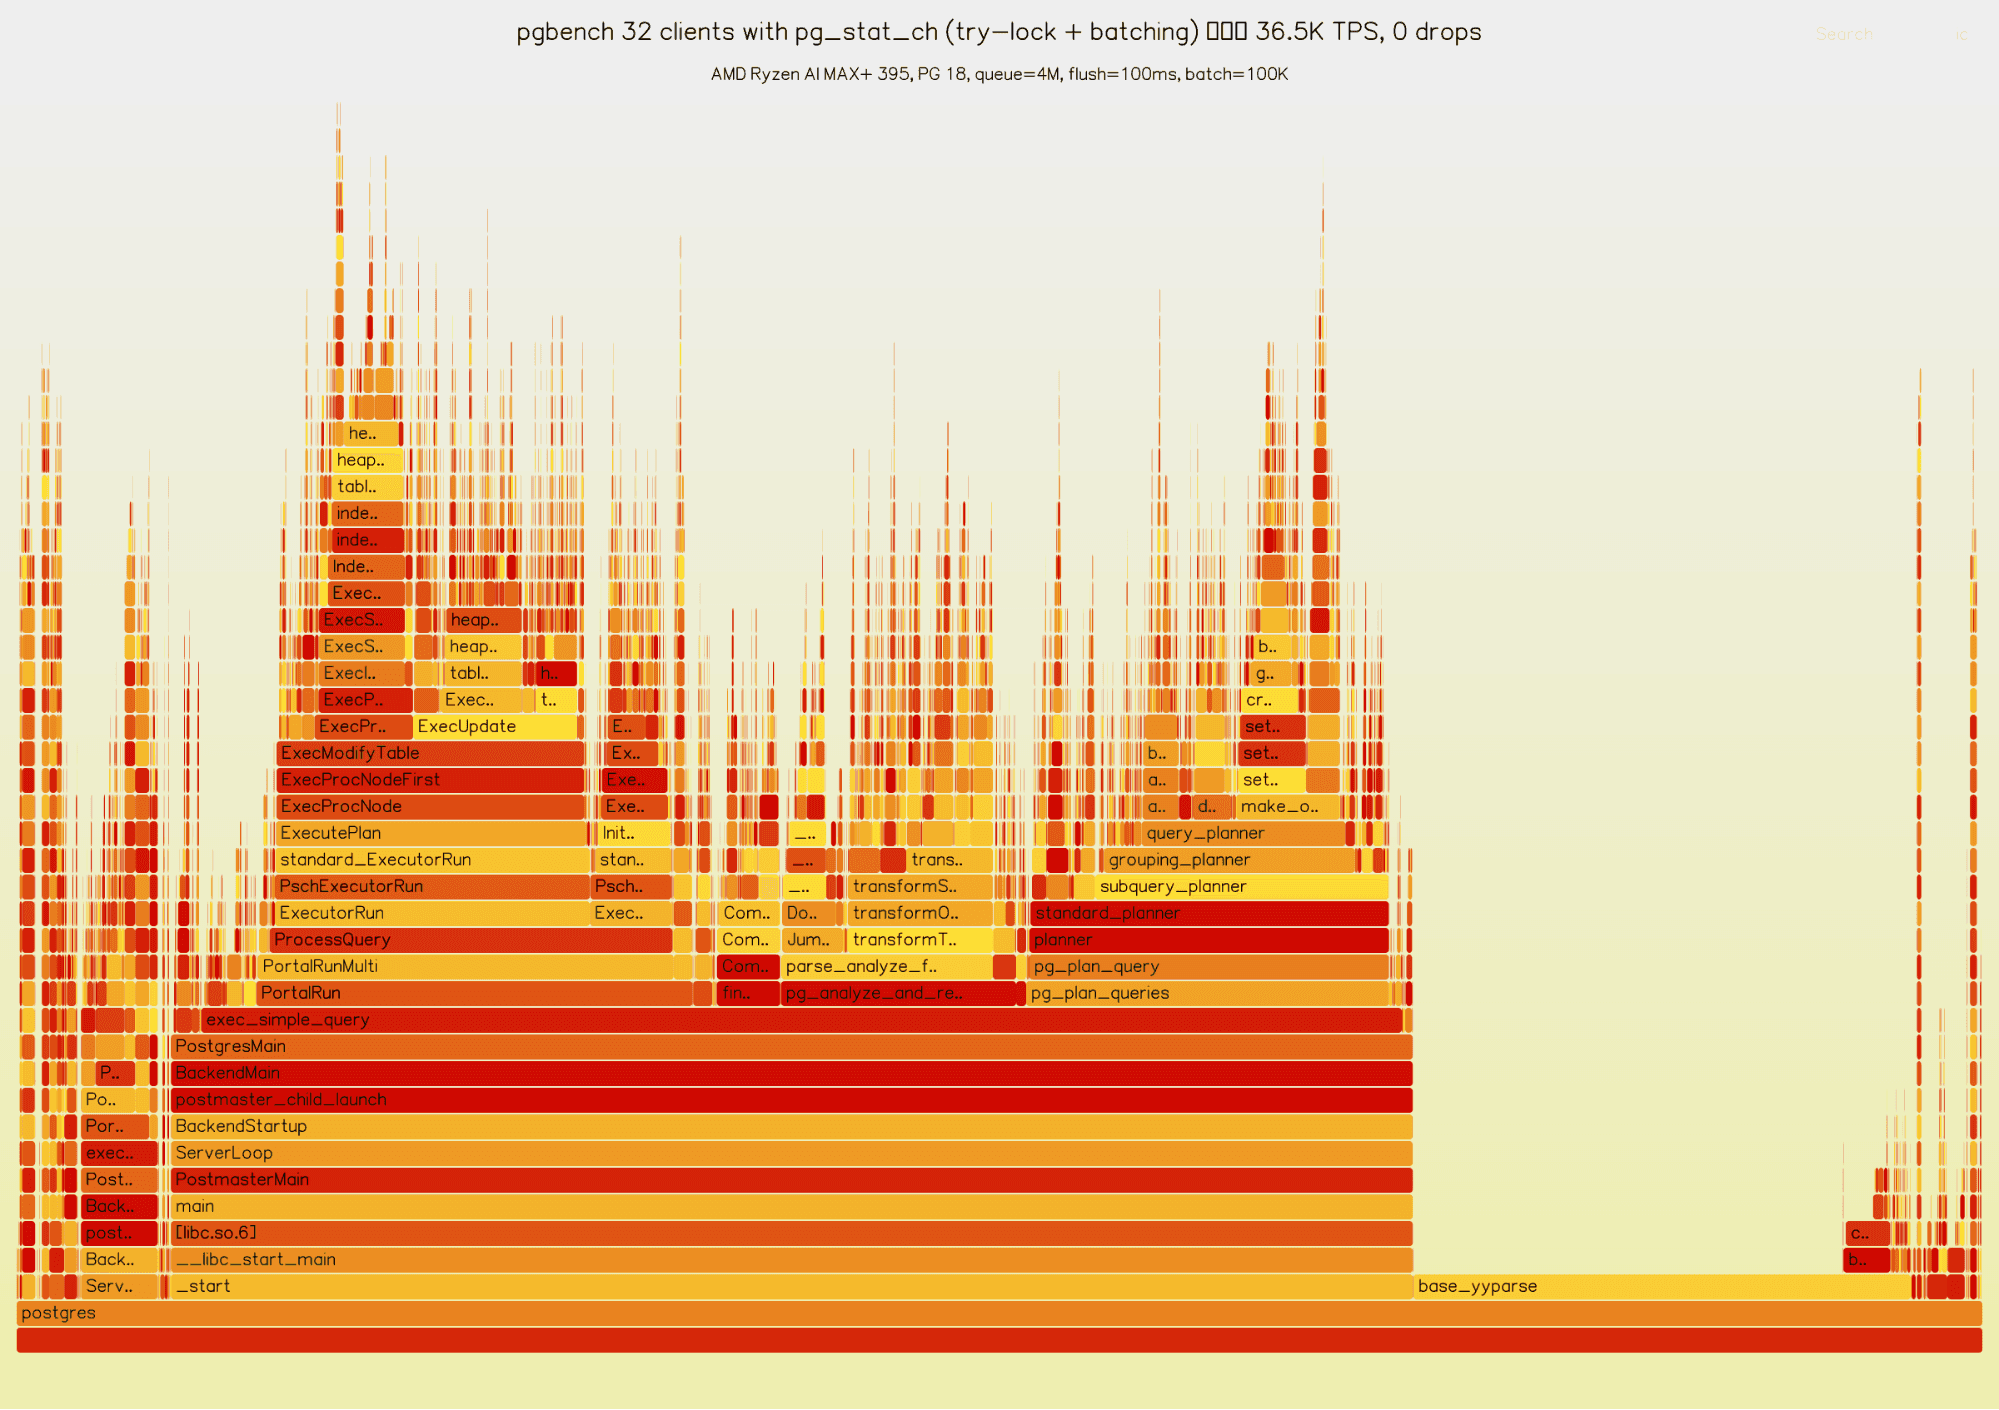
At 36.6K TPS, pg_stat_ch captured 7.7 million events over 30 seconds with zero drops (queue_capacity=4M, flush_interval=100ms, batch_max=100K). Each number is the average of two consecutive runs.
Here’s the flamegraph:
We also profiled 8 backends for 10 seconds using perf record with DWARF call graphs:
Overhead Component % of CPU
──────────────────────────────────────────────────
Enqueue (try-lock fast path) 0.94% ← was 2.32% before batching
Batch flush (XactCallback → batch) 0.54% ← new: amortized lock path
BuildEvent (QueryDesc → struct) 0.33%
ProcessUtility overhead 0.08%
InstrAlloc (enable instrumentation) 0.05%
Nesting tracking (Run + Finish) 0.05%
──────────────────────────────────────────────────
TOTAL pg_stat_ch CPU overhead ~2.0%So, the observed CPU overhead of pg_stat_ch is ~2%. The ~11% overhead to TPS/latency we see in the benchmark is due to contention amplification on the enqueue lock. This pgbench TPC-B setup has very short, sub-millisecond transactions at high concurrency, so even a small serialized section can translate to a noticeable TPS drop.
Before the try-lock + local batching change, pg_stat_ch acquired the enqueue LWLock on every query. Under this workload that lock became a hot spot and the TPS drop was about 24%. The try-lock + local batching optimization brought this down to about 11%: backends now attempt a non-blocking enqueue and, if the lock is contended, buffer events locally and flush them once per transaction. With roughly 5 queries per TPC-B transaction, this reduces lock acquisitions from ~150K/s to ~30K/s (a 5x reduction), which materially reduces contention.
This also explains the apparent mismatch between ~2% CPU overhead and ~11% TPS overhead. The ~2% figure is the time spent in pg_stat_ch code itself (building events, enqueue fast path, batched flush) and it excludes the knock-on effects of lock contention. The remaining gap is time lost to lock contention and scheduling effects around the shared enqueue path, which shows up as reduced throughput rather than CPU time spent in the extension.
TPC-B at 32 clients is probably close to the worst case for this effect, we expect that most real workloads will see less impact. We’ll publish additional numbers on more representative workloads shortly after launch to quantify overhead when lock pressure is lower.
Storage & compression in ClickHouse
Each PschEvent is fixed size in PostgreSQL shared memory. We shipped 7.7M pgbench events to ClickHouse and measured the actual on-disk size:
7.7M events × ~4.6KB ≈ 35 GB as raw structs
ClickHouse compressed: 426 MB
compression ratio: ~83:1 (from raw event size)
bytes per row: ~36 bytes compressedThe per-column breakdown shows where the compression wins:
| Column | Compressed | Ratio | Bytes/row |
|---|---|---|---|
| query (text) | 119 MB | 5.6:1 | 10.0 |
| ts_start | 44 MB | 2.2:1 | 3.7 |
| cpu_user_time_us | 33 MB | 2.9:1 | 2.8 |
| duration_us | 32 MB | 3.0:1 | 2.7 |
| query_id | 30 MB | 3.2:1 | 2.5 |
| db | 317 KB | 230:1 | ~0 |
| username | 440 KB | 221:1 | ~0 |
| app | 440 KB | 221:1 | ~0 |
Low-cardinality strings (db, username, app) compress to almost nothing — dictionary encoding reduces them to a few bits per row. The query column dominates at 119MB, but pgbench has only a handful of distinct query texts that repeat millions of times, so even that compresses 5.6:1.
A real workload with more diverse queries would compress differently — the query column would be larger, but the low-cardinality columns would still be near-zero. The point stands: months of query telemetry fits in surprisingly little space.
For a real workload at 10K QPS, we’d expect this to work out at under $100/month in storage costs:
events per day: 10,000 × 86,400 = 864M
raw event size: 864M × 4.6KB ≈ 4 TB/day
at 36 bytes/row: 864M × 36 = ~31 GB/day
monthly storage: 31 × 30 = ~930 GB/month
cloud block storage: ~$0.08/GB/month = ~$74/month
S3-backed cold tiers: ~$0.02/GB/month = ~$19/monthWe think that’s pretty reasonable for a 10K QPS workload, for the level of insight it allows over the events.
Try the unified data stack
ClickHouse + Postgres has become the unified data stack for applications that scale. With Managed Postgres now available in ClickHouse Cloud, this stack is a day-1 decision.
Get accessWhat you can actually do with raw events
With raw events per query in ClickHouse, you can ask questions that are impossible with aggregate-only systems. Here are some real queries:
Find the individual queries causing cache misses:
SELECT
query_id,
any(query) AS sample_query,
count() AS executions,
avg(shared_blks_read) AS avg_physical_reads,
sum(shared_blks_read) AS total_physical_reads
FROM events_raw
WHERE ts_start > now() - INTERVAL 24 HOUR
AND shared_blks_read > 1000
GROUP BY query_id
ORDER BY total_physical_reads DESC
LIMIT 20;Showing the most expensive queries with percentile distributions:
SELECT
query_id,
any(query) AS sample_query,
count() AS executions,
round(100 * sum(duration_us) / (
SELECT sum(duration_us)
FROM pg_stat_ch.events_raw
WHERE ts_start > now() - INTERVAL 24 HOUR
), 2) AS pct_runtime,
count() AS cnt,
round(sum(duration_us) / 1e6, 2) AS total_seconds,
round(quantile(0.50)(duration_us) / 1000, 0) AS p50_ms,
round(quantile(0.90)(duration_us) / 1000, 0) AS p90_ms,
round(quantile(0.99)(duration_us) / 1000, 0) AS p99_ms
FROM pg_stat_ch.events_raw
WHERE ts_start > now() - INTERVAL 24 HOUR
GROUP BY query_id
ORDER BY sum(duration_us) DESC
LIMIT 20;Important details about the health of your Postgres database with a large lookback window, queries over ALL your historical insights in seconds, thanks to ClickHouse.
In fact, ClickHouse enables some truly fascinating queries. We can now see which query ran the most during our pgbench benchmark. Not the type of the query, but the exact query:
SELECT
query,
cmd_type,
count(*) AS c
FROM events_raw
WHERE (query_id > 0) AND (cmd_type != 'UTILITY') AND (cmd_type != 'SELECT')
GROUP BY
query,
cmd_type
ORDER BY c DESC
LIMIT 5
Query id: abfc5785-48d8-4111-bfb9-2696a010a6d3
┌─query────────────────────────────────────┬─cmd_type─┬──c─┐
│ UPDATE pgbench_branches SET bbalance... │ UPDATE │ 26 │
│ UPDATE pgbench_branches SET bbalance... │ UPDATE │ 26 │
│ UPDATE pgbench_branches SET bbalance... │ UPDATE │ 26 │
│ UPDATE pgbench_branches SET bbalance... │ UPDATE │ 26 │
│ UPDATE pgbench_branches SET bbalance... │ UPDATE │ 25 │
└──────────────────────────────────────────┴──────────┴────┘
5 rows in set. Elapsed: 10.268 sec. Processed 63.33 million rows, 3.43 GB (6.17 million rows/s., 333.55 MB/s.)The materialized views handle this too. The *State() / *Merge() pattern means aggregates are incrementally maintained — no re-scanning raw data for dashboards:
CREATE MATERIALIZED VIEW query_stats_5m TO query_stats_5m_target AS
SELECT
toStartOfFiveMinutes(ts_start) AS bucket,
db, query_id, cmd_type,
countState() AS calls,
quantilesTDigestState(0.95, 0.99)(duration_us) AS duration_quantiles,
sumState(shared_blks_hit) AS total_shared_blks_hit,
sumState(shared_blks_read) AS total_shared_blks_read
FROM events_raw
GROUP BY bucket, db, query_id, cmd_type;Query query_stats_5m for dashboards, events_raw for drill-down. Both are always up to date.
Using these, we can build monitoring dashboards to track the things we need to know:
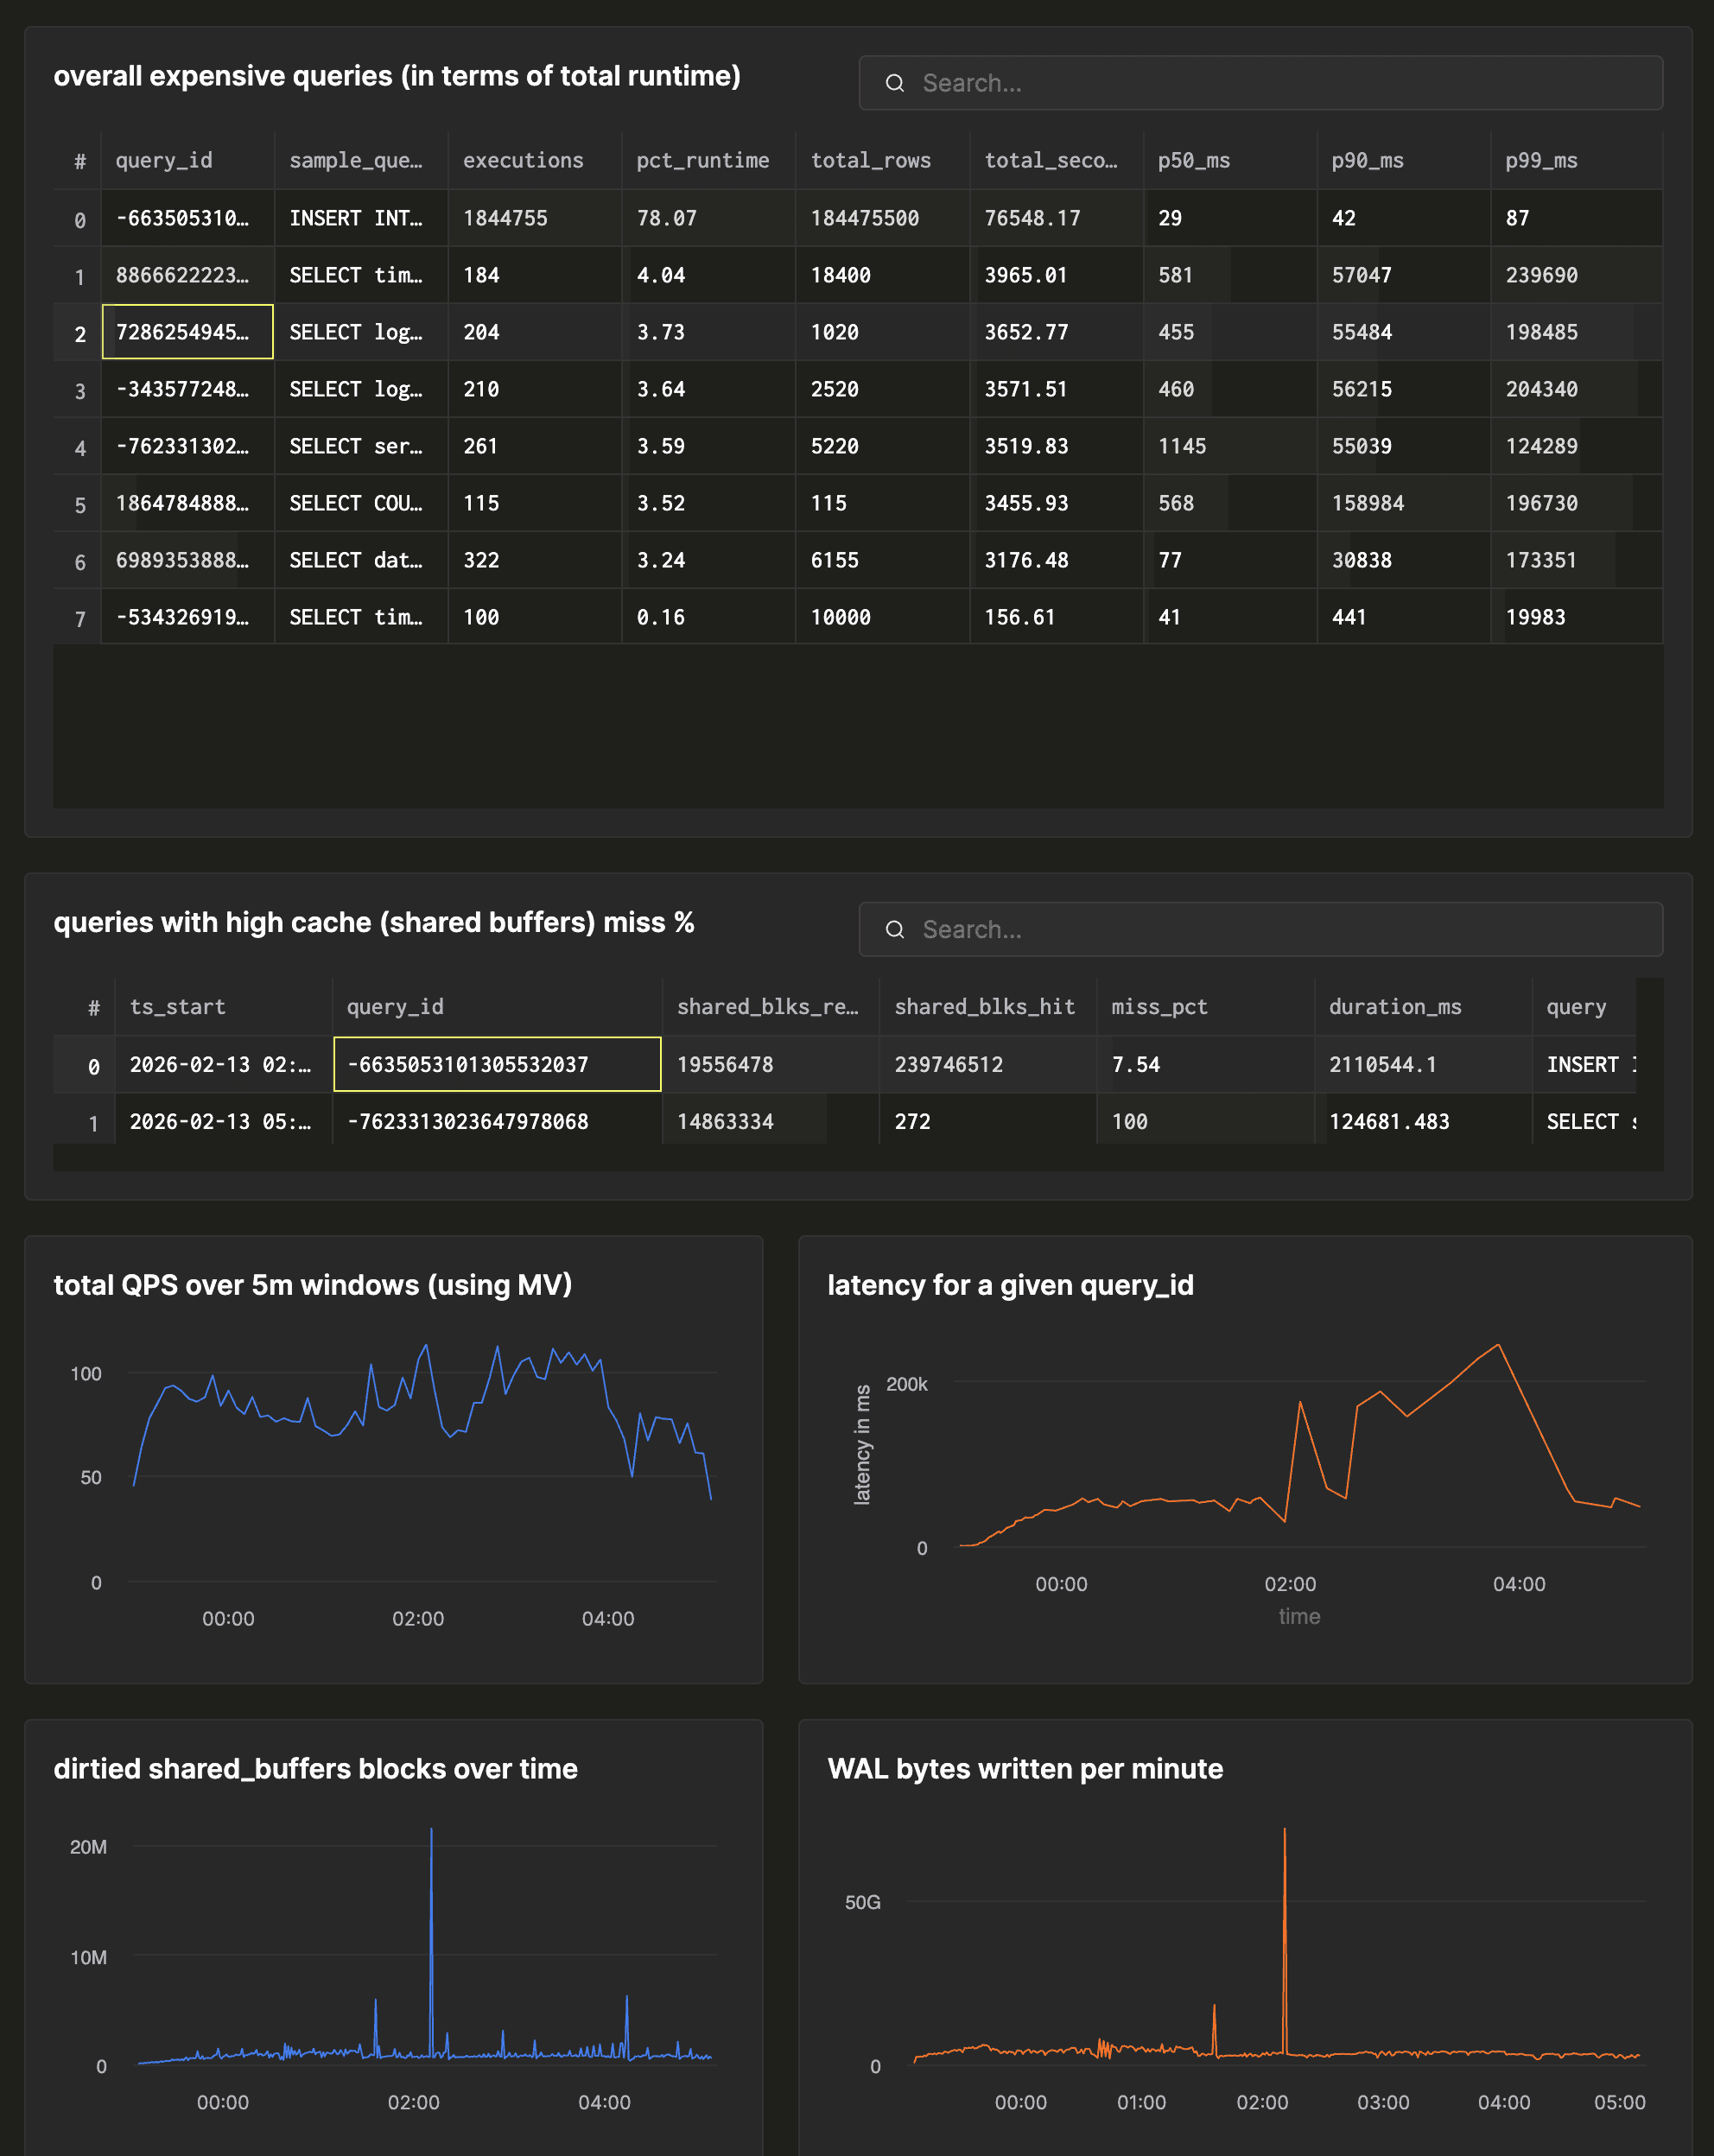
Comparison with other extensions
There are several good tools in the Postgres metrics-collection space already; they solve overlapping but different problems.
pg_stat_statements
pg_stat_statements is the baseline every DBA is familiar with.
It has zero additional infrastructure, stores full query text and is battle-tested over a decade. If you need basic “top queries by total time” and nothing else, it’s perfect.
What it didn’t solve for us is time-series analysis (events have timestamps), percentiles (not just mean/min/max), error tracking (SQLSTATE + message + severity), and indefinite retention. If you need to answer “what changed between 2pm and 3pm yesterday?”, pg_stat_statements isn’t the answer.
Both use the same query_id fingerprint, so they correlate naturally and you can run both.
pg_stat_monitor
Percona’s pg_stat_monitor is the most ambitious extension in this space. It adds time-bucketed histograms, query plan capture, error tracking, and client IP tracking on top of pg_stat_statements.
pg_stat_monitor includes query plan capture, which pg_stat_ch does not have yet, and it’s the single biggest feature gap. Also: no external dependencies. You CREATE EXTENSION and you’re done.
However, pg_stat_ch has unlimited retention (pg_stat_monitor rotates through N shared-memory buckets — hours at most), raw event granularity instead of pre-aggregated buckets, lower hot-path overhead (memcpy vs. hash-table lookup + update per query), and the full power of ClickHouse SQL for ad-hoc analysis. Also, ClickHouse compression: a typical event compresses to ~100–200 bytes on disk, vs. the ~4.6KB in Postgres shared memory.
pg_tracing
pg_tracing generates OpenTelemetry spans for each query, including sub-spans for individual plan nodes (SeqScan, HashJoin, etc.), triggers, and parallel workers. It adds distributed tracing for PostgreSQL.
These extensions solve different problems: pg_tracing answers “why was this specific query slow?” (was it the HashJoin? the IndexScan? a trigger?), while pg_stat_ch answers “which queries are slow and do they trend over time?”
Again, you could run both: pg_stat_ch for fleet-wide observability and alerting, pg_tracing for individual slow queries analysis when pg_stat_ch tells you something is off.
OpenTelemetry Collector
The OTel Collector PostgreSQL Receiver is an external scraper that polls pg_stat_* views at configurable intervals.
If you already have an OTel pipeline, it slots in easily without needing to reconfigure much. It also collects system-level metrics (connections, locks, replication lag) that pg_stat_ch doesn’t.
However, an external scraper with a 10-second interval can never capture individual query executions. It only sees pre-aggregated counter deltas. If you need to know “what queries executed between 3:00:00 and 3:00:05”, only an in-process extension can tell you.
Try the unified data stack
ClickHouse + Postgres has become the unified data stack for applications that scale. With Managed Postgres now available in ClickHouse Cloud, this stack is a day-1 decision.
Get accessWhat’s next
We’re actively working on:
-
Query plan capture: storing execution plans as separate events
-
Sampling support: for extremely high-throughput systems that can’t afford to capture every query
-
ClickStack & Grafana dashboard templates: pre-built dashboards for common patterns
-
Production hardening: stress testing, edge cases, more version coverage
pg_stat_ch also pairs naturally with pg_clickhouse, our extension for querying ClickHouse from PostgreSQL. Push telemetry with pg_stat_ch & query it back via foreign tables without leaving psql.
We’d love your feedback. If you run PostgreSQL in production and care about observability, try pg_stat_ch and tell us what works and what’s broken. Join us in our community Slack!


