Outages rarely start where you expect them to. They begin in the observability gaps like missing spans, broken traces across async systems, and telemetry that lacks the context needed to explain what happened. Even in systems that appear fully instrumented, the most critical paths are often the least visible.
Modern observability stacks generate more data than ever before, but more data does not necessarily mean better answers. Without complete coverage and meaningful context, engineers are still left guessing when something breaks.
You can eliminate those gaps by combining ClickStack, a ClickHouse-native observability backend, with Odigos, a zero-code OpenTelemetry instrumentation platform. Together, they make it possible to capture high-quality telemetry across a distributed system quickly, consistently, and at scale.
The real problem: observability gaps
Some teams do struggle to adopt OpenTelemetry, but even after clearing this hurdle, a second challenge emerges: collecting the right telemetry. Generating data is rarely the issue. The difficulty lies in ensuring that the telemetry accurately reflects what is happening inside the system.
In practice, instrumentation is often incomplete. Some services are well covered, while others are missing entirely due to the effort required to import OTel SDKs and maintain instrumentation over time. As systems evolve, these gaps widen rather than shrink.
The problem becomes more pronounced in asynchronous architectures. Messaging systems such as Kafka and background processing pipelines introduce boundaries where trace context is frequently lost. Requests that begin as a single user action fragment into disconnected spans, making it difficult to reconstruct what occurred.
Even when traces are present, they often lack the fidelity required to debug effectively. Without access to request-level attributes, application-specific metadata, or database-level visibility, engineers are left interpreting incomplete signals. At the same time, operating OpenTelemetry pipelines introduces its own overhead, with collector configurations, resource allocations, and scalability risks.
The result is a familiar experience: telemetry exists, dashboards look healthy, but when something fails, the system still requires guesswork to understand why.
Capturing the right data
Solving this problem requires more than increasing telemetry volume. It requires capturing the right data at the right time, especially across the parts of the system where failures are hardest to observe.
Odigos and ClickStack address this from two complementary directions.
Odigos focuses on zero-code instrumentation using eBPF (extended Berkeley Packet Filter), allowing it to dynamically attach to user-space applications and kernel-level events without modifying application binaries or injecting language-specific agents. By leveraging eBPF probes, Odigos can intercept network calls, system calls, and runtime library interactions (like Kafka, HTTP, gRPC, database clients, etc.) directly in the execution path, constructing distributed traces with minimal overhead and without requiring prior knowledge of the application's codebase.
On top of this instrumentation layer, Odigos introduces an intelligent telemetry control plane that continuously changes what data is collected. Rather than relying on static sampling or fixed attribute sets, it uses real-time signals, such as latency distributions, and error rates, to dynamically adjust trace payloads. For example, it can increase span detail, enrich traces with additional protocol-level metadata, or shift sampling strategies under degradation conditions, ensuring that high-value signals are preserved while avoiding unnecessary costs during healthy operation.
ClickStack complements this by providing a scalable backend built on ClickHouse that can ingest this high-fidelity, adaptive telemetry and make it immediately available for fast, flexible querying.
By separating the instrumentation from storage and query operations, the system becomes both easier to operate and more effective at producing meaningful insights, ensuring that the data captured is not only comprehensive, but also relevant when it matters most.
Deploying ClickStack on a VM
ClickStack provides a straightforward path to running a full observability backend powered by ClickHouse. For this walkthrough, the all-in-one distribution is used to simplify deployment on an AWS VM.
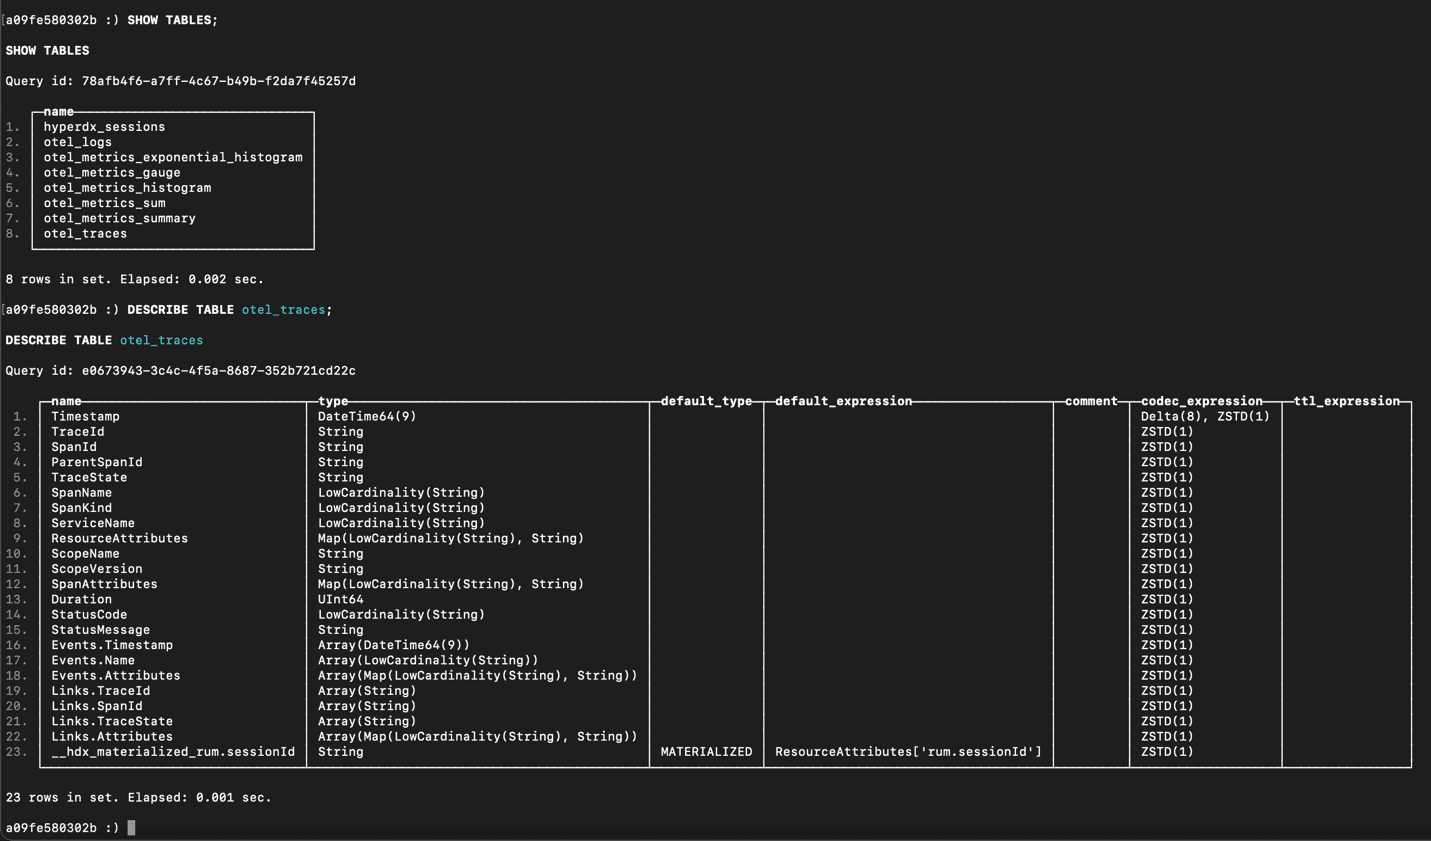
After launching an EC2 instance with the necessary ports open for ClickHouse and OTLP ingestion, ClickStack can be installed and started with a single command. Within a few moments, ClickHouse is running, ingestion endpoints are available, and the required observability schema is already in place. There is no need to manually configure storage, pipelines, or schemas before sending data.
Once the service is up, OTLP endpoints are exposed for both gRPC and HTTP, making it easy to connect external telemetry sources such as Odigos.
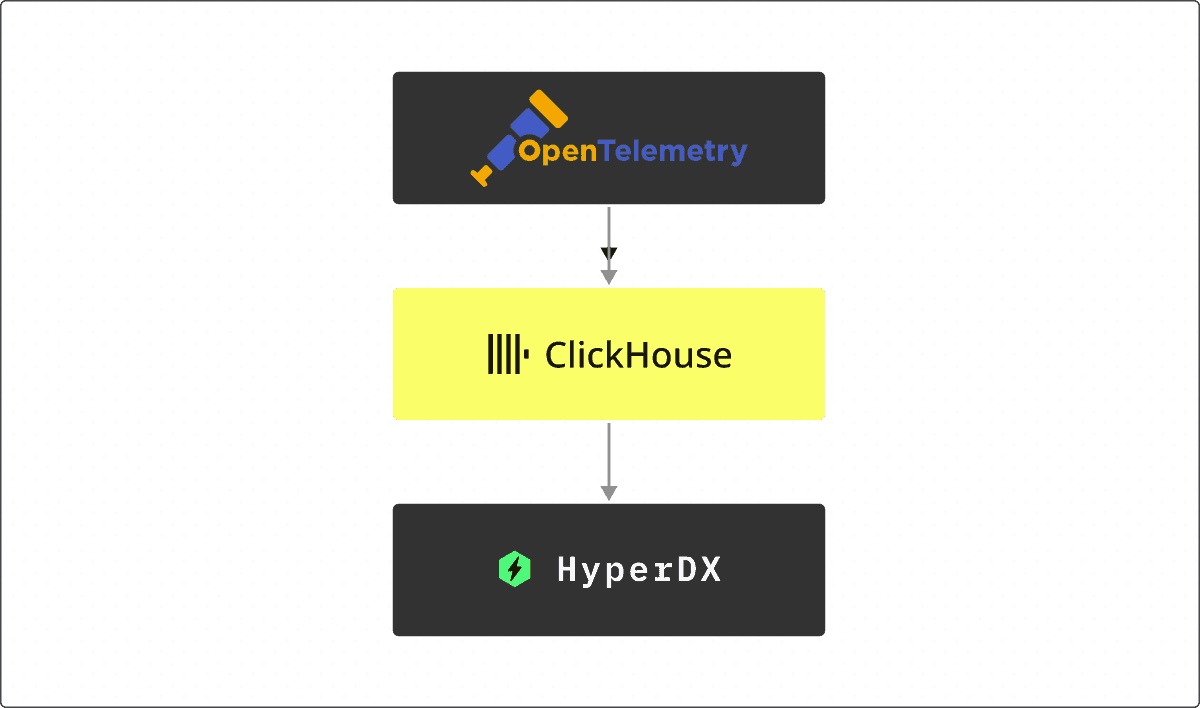
The all-in-one distribution deploys an OpenTelemetry Collector for OTLP ingestion, a ClickHouse instance for storage, and the HyperDX UI for querying and visualization.
Deep instrumentation without code changes
For a simple example, we'll assume the services we want to monitor are deployed in Kubernetes.
Installing Odigos into a Kubernetes cluster is a simple helm install. Once deployed, Odigos loads eBPF programs that attach to running workloads and begin instrumenting them at the library level. This includes HTTP and gRPC frameworks, database clients, and messaging libraries, allowing it to generate comprehensive traces without requiring developers to modify their applications.
After configuring ClickStack as the destination for telemetry, Odigos begins exporting data over OTLP. Within seconds, traces, metrics and logs start flowing into ClickHouse and are visible within the ClickStack UI.
What makes this approach highly valuable is the depth of the telemetry that is captured. Instead of only producing basic spans, Odigos captures context across the parts of the system where visibility is typically lost. Spans are generated for every library-level request, every middleware request, and across encrypted traffic. Where traditional eBPF instrumentation only captures HTTP in / HTTP out, Odigos goes much deeper.
This includes asynchronous messaging flows, where it preserves trace continuity across producers and consumers, allowing end-to-end request paths to remain intact even in fan-out scenarios. It can even capture messages sent by the producers and received by the consumers!
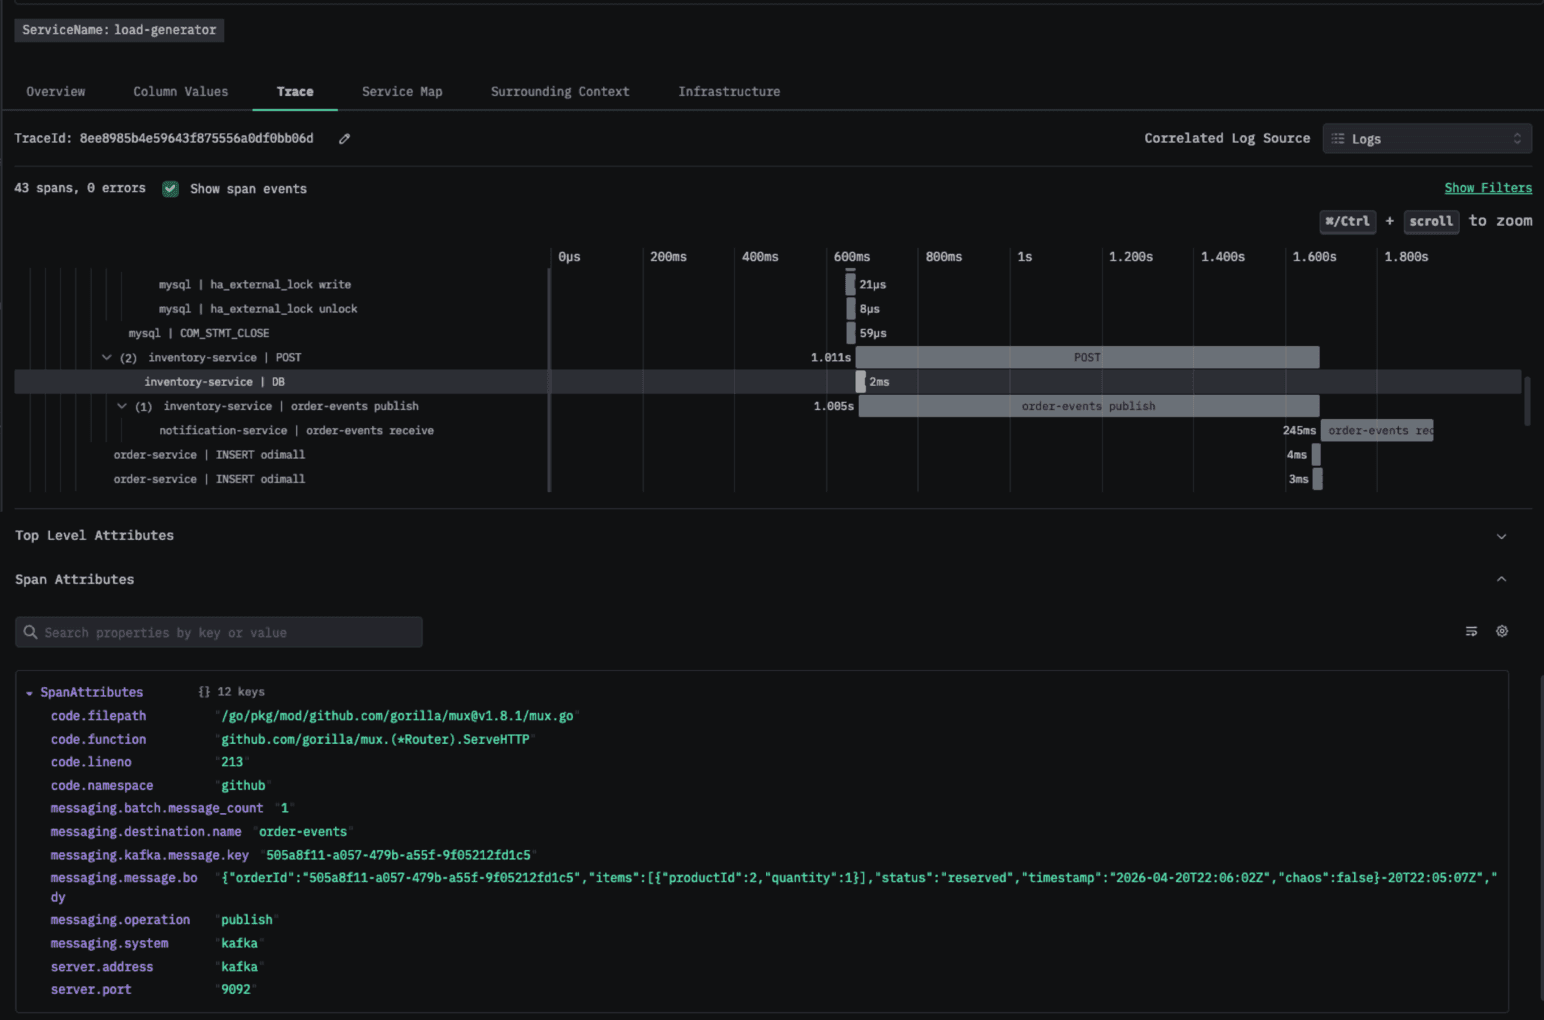
A trace showing the messages a Kafka producer publishes to the broker in the span attributes
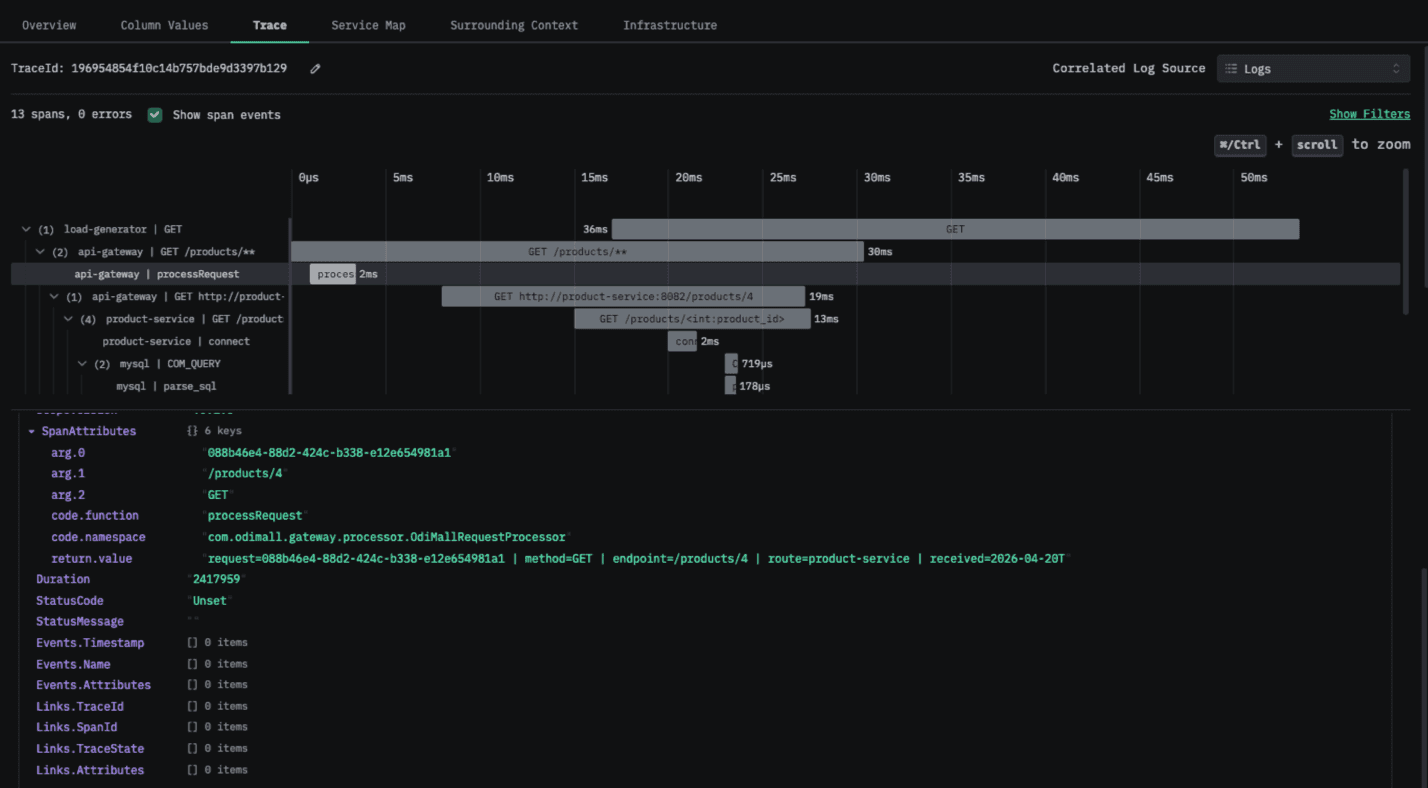
It also captures application-level context, including stacktraces, code attributes, and request headers, which makes it possible to correlate technical events with business-level data. Database interactions are instrumented automatically, providing visibility into query execution and latency without additional configuration.
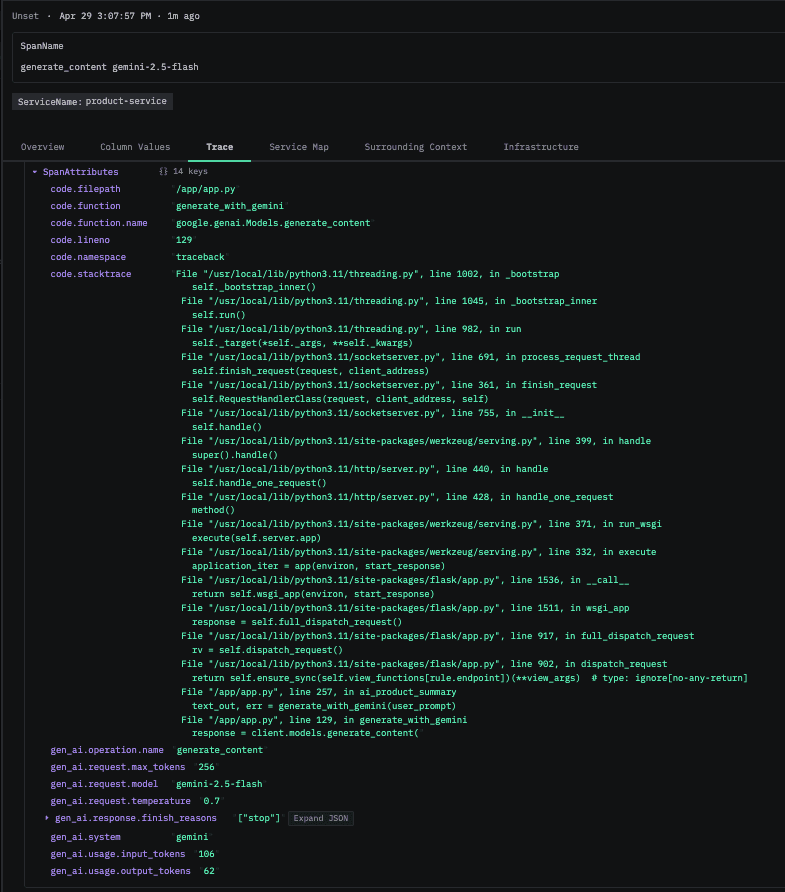
Stacktrace in the span attributes for a request made to gemini, includes token usage, AI Model, and operation name
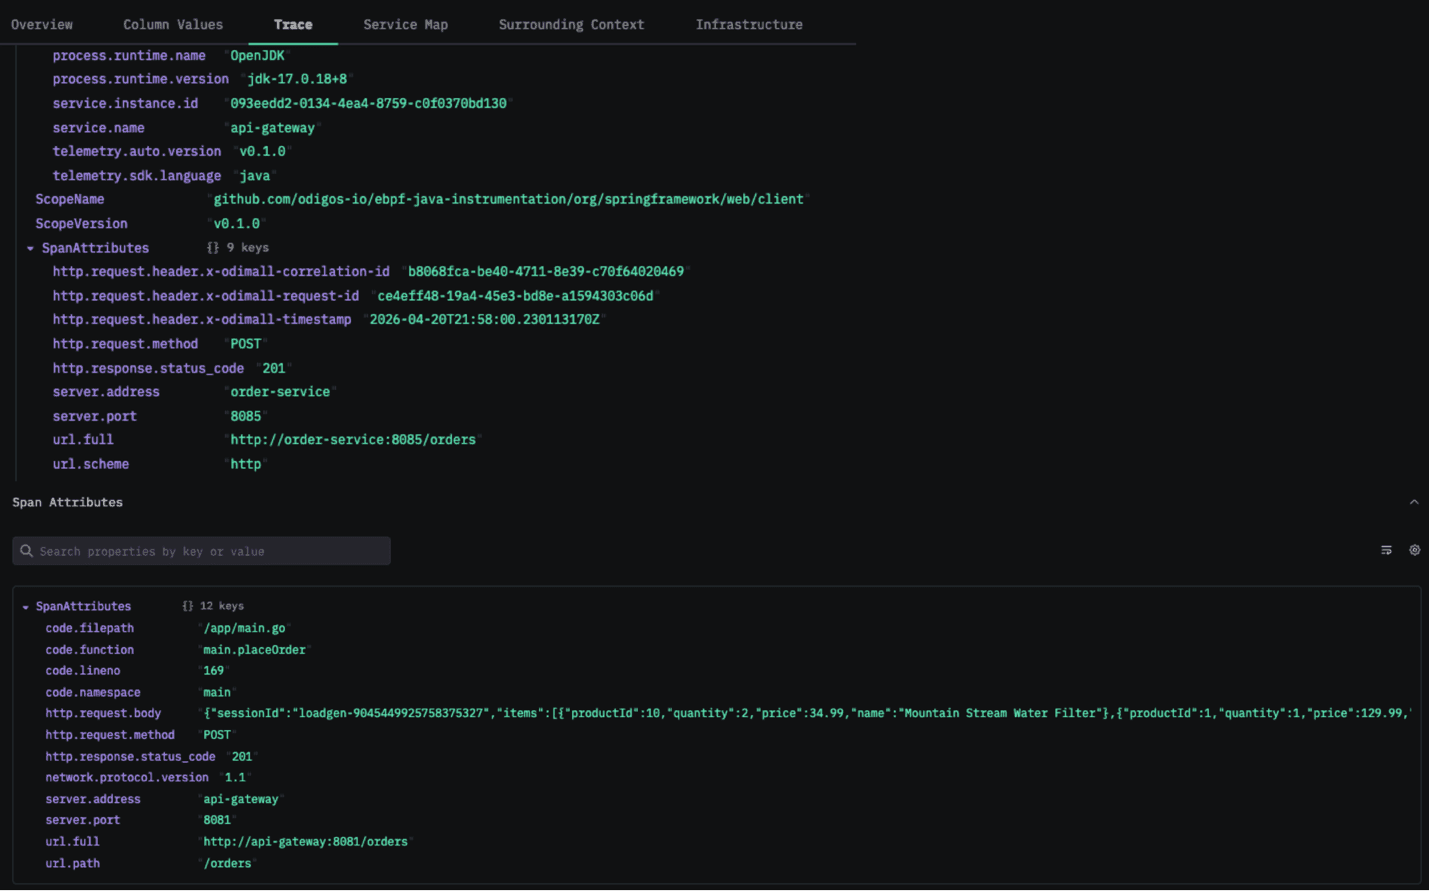
Code Attributes, HTTP Responses, HTTP Requests, and Custom HTTP Headers are collected by Odigos and can be seen in the span attributes above
For teams that need deeper control, Odigos also supports custom instrumentation for code paths not covered by standard OpenTelemetry libraries. While open-source auto-instrumentation targets well-known frameworks, it does not capture custom business logic, internal helper classes, or proprietary workflows.
Odigos bridges this gap by allowing users to define specific classes and methods to instrument directly from the UI. Instead of modifying source code, developers can select target methods and configure Odigos to automatically generate spans around those executions.
At runtime, Odigos attaches this instrumentation without requiring code changes or redeployments, emitting spans whenever those methods are invoked. It can also capture method arguments and return values, exposing rich, domain-specific context directly within traces. These spans are seamlessly merged with the auto-generated traces, providing end-to-end visibility embedded with application-specific logic.
Without Odigos, achieving this level of visibility would require manual instrumentation using OpenTelemetry APIs, embedding span logic in code and redeploying services to apply changes.
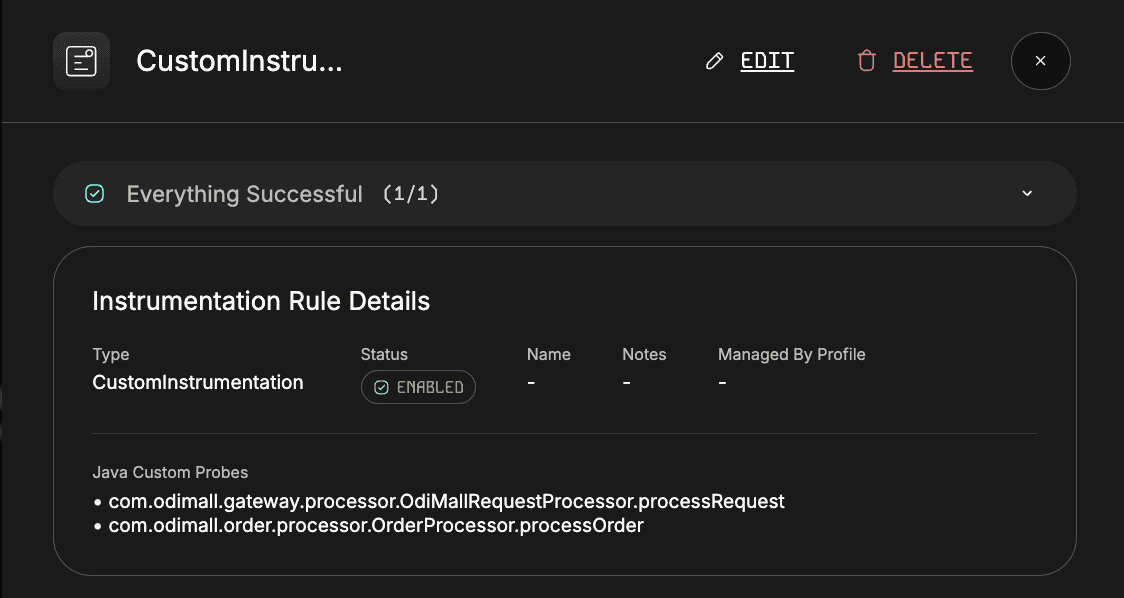
Instrumentation rules allow specific classes and methods to be instrumented without users needing to modify the code
Traces show arguments and return values for autoinstrumented methods and functions
At the same time, Odigos manages the OpenTelemetry pipeline itself, eliminating the need to manually configure and maintain collectors. This ensures that telemetry is routed consistently and reduces the operational overhead typically associated with OpenTelemetry deployments.
From traffic to insight in minutes
Once the system is running, interacting with the application immediately generates telemetry that flows into ClickStack. User actions propagate through multiple services, databases, and messaging systems, all of which are captured as part of a single, connected trace.
Because ClickStack is built on ClickHouse, it can ingest this data at high throughput while making it available for real-time analysis. Engineers can query traces using SQL, explore service relationships, and identify performance bottlenecks without needing to move data into a separate analytics system.
Eliminating the guesswork
The difference becomes most apparent when something goes wrong. In traditional setups, missing spans, broken traces, and lack of context force engineers to piece together partial information and rely on intuition. Even with telemetry in place, identifying the root cause often involves making assumptions and manual correlation.
With Odigos and ClickStack, those gaps are removed end-to-end. Odigos ensures that traces remain complete, even across asynchronous boundaries, while enriching them with the context needed to understand what happened. ClickStack ingests that high-fidelity data at scale and makes it immediately queryable, allowing engineers to explore traces, correlate signals, and pinpoint issues in seconds.
Instead of stitching together fragments from multiple tools, you get a single, consistent view of your system. One where every request, dependency, and database interaction is captured and available for analysis. The combination of rich, automatically captured telemetry and fast analytical querying turns observability from a reactive process into a precise, data-driven workflow.
Get started today
Interested in seeing how ClickHouse works on your data? Get started with ClickHouse Cloud in minutes and receive $300 in free credits.
Sign up