@clickhouse/client- Node.js only@clickhouse/client-web- browsers (Chrome/Firefox), Cloudflare workers
AI agent skillsThe JS client ships with AI agent skills that can help coding agents work with the client. Install them with:
Environment requirements (node.js)
Node.js must be available in the environment to run the client. The client is compatible with all the maintained Node.js releases. As soon as a Node.js version approaches End-Of-Life, the client drops support for it as it is considered outdated and insecure. Current Node.js versions support:Environment requirements (web)
The web version of the client is officially tested with the latest Chrome/Firefox browsers and can be used as a dependency in, for example, React/Vue/Angular applications, or Cloudflare workers.Installation
To install the latest stable Node.js client version, run:Compatibility with ClickHouse
Likely, the client will work with the older versions, too; however, this is best-effort support and isn’t guaranteed. If you have a ClickHouse version older than 23.3, please refer to ClickHouse security policy and consider upgrading.
Examples
We aim to cover various scenarios of client usage with the examples in the client repository. The overview is available in the examples README. If something is unclear or missing from the examples or from the following documentation, feel free to contact us.Client API
Most of the examples should be compatible with both Node.js and web versions of the client, unless explicitly stated otherwise.Creating a client instance
You can create as many client instances as necessary with thecreateClient factory:
Configuration
When creating a client instance, the following connection settings can be adjusted:Node.js-specific configuration parameters
URL configuration
It is possible to configure most of the client instance parameters with a URL. The URL format ishttp[s]://[username:password@]hostname:port[/database][?param1=value1¶m2=value2]. In almost every case, the name of a particular parameter reflects its path in the config options interface, with a few exceptions. The following parameters are supported:
- (1) For booleans, valid values will be
true/1andfalse/0. - (2) Any parameter prefixed with
clickhouse_setting_orch_will have this prefix removed and the rest added to client’sclickhouse_settings. For example,?ch_async_insert=1&ch_wait_for_async_insert=1will be the same as:
clickhouse_settings should be passed as 1/0 in the URL.
- (3) Similar to (2), but for
http_headerconfiguration. For example,?http_header_x-clickhouse-auth=foobarwill be an equivalent of:
Connecting
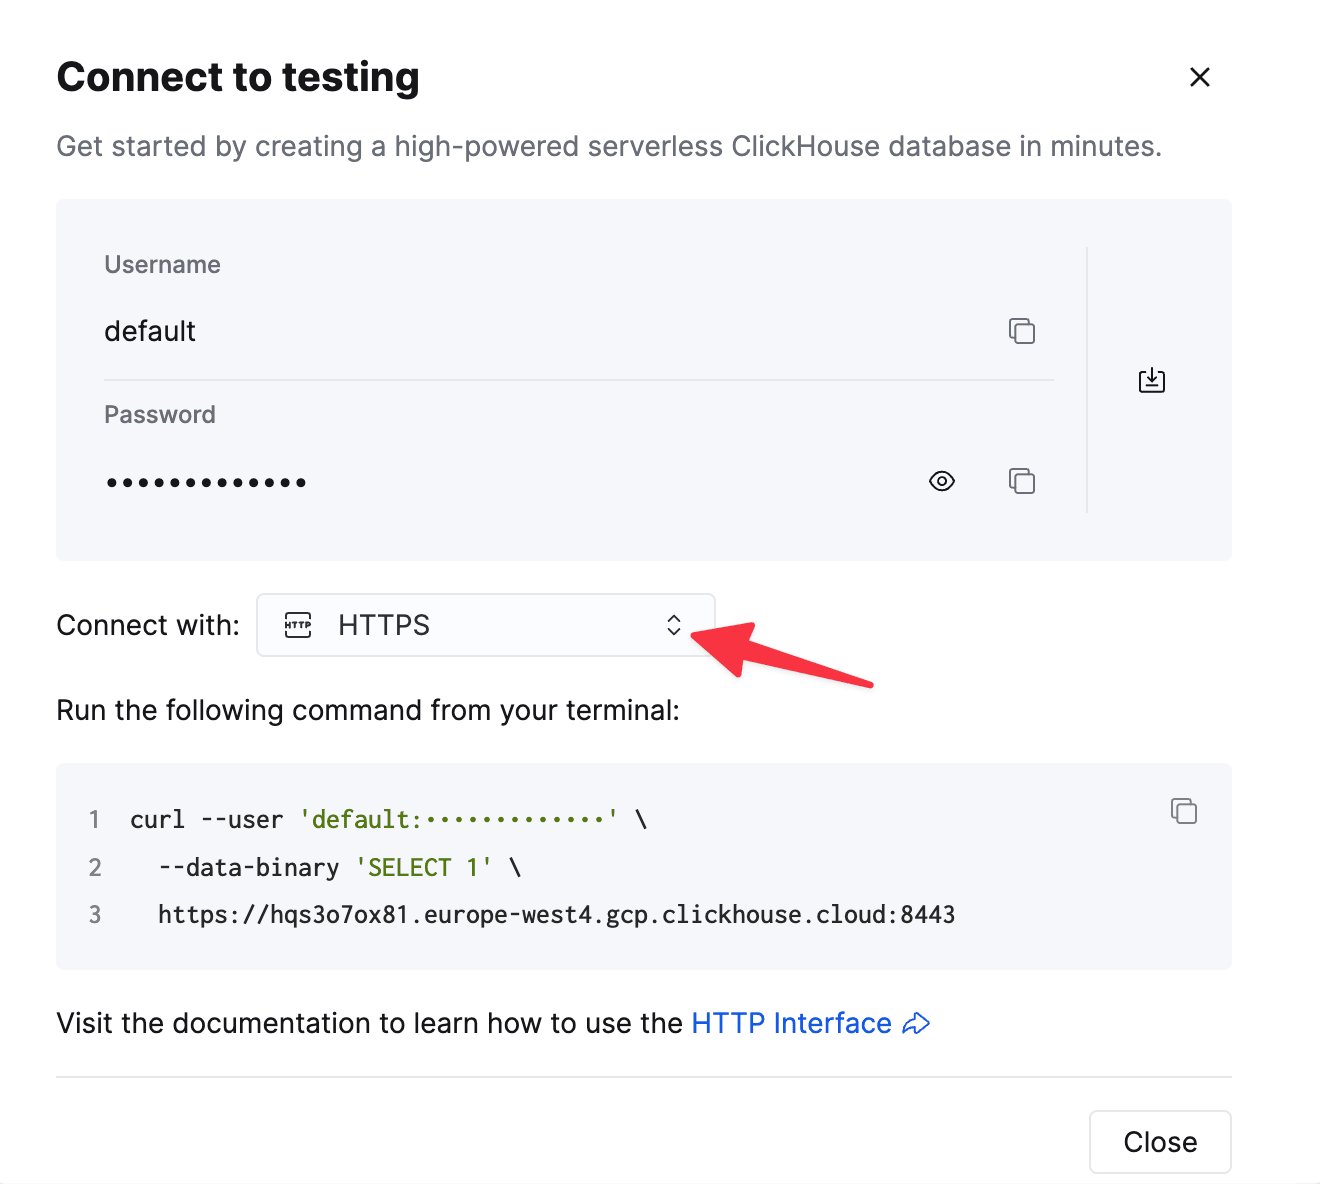
Gather your connection details
To connect to ClickHouse with HTTP(S) you need this information:
The details for your ClickHouse Cloud service are available in the ClickHouse Cloud console.
Select a service and click Connect:
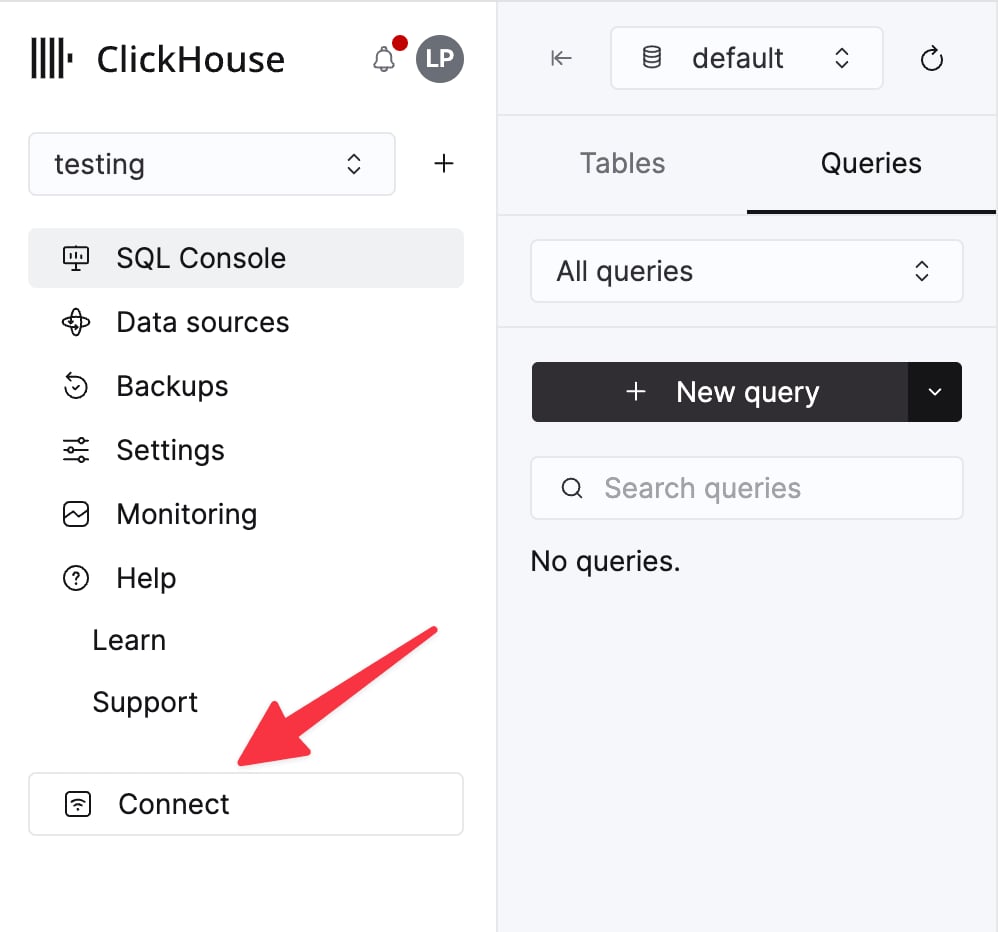
curl command.
Connection overview
The client implements a connection via HTTP or HTTPS protocol. RowBinary support is on track, see the related issue. The following example demonstrates how to set up a connection against ClickHouse Cloud. It assumesurl (including
protocol and port) and password values are specified via environment variables, and default user is used.
Example: Creating a Node.js Client instance using environment variables for configuration.
Connection pool (Node.js only)
To avoid the overhead of establishing a connection on every request, the client creates a pool of connections to ClickHouse to reuse, utilizing a Keep-Alive mechanism. By default, Keep-Alive is enabled, and the size of connection pool is set to10, but you can change it with max_open_connections configuration option.
There is no guarantee the same connection in a pool will be used for subsequent queries unless the user sets max_open_connections: 1. This is rarely needed but may be required for cases where users are using temporary tables.
See also: Keep-Alive configuration.
Query ID
Every method that sends a query or a statement (command, exec, insert, select) will provide query_id in the result. This unique identifier is assigned by the client per query, and might be useful to fetch the data from system.query_log,
if it is enabled in the server configuration, or cancel long-running queries (see the example). If necessary, query_id can be overridden by the user in command/query/exec/insert methods params.
Base parameters for all client methods
There are several parameters that can be applied to all client methods (query/command/insert/exec).Query method
This is used for most statements that can have a response, such asSELECT, or for sending DDLs such as CREATE TABLE and should be awaited. The returned result set is expected to be consumed in the application.
Result set and row abstractions
ResultSet provides several convenience methods for data processing in your application.
Node.js ResultSet implementation uses Stream.Readable under the hood, while the web version uses Web API ReadableStream.
You can consume the ResultSet by calling either text or json methods on ResultSet and load the entire set of rows returned by the query into memory.
You should start consuming the ResultSet as soon as possible, as it holds the response stream open and consequently keeps the underlying connection busy. The client doesn’t buffer the incoming data to avoid potential excessive memory usage by the application.
Alternatively, if it’s too large to fit into memory at once, you can call the stream method, and process the data in the streaming mode. Each of the response chunks will be transformed into a relatively small arrays of rows instead (the size of this array depends on the size of a particular chunk the client receives from the server, as it may vary, and the size of an individual row), one chunk at a time.
Please refer to the list of the supported data formats to determine what the best format is for streaming in your case. For example, if you want to stream JSON objects, you could choose JSONEachRow, and each row will be parsed as a JS object, or, perhaps, a more compact JSONCompactColumns format that will result in each row being a compact array of values. See also: streaming files.
JSONEachRow format, consuming the entire stream and parsing the contents as JS objects.
Source code.
JSONEachRow format using the classic on('data') approach. This is interchangeable with the for await const syntax. Source code.
CSV format using the classic on('data') approach. This is interchangeable with the for await const syntax.
Source code
JSONEachRow format consumed using for await const syntax. This is interchangeable with the classic on('data') approach.
Source code.
for await const syntax has a bit less code than the on('data') approach, but it may have negative performance impact.
See this issue in the Node.js repository for more details.ReadableStream of objects.
Insert method
This is the primary method for data insertion.{ query_id: '...', executed: false }. If the query_id wasn’t provided in the method params in this case, it will be an empty string in the result, as returning a random UUID generated by the client could be confusing, as the query with such query_id won’t exist in the system.query_log table.
If the insert statement was sent to the server, the executed flag will be true.
Insert method and streaming in Node.js
It can work with either aStream.Readable or a plain Array<T>, depending on the data format specified to the insert method. See also this section about the file streaming.
Insert method is supposed to be awaited; however, it is possible to specify an input stream and await the insert operation later, only when the stream is completed (which will also resolve the insert promise). This could potentially be useful for event listeners and similar scenarios, but the error handling might be non-trivial with a lot of edge cases on the client side. Instead, consider using async inserts as illustrated in this example.
Web version limitations
Currently, inserts in@clickhouse/client-web only work with Array<T> and JSON* formats.
Inserting streams isn’t supported in the web version yet due to poor browser compatibility.
Consequently, the InsertParams interface for the web version looks slightly different from the Node.js version,
as values are limited to the ReadonlyArray<T> type only:
Command method
It can be used for statements that don’t have any output, when the format clause isn’t applicable, or when you’re not interested in the response at all. An example of such a statement can beCREATE TABLE or ALTER TABLE.
Should be awaited.
The response stream is destroyed immediately, which means that the underlying socket is released.
Exec method
If you have a custom query that doesn’t fit intoquery/insert,
and you’re interested in the result, you can use exec as an alternative to command.
exec returns a readable stream that MUST be consumed or destroyed on the application side.
Ping
Theping method provided to check the connectivity status returns true if the server can be reached.
If the server is unreachable, the underlying error is included in the result as well.
/ping endpoint, while the Web version uses a simple SELECT 1 query to achieve a similar result, as the /ping endpoint doesn’t support CORS.
Example: (Node.js/Web) A simple ping to the ClickHouse server instance. NB: for the Web version, captured errors will be different.
Source code.
ping method, or specify additional params such as query_id, you could use it as follows:
query method parameters - see the PingParamsWithSelectQuery typing definition.
Close (Node.js only)
Closes all the open connections and releases resources. No-op in the web version.Streaming files (Node.js only)
There are several file streaming examples with popular data formats (NDJSON, CSV, Parquet) in the client repository.- Streaming from an NDJSON file
- Streaming from a CSV file
- Streaming from a Parquet file
- Streaming into a Parquet file
query call (JSONEachRow, CSV, etc.) and the output file name.
Supported data formats
The client handles data formats as JSON or text. If you specifyformat as one from the JSON family of formats (JSONEachRow, JSONCompactEachRow, etc.), the client will serialize and deserialize data during the communication over the wire.
Data provided in the “raw” text formats (CSV, TabSeparated and CustomSeparated families) are sent over the wire without additional transformations.
For Parquet, the main use case for selects likely will be writing the resulting stream into a file. See the example in the client repository.
JSONEachRowWithProgress is an output-only format that supports progress reporting in the stream. See this example for more details.
The entire list of ClickHouse input and output formats is available
here.
Supported ClickHouse data types
The related JS type is relevant for any
JSON* formats except the ones that represent everything as a string (e.g. JSONStringEachRow)
The entire list of supported ClickHouse formats is available
here.
See also:
Date/Date32 types caveats
Since the client inserts values without additional type conversion,Date/Date32 type columns can only be inserted as
strings.
Example: Insert a Date type value.
Source code
DateTime or DateTime64 columns, you can use both strings and JS Date objects. JS Date objects can be passed to insert as-is with date_time_input_format set to best_effort. See this example for more details.
Decimal* types caveats
It is possible to insert Decimals usingJSON* family formats. Assuming we have a table defined as:
JSON* formats, ClickHouse will return Decimals as numbers by default, which could lead to precision loss. To avoid this, you could cast Decimals to string in the query:
Integral types: Int64, Int128, Int256, UInt64, UInt128, UInt256
Though the server can accept it as a number, it is returned as a string inJSON* family output formats to avoid
integer overflow as max values for these types are bigger than Number.MAX_SAFE_INTEGER.
This behavior, however, can be modified
with output_format_json_quote_64bit_integers setting
.
Example: Adjust the JSON output format for 64-bit numbers.
ClickHouse settings
The client can adjust ClickHouse behavior via settings mechanism. The settings can be set on the client instance level so that they will be applied to every request sent to the ClickHouse:Advanced topics
Queries with parameters
You can create a query with parameters and pass values to them from client application. This allows to avoid formatting query with specific dynamic values on client side. Format a query as usual, then place the values that you want to pass from the app parameters to the query in braces in the following format:name— Placeholder identifier.data_type- Data type of the app parameter value.
Compression
NB: request compression is currently not available in the Web version. Response compression works as normal. Node.js version supports both. Data applications operating with large datasets over the wire can benefit from enabling compression. Currently, onlyGZIP is supported using zlib.
response: trueinstructs ClickHouse server to respond with compressed response body. Default value:response: falserequest: trueenables compression on the client request body. Default value:request: false
Logging (Node.js only)
The default logger implementation emits log records intostdout via console.debug/info methods and stderr via console.warn/error methods.
You can customize the logging logic via providing a LoggerClass, and choose the desired log level via level parameter (default is WARN):
TRACE- low-level information about the Keep-Alive sockets life cycleDEBUG- response information (without authorization headers and host info)INFO- mostly unused, will print the current log level when the client is initializedWARN- non-fatal errors; failedpingrequest is logged as a warning, as the underlying error is included in the returned resultERROR- fatal errors fromquery/insert/exec/commandmethods, such as a failed request
TLS certificates (Node.js only)
Node.js client optionally supports both basic (Certificate Authority only) and mutual (Certificate Authority and client certificates) TLS. Basic TLS configuration example, assuming that you have your certificates incerts folder
and CA file name is CA.pem:
Keep-alive configuration (Node.js only)
The client enables Keep-Alive in the underlying HTTP agent by default, meaning that the connected sockets will be reused for subsequent requests, andConnection: keep-alive header will be sent. Sockets that are idling will remain in the connection pool for 2500 milliseconds by default (see the notes about adjusting this option).
keep_alive.idle_socket_ttl is supposed to have its value a fair bit lower than the server/LB configuration. The main reason is that due to HTTP/1.1 allowing the server to close the sockets without notifying the client, if the server or the load balancer closes the connection before the client does, the client could try to reuse the closed socket, resulting in a socket hang up error.
If you’re modifying keep_alive.idle_socket_ttl, keep in mind that it should be always in sync with your server/LB Keep-Alive configuration, and it should be always lower than that, ensuring that the server never closes the open connection first.
Adjusting idle_socket_ttl
The client sets keep_alive.idle_socket_ttl to 2500 milliseconds, as it can be considered the safest default; on the server side keep_alive_timeout might be set to as low as 3 seconds in ClickHouse versions prior to 23.11 without config.xml modifications.
You can find the correct Keep-Alive timeout value in the server response headers by running the following command:
Connection and Keep-Alive headers in the response. For example:
keep_alive_timeout is 10 seconds, and you could try increasing keep_alive.idle_socket_ttl to 9000 or even 9500 milliseconds to keep the idling sockets open for a bit longer than by default. Keep an eye on potential “Socket hang-up” errors, which will indicate that the server closes the connections before the client does so, and lower the value until the errors disappear.
Troubleshooting
If you’re experiencingsocket hang up errors even when using the latest version of the client, there are the following options to resolve this issue:
-
Enable logs with at least
WARNlog level (default). This will allow for checking if there is an unconsumed or a dangling stream in the application code: the transport layer will log it on the WARN level, as that could potentially lead to the socket being closed by the server. You can enable logging in the client configuration as follows: -
Make sure that the desired configuration is applied to the correct client instance. If you have multiple client instances in your application, double-check that the one you’re using for queries has the correct
keep_alive.idle_socket_ttlvalue. -
Reduce the
keep_alive.idle_socket_ttlsetting in the client configuration by 500 milliseconds. In certain situations, for example, high network latency between client and server, it could be beneficial, ruling out the situation where an outgoing request could obtain a socket that the server is going to close. -
If this error is happening during long-running queries with no data coming in or out (for example, a long-running
INSERT FROM SELECT), this might be due to a load balancer or other network components closing long-lived connections or long running requests. You could try forcing some data coming in during long-running queries by using a combination of these ClickHouse settings:Keep in mind, however, that the total size of the received headers has 16KB limit in recent Node.js versions; after certain amount of progress headers received, which was around 70-80 in our tests, an exception will be generated. It is also possible to use an entirely different approach, avoiding wait time on the wire completely; it could be done by leveraging HTTP interface “feature” that mutations aren’t cancelled when the connection is lost. See this example (part 2) for more details. -
Keep-Alive feature can be disabled entirely. In this case, client will also add
Connection: closeheader to every request, and the underlying HTTP agent won’t reuse the connections.keep_alive.idle_socket_ttlsetting will be ignored, as there will be no idling sockets. This will result in additional overhead, as a new connection will be established for every request. -
Rule out potential issues with the rest of the network stack including Node.js itself by running a simple command-line test with the same ClickHouse instance and the same network path (i.e. from the same machine or network segment, e.g. a Kubernetes pod), for example, using
curl:You might want to run it in a loop for several minutes. If you see similar errors incurl, it is likely that the issue is not related to the client configuration, but rather to the network stack or the server configuration. -
To test the connection with plain Node.js functionality, you can try to create a simple HTTP request to the ClickHouse server using the built-in
fetchAPI:
-
In some cases the application code or the framework adapters can add a preemptive
ping()before the actual query execution, which can lead to a situation where theping()request is successful, but the subsequent query request fails with a “socket hang up” error due to the same underlying issue with idle connections. If you see that pattern in the logs, try to check if there is an option to disable preemptive pings in your framework or application code. This should also help with reducing the probability of getting rate limited by any of the intermediate network components. - Make sure that the application itself is getting enough CPU time and the network is not throttled by the hosting provider. Various means of monitoring like GC pause metrics, event loop lag metrics, and similar ones can also be helpful to rule out potential resource starvation issues.
- Try checking your application code with no-floating-promises ESLint rule enabled, which will help to identify unhandled promises that could lead to dangling streams and sockets.
Read-only users
When using the client with a readonly=1 user, the response compression can’t be enabled, as it requiresenable_http_compression setting. The following configuration will result in an error:
Proxy with a pathname
If your ClickHouse instance is behind a proxy, and it has pathname in the URL as in, for example, http://proxy:8123/clickhouse_server, specifyclickhouse_server as pathname configuration option (with or without a leading slash); otherwise, if provided directly in the url, it will be considered as the database option. Multiple segments are supported, e.g. /my_proxy/db.
Reverse proxy with authentication
If you have a reverse proxy with authentication in front of your ClickHouse deployment, you could use thehttp_headers setting to provide the necessary headers there:
Custom HTTP/HTTPS agent (experimental, Node.js only)
By default, the client will configure the underlying HTTP or HTTPS agent using the settings provided in the client configuration (such asmax_open_connections, keep_alive.enabled, tls), which will handle the connections to the ClickHouse server. Additionally, if TLS certificates are used, the underlying agent will be configured with the necessary certificates, and the correct TLS auth headers will be enforced.
After 1.2.0, it is possible to provide a custom HTTP or HTTPS agent to the client, replacing the default underlying one. It could be useful in case of tricky network configurations. The following conditions apply if a custom agent is provided:
- The
max_open_connectionsandtlsoptions will have no effect and will be ignored by the client, as it is a part of the underlying agent configuration. keep_alive.enabledwill only regulate the default value of theConnectionheader (true->Connection: keep-alive,false->Connection: close).- While the idle keep-alive socket management will still work (as it isn’t tied to the agent but to a particular socket itself), it is now possible to disable it entirely by setting the
keep_alive.idle_socket_ttlvalue to0.
Custom agent usage examples
Using a custom HTTP or HTTPS Agent without certificates:set_basic_auth_header setting (introduced in 1.2.0), as it conflicts with the TLS headers. All the TLS headers should be provided manually.
Known limitations (Node.js/web)
- There are no data mappers for the result sets, so only language primitives are used. Certain data type mappers are planned with RowBinary format support.
- There are some Decimal* and Date* / DateTime* data types caveats.
- When using JSON* family formats, numbers larger than Int32 are represented as strings, as Int64+ types maximum values are larger than
Number.MAX_SAFE_INTEGER. See the Integral types section for more details.
Known limitations (web)
- Streaming for select queries works, but it is disabled for inserts (on the type level as well).
- Request compression is disabled and configuration is ignored. Response compression works.
- No logging support yet.
Tips for performance optimizations
- To reduce application memory consumption, consider using streams for large inserts (e.g. from files) and selects when applicable. For event listeners and similar use cases, async inserts could be another good option, allowing to minimize, or even completely avoid batching on the client side. Async insert examples are available in the client repository, with
async_insert_as the file name prefix. - The client doesn’t enable request or response compression by default. However, when selecting or inserting large datasets, you could consider enabling it via
ClickHouseClientConfigOptions.compression(either for justrequestorresponse, or both). - Compression has significant performance penalty. Enabling it for
requestorresponsewill negatively impact the speed of selects or inserts, respectively, but will reduce the amount of network traffic transferred by the application.
Contact us
If you have any questions or need help, feel free to reach out to us in the Community Slack (#clickhouse-js channel) or via GitHub issues.