Financial data never stops moving. Prices tick up and down, trades execute in milliseconds, and quotes update thousands of times per second. Capturing that stream and turning it into something usable in real time is a tough engineering problem, but with the right tools, it becomes approachable.
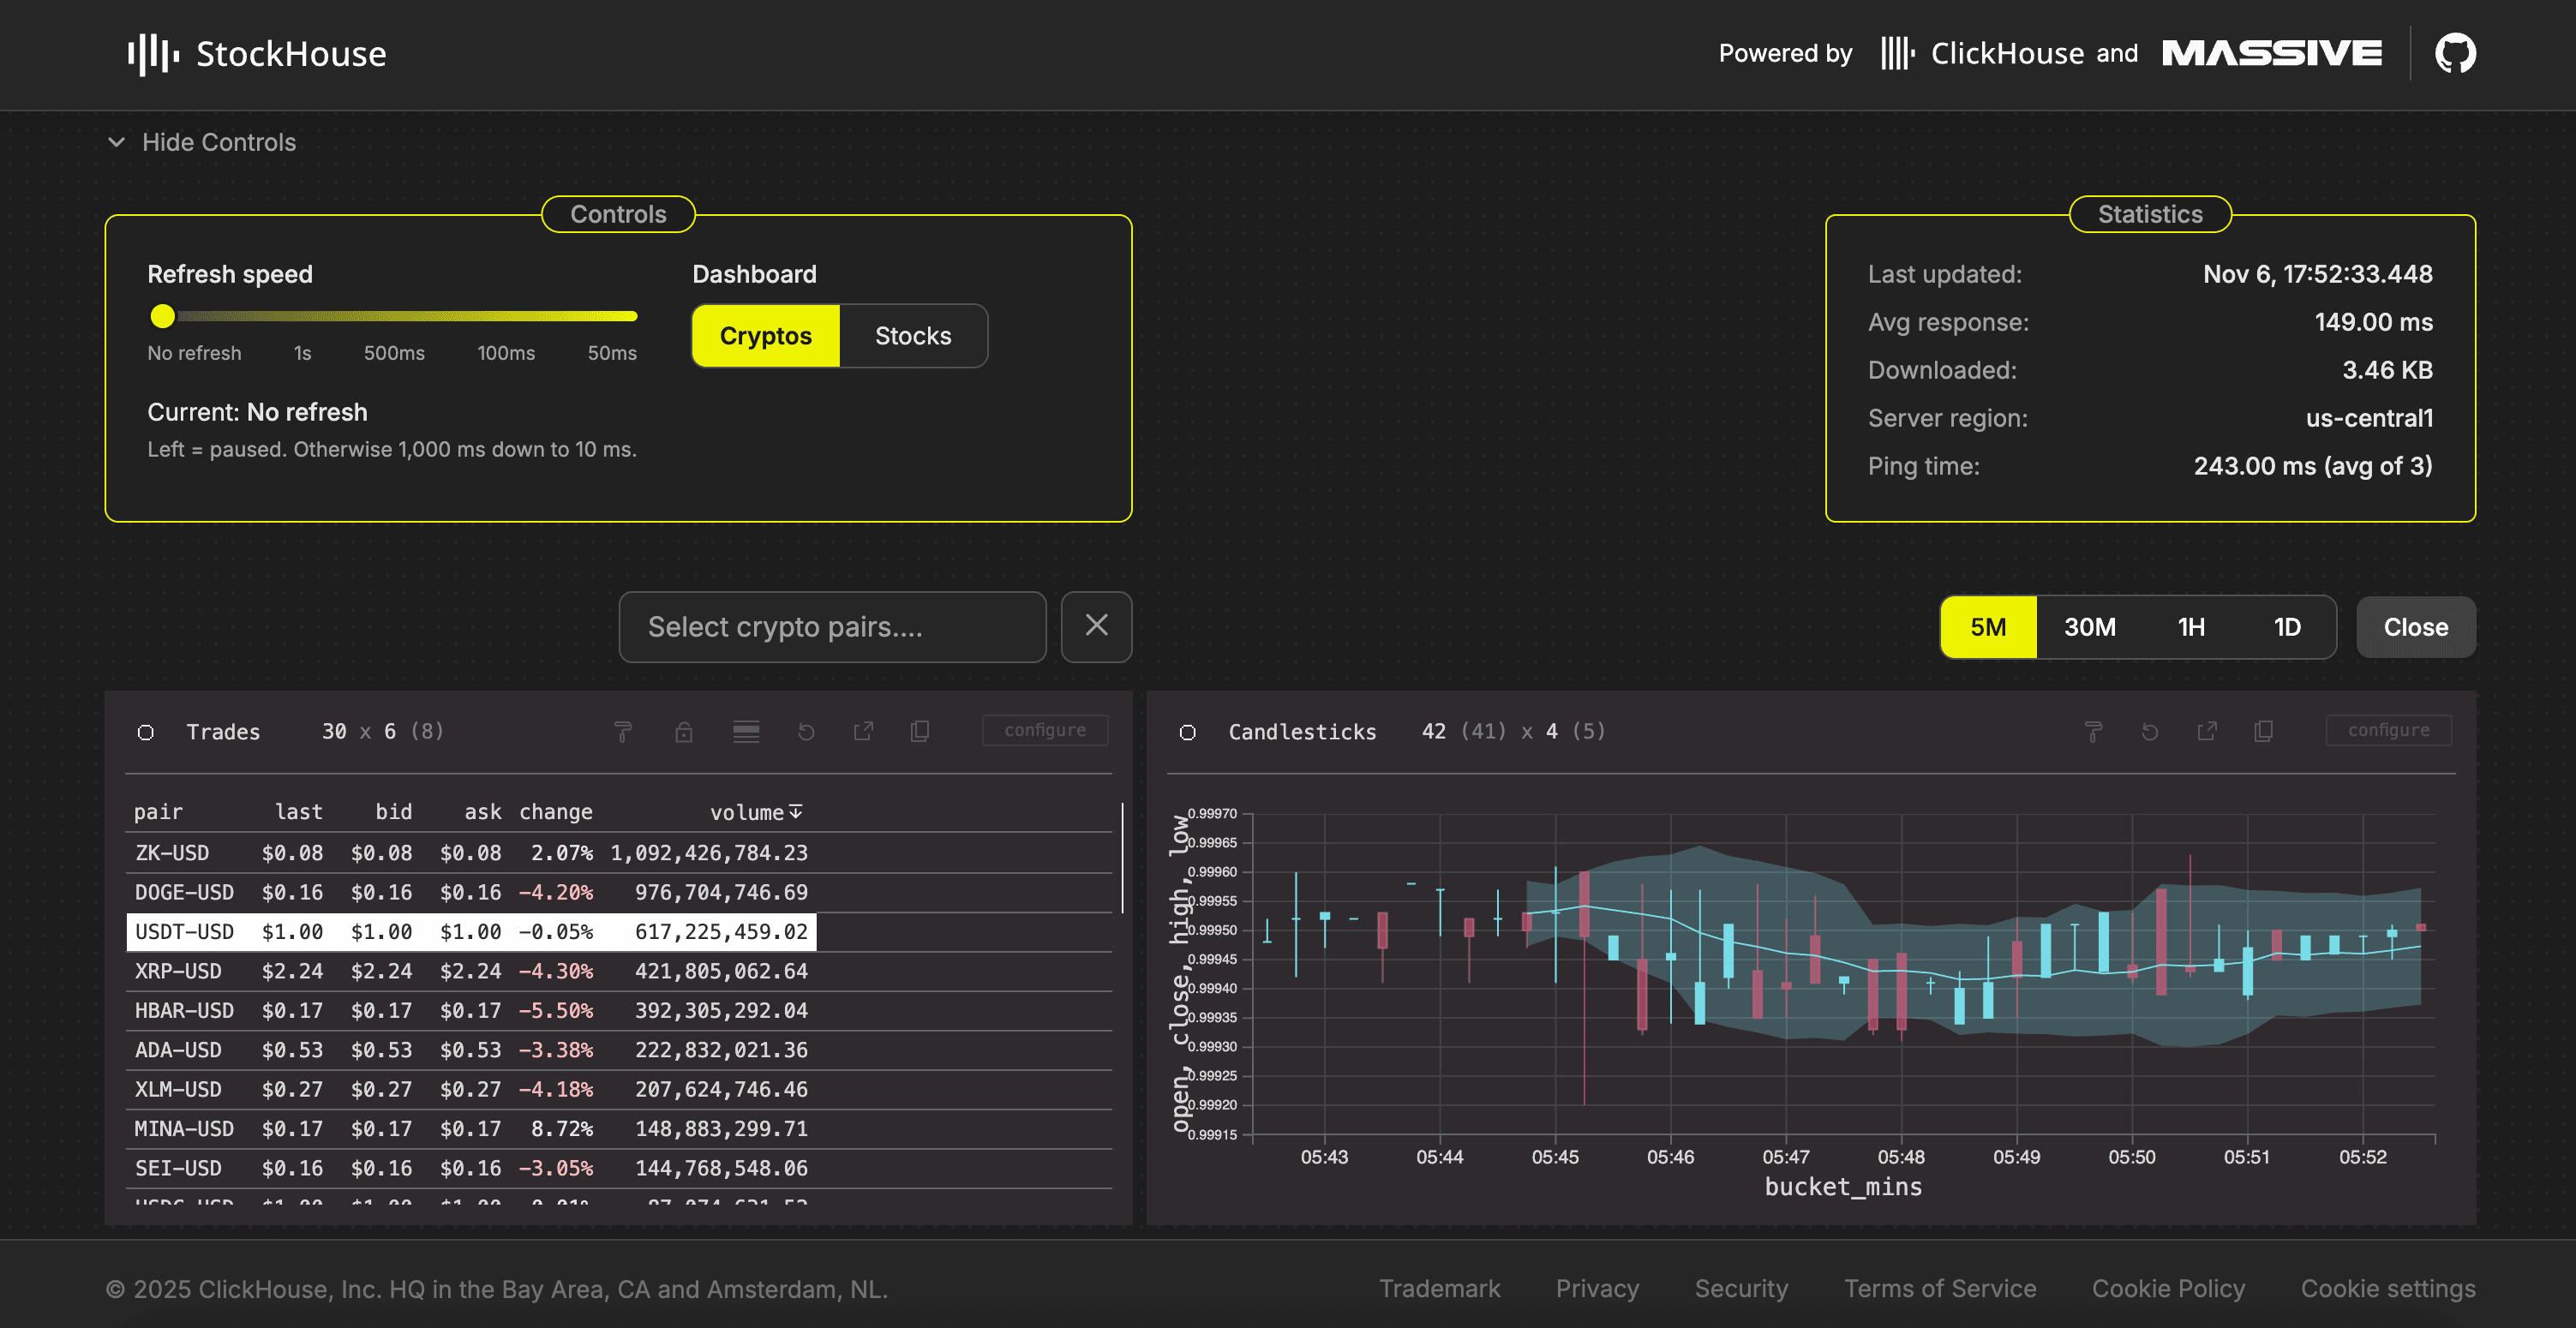
StockHouse is a complete demo showing how to build a streaming market analytics app using ClickHouse, Massive, and Perspective.
You can explore the live version at stockhouse.clickhouse.com.

StockHouse ingests live market data from Massive's WebSocket APIs, stores it efficiently in ClickHouse, and visualizes it in a web dashboard that updates within milliseconds. The goal is to demonstrate how to handle high-frequency, high-volume data end-to-end: ingestion, storage, aggregation, and real-time visualization.
Why build it #
Market data is the perfect test case for real-time analytics. It's fast, continuous, and always changing. Traditional systems often fall behind when asked to process millions of tiny updates per second.
ClickHouse was designed for that kind of load: fast ingestion, low-latency queries, and efficient compression for time-series data.
StockHouse shows this in action:
- Streaming ingestion from Massive's real-time stock and crypto feeds
- Efficient time-series schema optimized for inserts and queries
- Low-latency analytics with ClickHouse materialized views
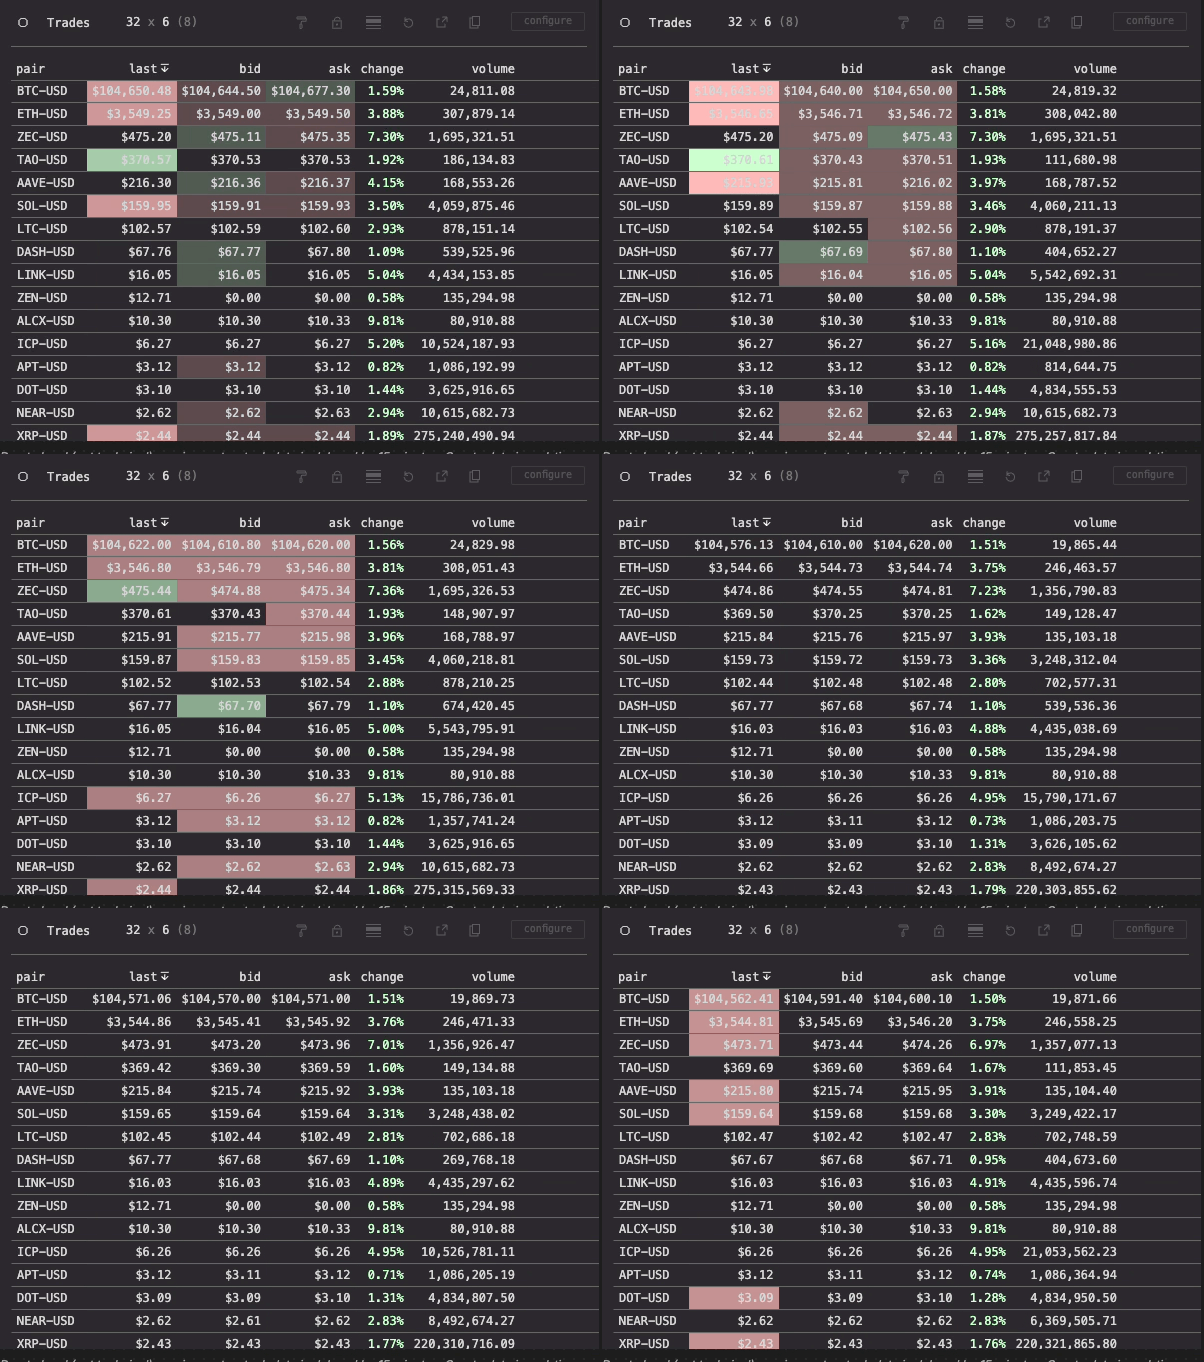
- Interactive visualizations that update as fast as the data arrives
The system is simple enough to run locally but powerful enough to handle millions of events per second, which is a solid starting point for anyone building trading dashboards, analytics tools, or observability systems.
Architecture overview #
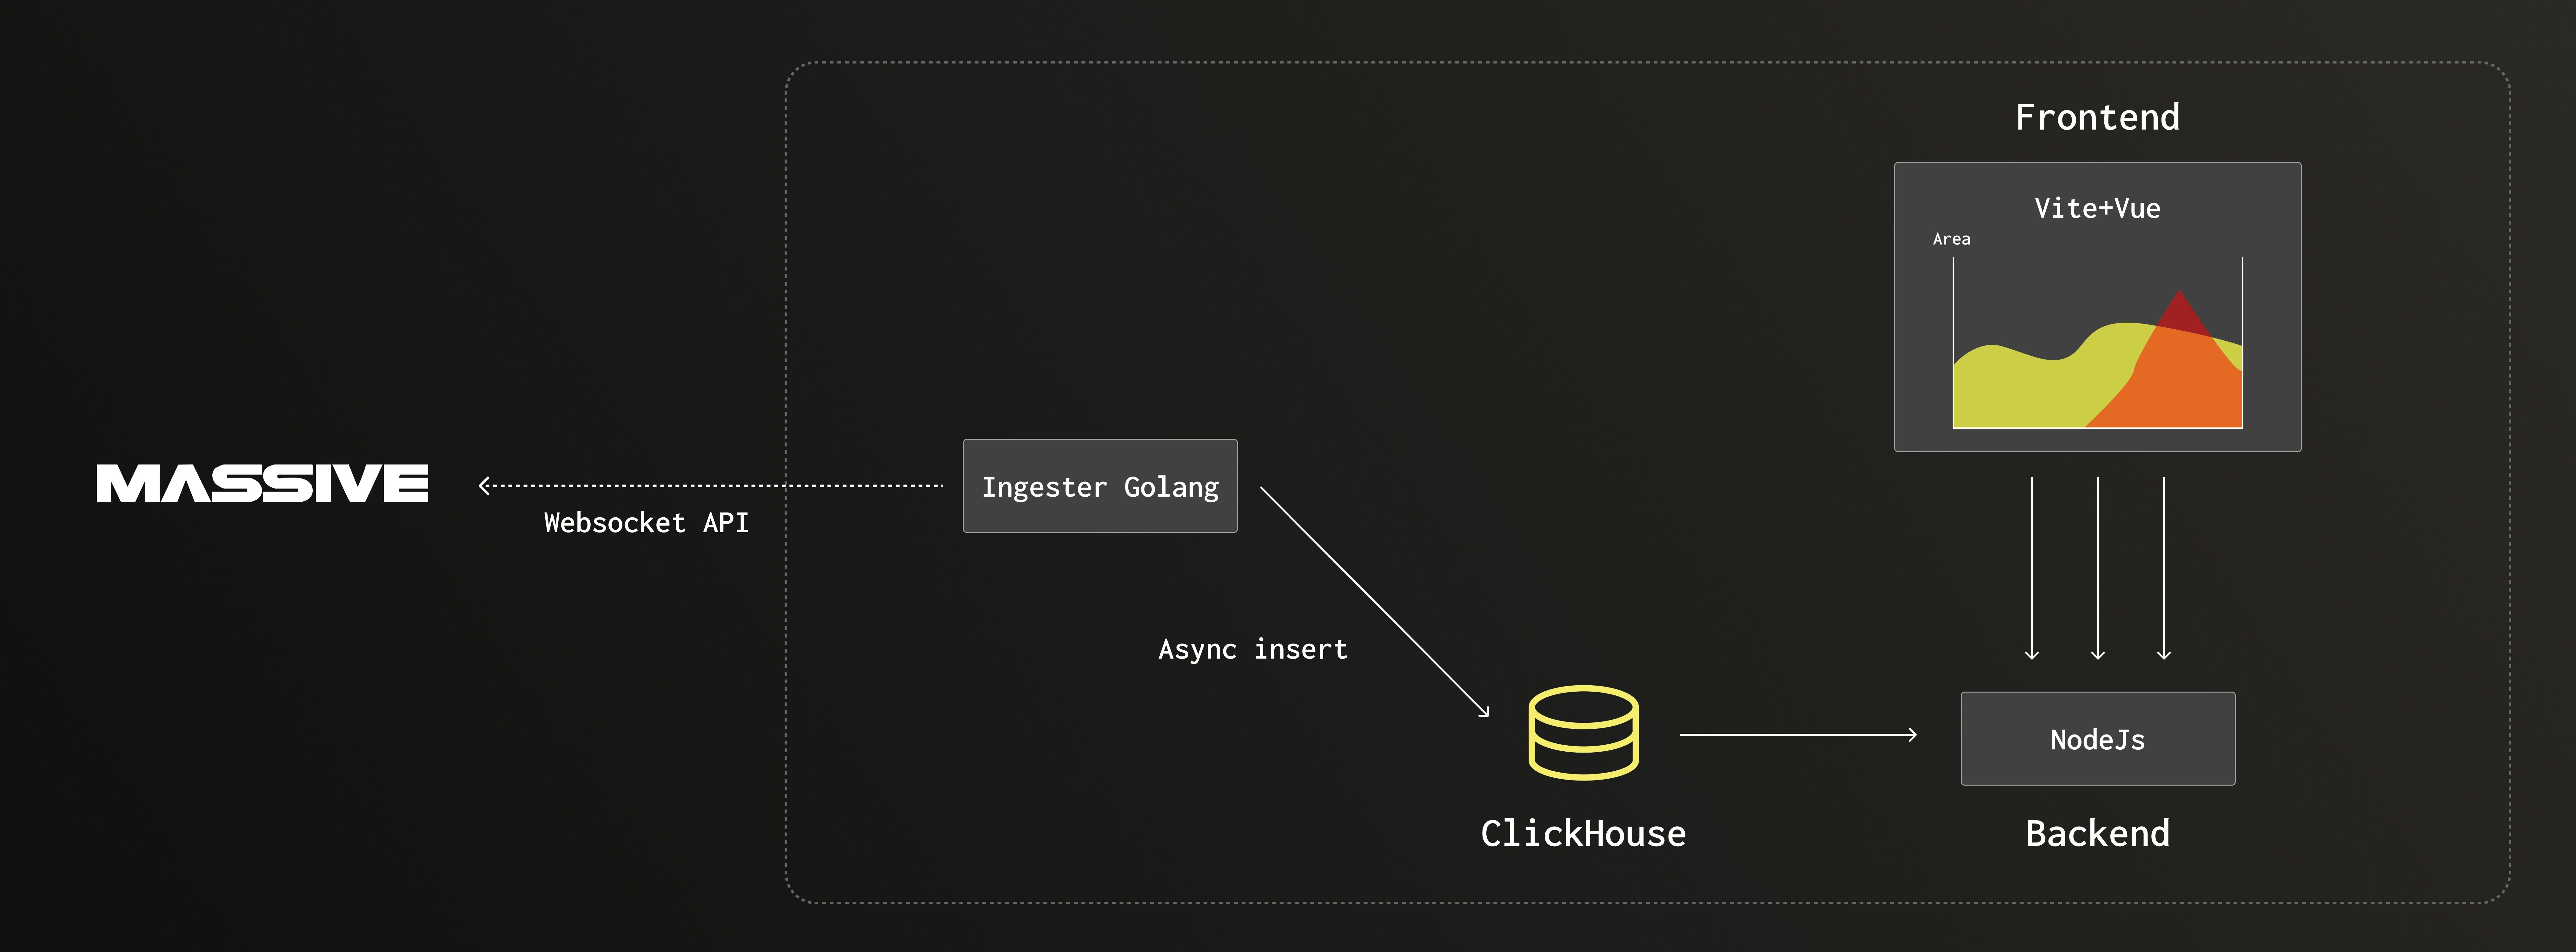
StockHouse consists of five components that form a straightforward streaming pipeline:
- Data Source -- Massive WebSocket APIs stream live stock and crypto market data.
- Ingester -- A Go service that consumes the stream and writes to ClickHouse.
- Database -- ClickHouse tables and materialized views optimized for real-time analytics.
- Backend -- A Node.js API that connects the frontend to ClickHouse efficiently.
- Frontend -- A Vue.js dashboard powered by Perspective for high-performance charts.

Let's look at some of the key technical decisions behind this setup.
Ingester in Go #
The ingestion layer is written in Go to handle high event rates while keeping CPU and memory usage low. Go's concurrency model (goroutines and channels) allows the ingester to process multiple WebSocket streams in parallel without blocking.
It uses ClickHouse's Native interface, which sends data in the database's binary columnar format. This reduces parsing overhead and achieves the highest throughput for inserts, confirmed in the ClickHouse input format benchmark. Recently, Netflix came to the same conclusion while building its ingestion pipeline.
In practice, this lets the ingester push millions of rows per second into ClickHouse while maintaining low latency and predictable resource usage.
Each record (trade, quote, or crypto tick) is batched before insertion, balancing throughput and freshness. The result is a streaming pipeline that can sustain a constant firehose of updates without falling behind.
Real-Time Visualization with Perspective #
On the frontend, StockHouse uses Perspective, an open-source visualization library originally developed at J.P. Morgan and open source through the FINOS community. It's designed for large, continuously updating datasets like financial ticks. This isn't our first time featuring Perspective, it's no surprise we're drawn to tools built for performance.
Perspective's core engine is written in C++ and compiled to WebAssembly, so most computations (aggregations, pivots, filtering) happen off the main thread. This keeps the UI responsive even when thousands of updates arrive each second.
A key advantage is its native support for Apache Arrow, a high-performance columnar format for in-memory data exchange.
ClickHouse also supports Arrow as an output format, which means query results can be streamed directly from ClickHouse to the browser in a binary, zero-copy format. This avoids JSON parsing overhead and makes transferring data between the database and the visualization layer extremely efficient.
In practice, this allows the StockHouse dashboard to pull live data from ClickHouse, feed it straight into Perspective, and render updates immediately, all while keeping latency and CPU load low. The result is a smooth, interactive dashboard that stays in sync with the market in real time.
Pool connection with Node.js #
Between the frontend and ClickHouse sits a lightweight Node.js backend. This layer is small but crucial for performance.
By managing a persistent connection pool to ClickHouse, the backend avoids the overhead of opening new database sessions for every query. It can reuse prepared contexts and execute requests with minimal latency.
In a real-time dashboard, where queries run frequently and continuously, these savings add up as even a few milliseconds per query can make the difference between smooth streaming and lag.
Pre-Aggregation with materialized views #
ClickHouse can aggregate raw data quickly, but for live dashboards, every millisecond counts.
To minimize query time, StockHouse uses materialized views to pre-aggregate data as it's ingested.

For example, the crypto live table keeps updating its content by querying ClickHouse for the latest daily price information for each crypto pair.
To optimize query performance, it is a good idea to pre-aggregate the data at insert time therefore reducing the query operation complexity. See below the Materialized view SQL statement that aggregates the data at insert time.
1-- Create table to store daily crypto price information
2CREATE TABLE agg_crypto_trades_daily
3(
4    `event_date` Date,
5    `pair` LowCardinality(String),
6    `open_price_state` AggregateFunction(argMin, Float64, UInt64),
7    `last_price_state` AggregateFunction(argMax, Float64, UInt64),
8    `volume_state` AggregateFunction(sum, Float64),
9    `latest_t_state` AggregateFunction(max, UInt64)
10)
11PARTITION BY toYYYYMM(event_date)
12ORDER BY (event_date, pair);
13
14-- MV to keep daily price information up to date
15CREATE MATERIALIZED VIEW mv_crypto_trades_daily TO agg_crypto_trades_daily
16(
17    `event_date` Date,
18    `pair` String,
19    `open_price_state` AggregateFunction(argMin, Float64, UInt64),
20    `last_price_state` AggregateFunction(argMax, Float64, UInt64),
21    `volume_state` AggregateFunction(sum, Float64),
22    `latest_t_state` AggregateFunction(max, UInt64)
23)
24AS SELECT
25    toDate(fromUnixTimestamp64Milli(t, 'UTC')) AS event_date,
26    pair,
27    argMinState(p, t) AS open_price_state,
28    argMaxState(p, t) AS last_price_state,
29    sumState(s) AS volume_state,
30    maxState(t) AS latest_t_state
31FROM crypto_trades
32GROUP BY
33    event_date,
34    pair;
Then, to query the data, the SQL statement is very simple and can be executed in a few milliseconds.
1WITH toDate(now('UTC')) AS curr_day
2    SELECT
3        t.pair AS pair,
4        argMaxMerge(t.last_price_state) AS last,
5        argMinMerge(t.open_price_state) AS open,
6        argMaxMerge(q.bid_state)        AS bid,
7        argMaxMerge(q.ask_state)        AS ask,
8        round(((last - open) / open) * 100, 2) AS change,
9        sumMerge(t.volume_state)                AS volume,
10        toUnixTimestamp64Milli(now64()) -
11        greatest(maxMerge(t.latest_t_state), maxMerge(q.latest_t_state)) AS last_update
12    FROM stockhouse.agg_crypto_trades_daily AS t
13    LEFT JOIN stockhouse.agg_crypto_quotes_daily AS q
14        USING (event_date, pair)
15    WHERE event_date = curr_day
16    AND pair in ('BTC-USD','ETH-USD','XRP-USD','ZEC-USD','ALEO-USD','SOL-USD','DASH-USD','SUI-USD','ICP-USD','NEAR-USD','TAO-USD','DOGE-USD','HBAR-USD','LINK-USD','ZK-USD','LTC-USD','XLM-USD','ADA-USD','ZEN-USD','ALCX-USD','APT-USD','USDT-USD','SEI-USD','SYRUP-USD','ONDO-USD','AERO-USD','DOT-USD','USDC-USD','XTZ-USD','MINA-USD','FIL-USD','AAVE-USD')
17    GROUP BY pair
18    ORDER BY pair ASC
The pattern raw data → aggregated → visualization is a standard way to balance flexibility and speed in ClickHouse. The raw data remains available for historical or analytical queries, while the pre-aggregated tables keep the live UI fast.
Putting it all together #
Here's how it flows:
- Massive streams live market data over WebSocket.
- The Go ingester parses and inserts events into ClickHouse via the native interface.
- Materialized views aggregate data in real time.
The Node.js backend serves fast queries through pooled connections. - The Vue + Perspective frontend visualizes updates within milliseconds.
The result is a responsive dashboard that stays current with live market activity.
Try it yourself #
You can explore the running demo at stockhouse.clickhouse.com or deploy it locally using the setup instructions in the GitHub repository.
All you need is Node.js, Docker, and a Massive API key to start streaming live data into your own ClickHouse instance. Massive has a free tier for basic use and paid plans that include unlimited API calls and full real-time data access.
StockHouse raw data is also available on our SQL playground if you want to explore it using SQL.
Final thoughts #
StockHouse isn't just a demo; it's a reference architecture for anyone building real-time analytics systems.
By combining a streaming data source (Massive), a fast analytical database (ClickHouse), and a high-performance visualization layer (Perspective), you can handle massive event streams and deliver insights instantly.
Whether you're tracking financial markets, monitoring infrastructure metrics, or analyzing sensor data, the same principles apply: ingest fast, store efficiently, and query faster.


