In our first and second blog posts about building ClickHouse's internal data warehouse, we shared our journey from a small-scale analytics system to a comprehensive enterprise DWH serving as for now over 300 users with tens of data sources and 2.1 PB of compressed data.
Today, I'm excited to share the next chapter of this evolution: how we transformed our traditional BI-first approach into an AI-first data warehouse that handles approximately 70% of our internal analytics use cases.
By the end of this blog post, you'll have learnt how to let your data warehouse users ask questions and get insights without writing a single line of SQL.

Full disclosure: I was a complete AI skeptic just less than a year ago. With 15 years of experience in data warehousing, I had tried early LLMs with data sources and found the results disappointing and unreliable. The hallucinations, the lack of context awareness, and the inability to handle complex business logic made me dismiss AI as a viable solution for enterprise analytics. But sometimes, being wrong feels incredibly good.
Before AI: The traditional BI workflow bottleneck #
To understand the magnitude of this transformation, it's important to describe how our teams interacted with the DWH before AI. Despite having a robust data infrastructure with ClickHouse Cloud and Superset, the traditional workflow created significant friction between business questions and actionable insights:
- Our Engineering team spent considerable time writing complex SQL queries to investigate service health issues. A typical investigation into why a specific customer service was experiencing performance problems would require joining data across multiple tables - service metadata from our Control Plane, query performance metrics from the Data Plane, scaling events from our autoscaler logs, and any related support tickets from Salesforce. An engineer would need to remember table schemas, write JOINs across 4-5 tables, apply correct date filters, and often iterate multiple times to get the right level of detail. What should be a 5-minute question ("What happened to service X last week?") became a 30-45 minute SQL writing exercise.
What should be a 5-minute question became a 30-45 minute exercise.
-
The Sales team faced similar challenges when prospects asked specific questions during calls. Simple requests like "How much is this customer consuming compared to similar companies in their industry?" required joining usage data with account information, filtering by company size and vertical, calculating percentiles, and often building quick visualizations. Sales engineers would either interrupt analyst time for urgent requests or spend their own time learning our data model instead of focusing on customer relationships.
-
Our Product team had the most complex analytical needs, often requiring deep cohort analysis and feature usage research. Understanding customer retention patterns meant writing sophisticated window functions across multiple data marts, calculating complex metrics like "time to first value" or "feature adoption curves," and often creating temporary staging tables for multi-step analyses. A single product insight like "Which onboarding steps correlate with higher 90-day retention?" could take a senior analyst an entire day to properly investigate.
A single product insight could take a senior analyst an entire day to properly investigate.
-
The Finance team regularly needed to prepare board reports and investor materials, requiring precise calculations of MRR, churn rates, customer lifetime value, and revenue forecasts. These analyses demanded not just technical SQL skills but deep understanding of our business logic - how credits convert to revenue, how different pricing plans should be treated, which organizations to exclude from calculations. The margin for error was zero, meaning extensive quality checks and manual validation of every number.
-
Finally, our Cost Optimization team conducted some of the most complex analyses in our DWH, correlating our ClickHouse Cloud service consumption with underlying AWS, GCP, and Azure costs. Understanding whether a spike in customer usage was efficiently handled by our autoscaling or resulted in cost overruns required joining billing data from multiple cloud providers, mapping it to customer services, and analyzing the efficiency of our resource allocation algorithms. These investigations were critical for maintaining healthy unit economics but required deep expertise in both our internal systems and cloud provider billing models.
The result was a classic BI bottleneck: either teams developed advanced SQL skills (reducing focus on their core responsibilities), or they created a queue of requests for our small analyst team. Even with Superset's user-friendly interface, the underlying complexity of our data model and business logic made self-service analytics largely theoretical for most users.
The transformation catalyst #
Even with the described bottleneck, our DWH was BI-centric without any parts of the workload transferred to AI. The fundamental barriers to AI adoption in enterprise data environments were seemingly insurmountable: unreliable model outputs, lack of standardized data source integrations, and the inability to maintain business context across complex analytical workflows. Before late 2024, attempting to use LLMs for serious data warehouse operations was more likely to create confusion than insights. Several technological advances converged in late 2024 that fundamentally changed the AI-for-data landscape:
Model quality breakthrough #
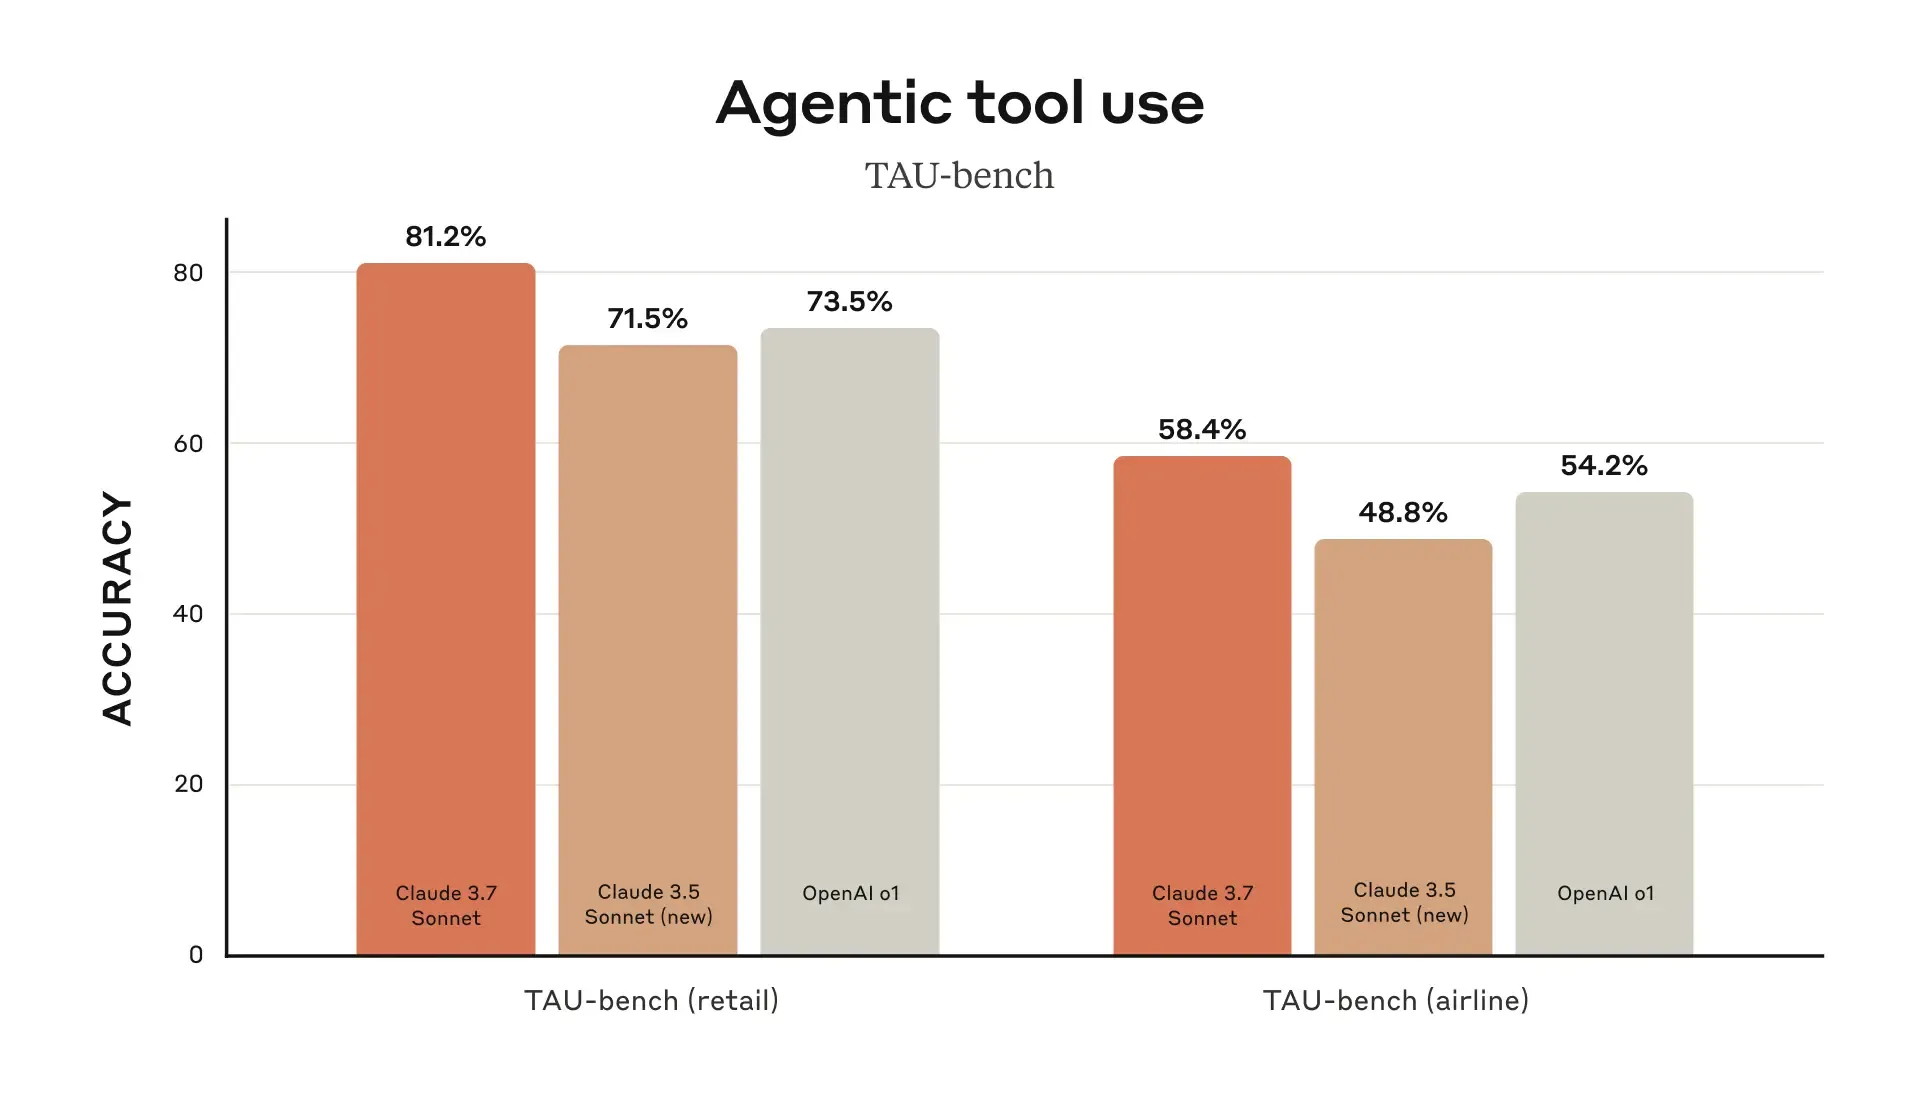
The release of Anthropic's Claude 3.5 Sonnet, and subsequently Claude 3.7 and 4.0, marked a significant leap in LLM capabilities for technical tasks. Unlike previous models, Claude demonstrates remarkable proficiency in:
- Writing complex SQL queries with JOINs, window functions, and database-specific syntax
- Self-correcting query errors based on database feedback
- Understanding table sizes and writing optimized queries with appropriate filters
- Generating interactive charts and visualizations on-the-fly
- Taking into account large portions of business context from multiple data sources

Image from the Claude 3.7 release blog post
MCP: The missing integration layer #
In November 2024, Anthropic released the Model Context Protocol (MCP) - an open-source standard for connecting LLMs to external data sources and tools. This protocol solved our biggest challenge: providing reliable, structured access to multiple data sources without vendor lock-in. Within weeks of its release, hundreds of MCP servers became available, covering everything from databases to file systems to APIs. Recognizing the potential of this new protocol, we quickly developed our own ClickHouse MCP server, making it even easier for organizations to connect their ClickHouse instances to LLMs.
Building the foundation: More than just connecting databases #
Connecting an LLM to your data warehouse is the easy part. Building a reliable, enterprise-grade AI-first analytics platform requires addressing several critical components:
Comprehensive business glossary #
Data without context is useless, and this is exponentially true for LLMs. We already had a robust internal data wiki built with MDBook that documents every significant field across our data marts, including:
- Field definitions and business context
- Possible values and data ranges
- Business processes that generate the data
- Relationships between entities across different source systems
The key was making this glossary LLM-accessible through GitHub and filesystem MCP server integrations, allowing our AI assistant to reference documentation in real-time.
Enhanced data quality processes #
While human analysts can often work around data quality issues, LLMs amplify them dramatically. A missing customer_id that a human would flag as problematic could lead an LLM to generate completely incorrect analyses. Even before the AI era, we invested heavily in:
- Automated data validation rules
- Comprehensive data lineage tracking
- Real-time data quality monitoring
- Clear data freshness indicators
Most of these tasks are executed seamlessly inside DBT models when building the data.
Enterprise-grade, self-hosted LLM interface #
Following our principle of avoiding vendor lock-in, we needed a self-hosted solution that could:
- Work with multiple LLM providers
- Support MCP server integration
- Provide enterprise features like SSO and audit logging
- Generate and display visual artifacts
- Enable chat sharing and collaboration
After evaluating multiple options, we selected LibreChat, an open-source ChatGPT alternative that met all our requirements while maintaining the flexibility to switch LLM providers as needed.
Architecture: DWAINE is born #
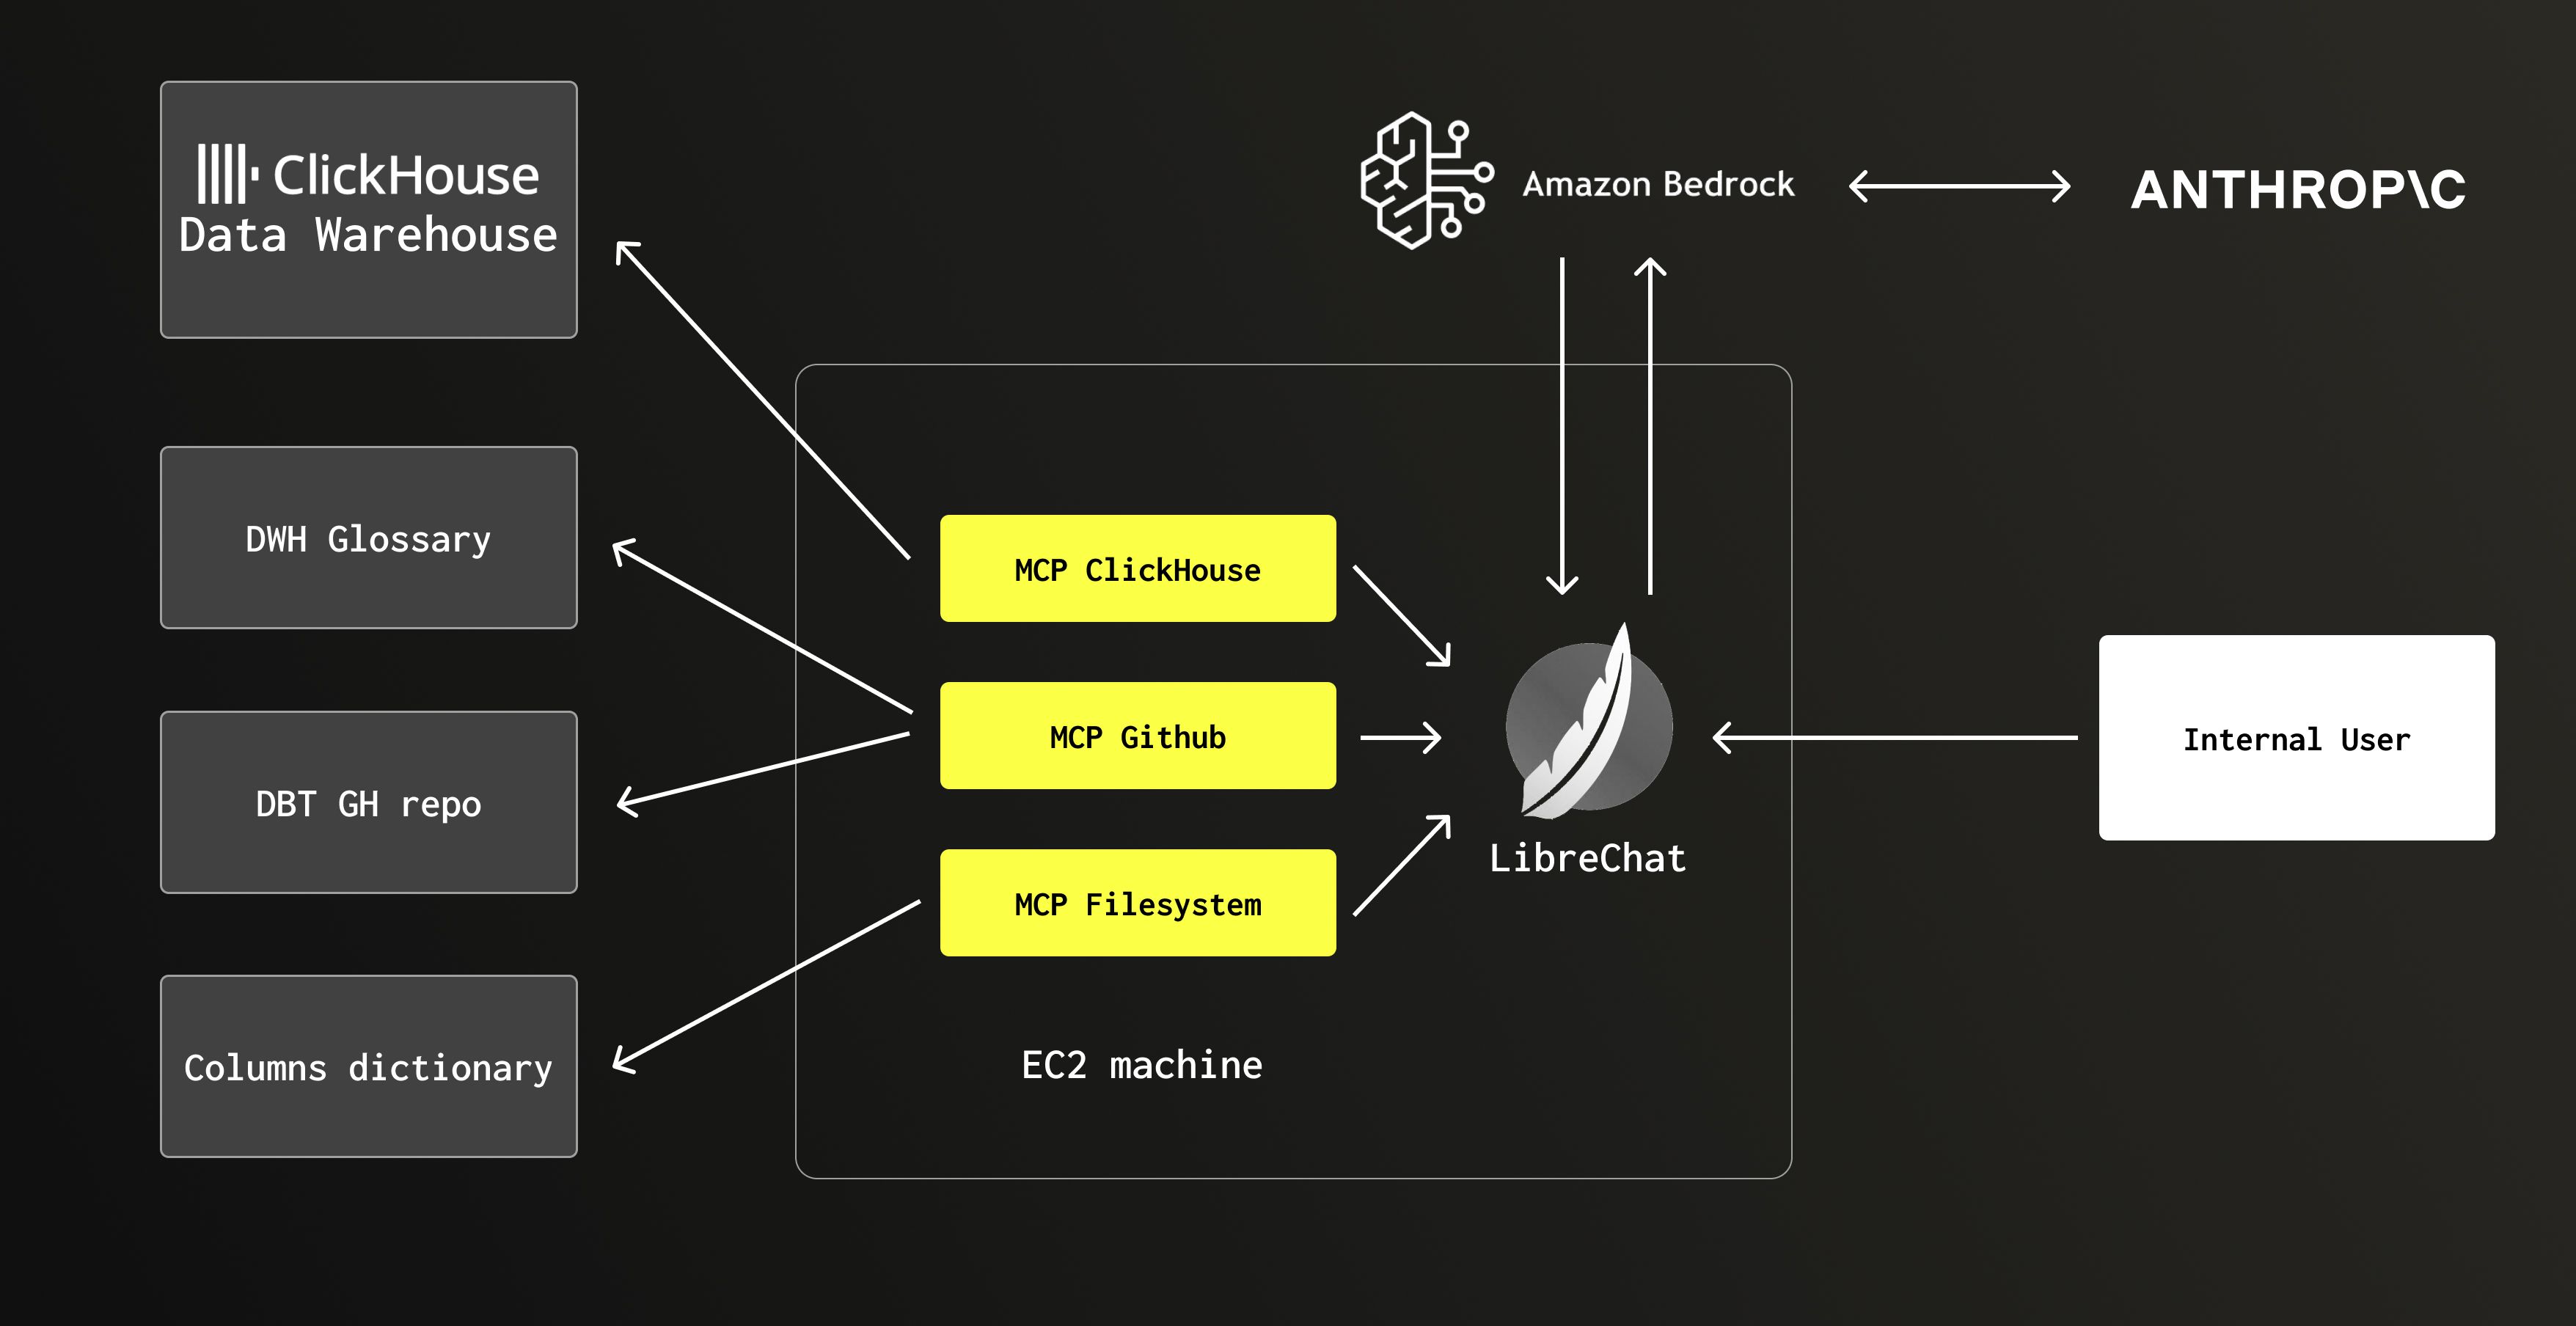
Meet DWAINE (Data Warehouse AI Natural Expert) - our internal AI assistant that has fundamentally changed how we interact with our data warehouse.

Fig. 1 - DWAINE architecture
The architecture consists of:
| Component | Technology | Purpose |
|---|---|---|
| UI Layer | LibreChat | User interface, chat management, artifact rendering |
| LLM Provider | Anthropic Claude 4.0 | Natural language processing, SQL generation, and analysis. We use the LLM through AWS Bedrock for billing consolidation, cross-region inference, etc. |
| Integration Layer | MCP Servers | ClickHouse MCP server for accessing the DWH GitHub MCP server for getting context from DBT models and business glossary Filesystem MCP server for getting the dynamic column dictionary |
| Data Warehouse | ClickHouse Cloud | Main analytical database |
| Documentation | GitHub + filesystem | Business glossary, field definitions, process docs |
Security and privacy considerations #
DWAINE has access to a limited number of primary data marts containing:
- Anonymized service usage metrics
- Credit consumption and billing data
- Internal sales and operational metrics
Critically, DWAINE never accesses:
- Customer PII (names, emails, addresses)
- Customer data (all customer data in ClickHouse Cloud is encrypted)
- Sensitive internal communications or strategic information
This security model follows our existing DWH principles where we collect metadata about database operations without ever accessing the actual customer data.
Real-world performance #
Six months after deployment, DWAINE's adoption metrics are compelling, but the qualitative impact has been even more transformative. DWAINE has dramatically lowered the barrier to entry for data exploration, enabling non-technical users across sales, finance, and operations to get immediate answers to business questions without writing a single line of SQL or understanding our complex charts and dashboards. This democratization of data access has reduced pressure on our three-person DWH team by approximately 50-70%, freeing up our analysts to focus on complex strategic analysis rather than fielding routine data requests. The impact is particularly pronounced with our Sales and Support teams, who frequently ask relatively simple but urgent questions.
Currently, DWAINE is used by more than 250 internal users, that send >200 daily messages in 50-70 daily conversations.
Types of queries DWAINE excels at #
Here are some real examples of questions our teams ask DWAINE daily:
- "Show top 5 services by memory utilization in February 2025"
- "Build a monthly forecast for data stored in AWS us-east-1 based on the last 3 months, take into account seasonality"
- "Show an MRR chart for the last 5 months stacked by salesperson. Show first 5 sales reps by revenue, hide others in 'Other'. Exclude EMEA"
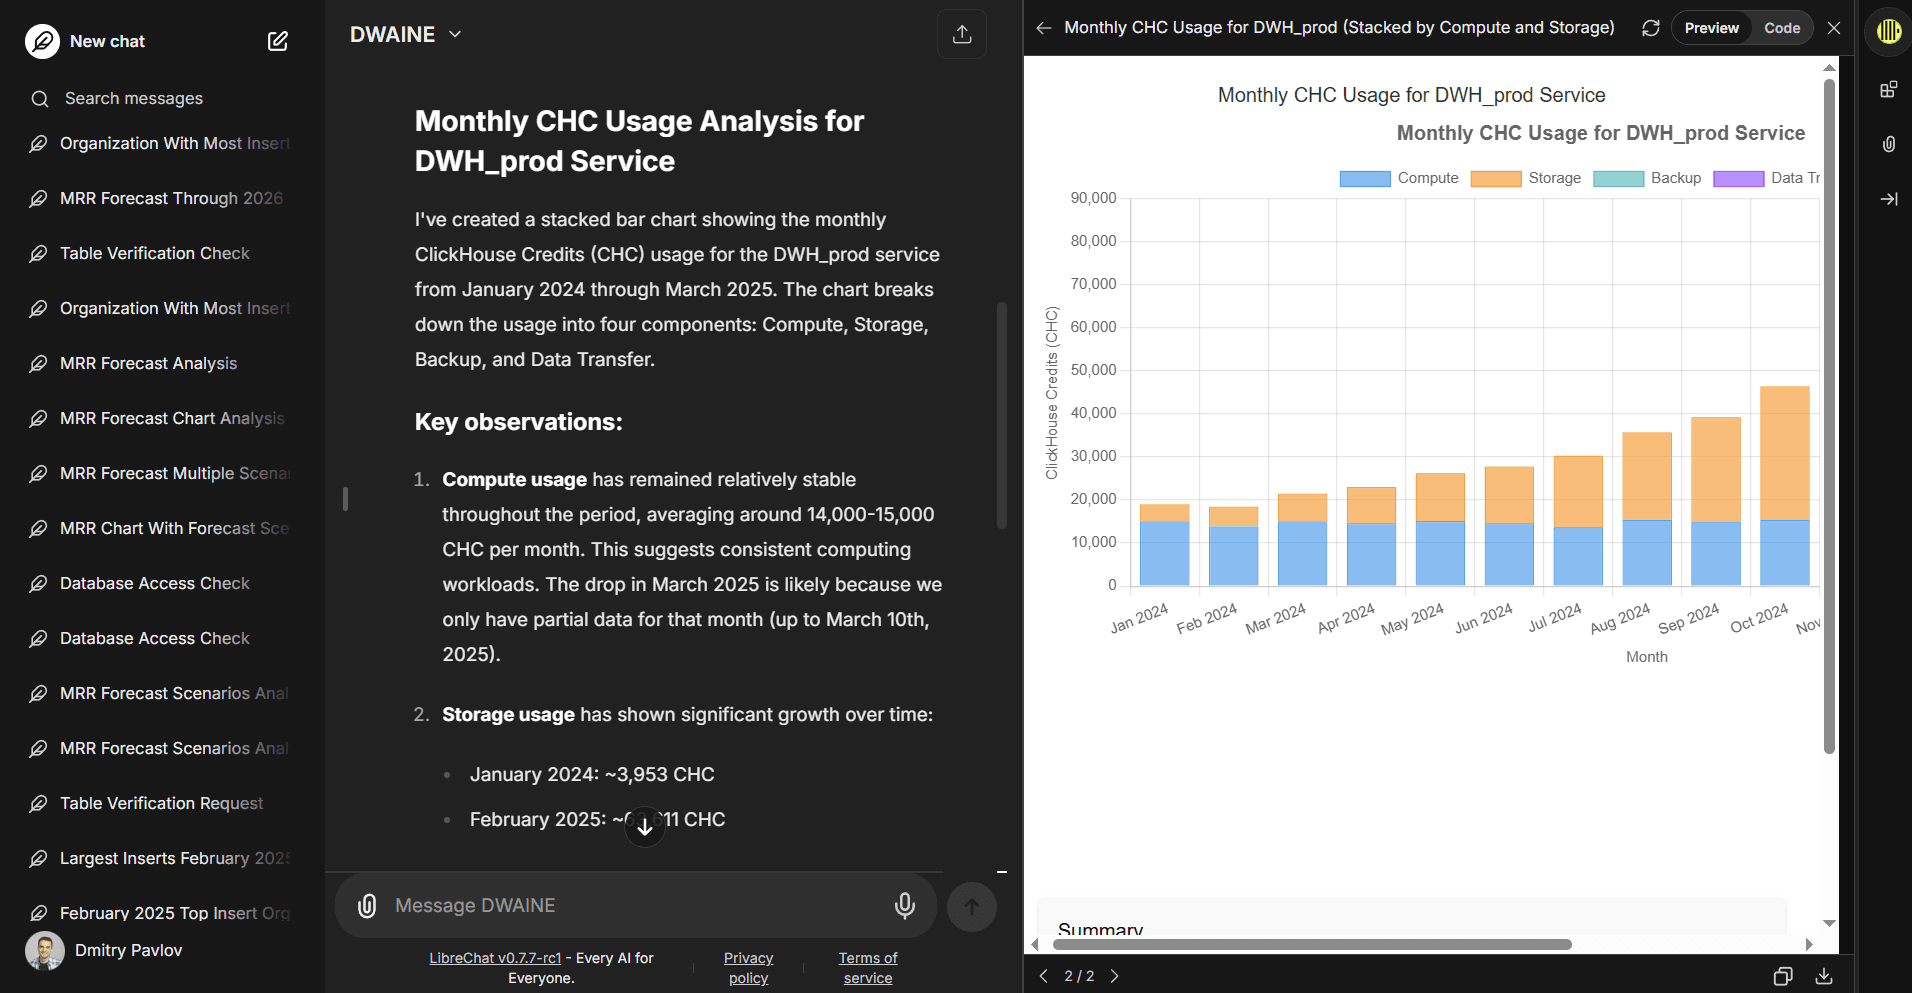
- "Find the customer with the largest number of insert queries in 2025 and build a monthly bar chart showing the number of select queries made by this customer stacked by service name"
What's remarkable is that these queries often require multiple JOINs across different data marts, complex aggregations, and business logic that would typically take an analyst 15-30 minutes to write and validate.

Fig. 2 - Example answer and a visual
The 70/30 split: What stays in traditional BI #
Despite DWAINE's success, approximately 30% of our analytics workload remains in Superset and other traditional BI tools. These include:
Repeatable metrics #
In general, these are standardized reports and dashboards that teams access regularly with no variation in the underlying questions or presentation format. When you need the same metric displayed the same way multiple times per day or week, there's no advantage to asking an AI assistant to regenerate identical charts when a bookmarked dashboard provides instant, consistent access to the information.
On the other hand, such questions and metrics do not overload our DWH team, as internal users can check them independently.
Certified financial metrics #
- Board-level KPIs that require formal certification
- Regulatory reporting metrics
- Metrics with complex, multi-stakeholder approval processes
Deep operational dashboards #
- Real-time operational monitoring for SRE teams
- Complex system health dashboards
- Multi-dimensional performance tracking interfaces
Specialized technical analysis #
- Advanced statistical analysis requiring specific visualization libraries
- Custom interactive applications built on our data
- Integration with external specialized tools
Also, we ask our internal users not to make really important decisions based on DWAINE’s analysis only. If a really important decision must be made, we ask users to ask DWAINE to write a SQL query to prove the results of his research with comprehensive comments. The user could then take this query to a traditional ad-hoc SQL tool and check DWAINE’s logic.
Lessons learned and best practices #
What worked well #
- ClickHouse Cloud's performance was crucial: Sub-second query response times maintain the illusion of conversing with a human analyst
- Comprehensive documentation pays dividends: Our existing MDBook wiki reduced hallucinations dramatically
- MCP standardization: Using open standards prevented vendor lock-in and enabled easy integration expansion
- Gradual rollout: Starting with power users and expanding based on feedback improved adoption
Challenges we faced #
- Context window management: Large schemas require careful prompt engineering to maintain relevant context
- Error handling: Building graceful degradation when LLM queries fail or produce unexpected results. Users should not rely on AI solely when making important decisions
Conclusion #
The transformation from BI-first to AI-first analytics has been one of the most impactful changes in our data culture at ClickHouse. DWAINE hasn't just changed how we query data - it's fundamentally altered how we think about data, making analytics more accessible, conversational, and integrated into daily decision-making.
For organizations still relying primarily on traditional BI tools, the question isn't whether AI will transform analytics, but how quickly you can adapt to stay competitive. The technical foundations are now mature, the tools are available, and the business case is compelling.


