Summary
- Qonto uses ClickHouse Cloud to power observability across its entire banking platform, ingesting traces, logs, and events from eight European markets.
- Migrating from Grafana Tempo for tracing to ClickHouse Cloud extended query windows from 2-3 hours to two weeks without sampling or cardinality constraints.
- In one example, ClickHouse compressed 231 TB high-cardinality of data down to 376 GB (a 99.84% compression ratio), saving $70K in annual S3 storage costs.
- Using the ClickHouse MCP server, Qonto built an AI companion that lets anyone investigate incidents in plain English, with no SQL required.
Qonto is a digital bank serving more than 600,000 small businesses and freelancers across eight European countries. When something goes wrong—a payment fails, an invoice doesn’t go through, someone can’t access their account—the impact is felt immediately.
For Javier Ortiz, Qonto’s Tech Lead for SRE Observability, these are the stakes driving how tooling decisions get made. “Every second counts,” he said at a February 2026 ClickHouse meetup in Paris. “We invest a lot of effort trying to get to the cause of incidents faster, and to understand exactly what happened so we can learn and stop it from happening again.”
We caught up with Javier to learn more about Qonto’s journey with ClickHouse: why their old system wasn’t cutting it, what made them choose ClickHouse Cloud, and how it’s enabled a philosophical shift in how the entire team thinks about observability.
The need for a better database
Before adopting ClickHouse, Qonto’s observability team had solid foundations for logs and metrics. The problem, Javier says, was traces. “We saw a lot of value in traces and wanted to make them a first-class citizen,” he recalls. “But when we tried to put more stress on that and move toward wider events, we hit a limit with our previous system.”
With a setup built around Grafana Tempo, aggregations and queries were so slow that they couldn’t get proper insights from the system. Generating metrics from traces on the fly was painful enough that the team basically didn’t even try. “We always had to play this game,” Javier recalls. “Only ask for two or three hours of data because if you go longer it will crash. We were always trying to protect the system. The only option we had was to sample aggressively, which would take a lot of information away from us.”
The team wanted service overview dashboards. They wanted to query P95 latency across meaningful time ranges. They wanted to stop discarding data before it was even collected. None of it was possible with their existing setup. As Javier puts it, “All the dreams we had, all the use cases we wanted to add on top of traces… we weren’t able to do it.”
So they went looking for something better. Honeycomb was appealing in theory but expensive in practice. SigNoz (which runs on ClickHouse) was closer to what they needed, but the team wanted to control their own schema and keep Grafana as their query interface.
Then Javier became interested in a post from Charity Majors, co-founder and CTO of Honeycomb, who has written about a shift she calls Observability 2.0: replacing the three-pillar model with a single source of truth based on wide structured events stored in a columnar storage engine like ClickHouse. “That got our attention,” Javier says.
They signed up for ClickHouse Cloud and ran a proof of concept that Javier says never really stopped running. “We set up the cloud, we didn’t have to deal with Kubernetes operators or capacity planning,” he says. “Everything just ran.”
From metrics to wide events with ClickHouse
What followed was less a strategic pivot than a dawning realization. The team asked themselves: can we query a full day of trace data with ClickHouse? They could. Then they extended the window to two weeks. Then they started building the service overview dashboards they’d never been able to build before.
Each new capability unlocked a use case that hadn’t even been on the original list of requirements, and each new use case made the old mental model (logs, metrics, traces) feel a little more like scaffolding that could come down. Javier describes it as a “virtuous cycle, where the more we explored ClickHouse, the more we found use cases we hadn’t been considering, and those started to become requirements.”
The best example of this was cardinality. In the Prometheus world, cardinality is a constraint to be managed carefully and defensively. Labels are expensive. Teams are asked to drop dimensions they might need later because storing them isn’t worth the cost.
Javier had spent real time as a team lead policing this, telling engineers not to add certain labels, despite knowing that if an incident surfaced an unexpected question, the data to answer it might not exist. “You have an incident and you need to ask a question that you didn’t even know before to ask your system,” he says. “And the data isn't there.”
ClickHouse made cardinality cheap. For example, Qonto’s ResourceAttributes and SpanAttributes columns (every piece of metadata about every service, pod, cluster, library version, and deployment that produces a trace) store 231 TB of uncompressed data in 376 GB. That’s a 99.84% compression ratio on data that is high-cardinality almost by definition. The S3 storage savings alone come to an estimated $70,000 annually.
“And it’s not only cost savings,” Javier adds. “As an observability guy, cardinality was a scary word for us. Now it’s something I actively root for.” Today, when engineers ask if they should add more attributes to their spans, he doesn’t hesitate: “Yes, add everything,” he tells them. “It’s not going to cost you, the system can handle it, and then we’ll really be able to ask smart questions and get real answers.”
Qonto’s ClickHouse-based architecture
In the new setup, data flows from across Qonto’s stack (applications, frontend, Kubernetes infrastructure, GitHub) into OpenTelemetry collectors, which ship everything to ClickHouse Cloud over AWS PrivateLink. From the collector’s perspective, ClickHouse looks local, which eliminates the latency and transfer costs that come with moving large volumes of telemetry data across network boundaries. Grafana serves as the primary interface for dashboards and traditional observability workflows.
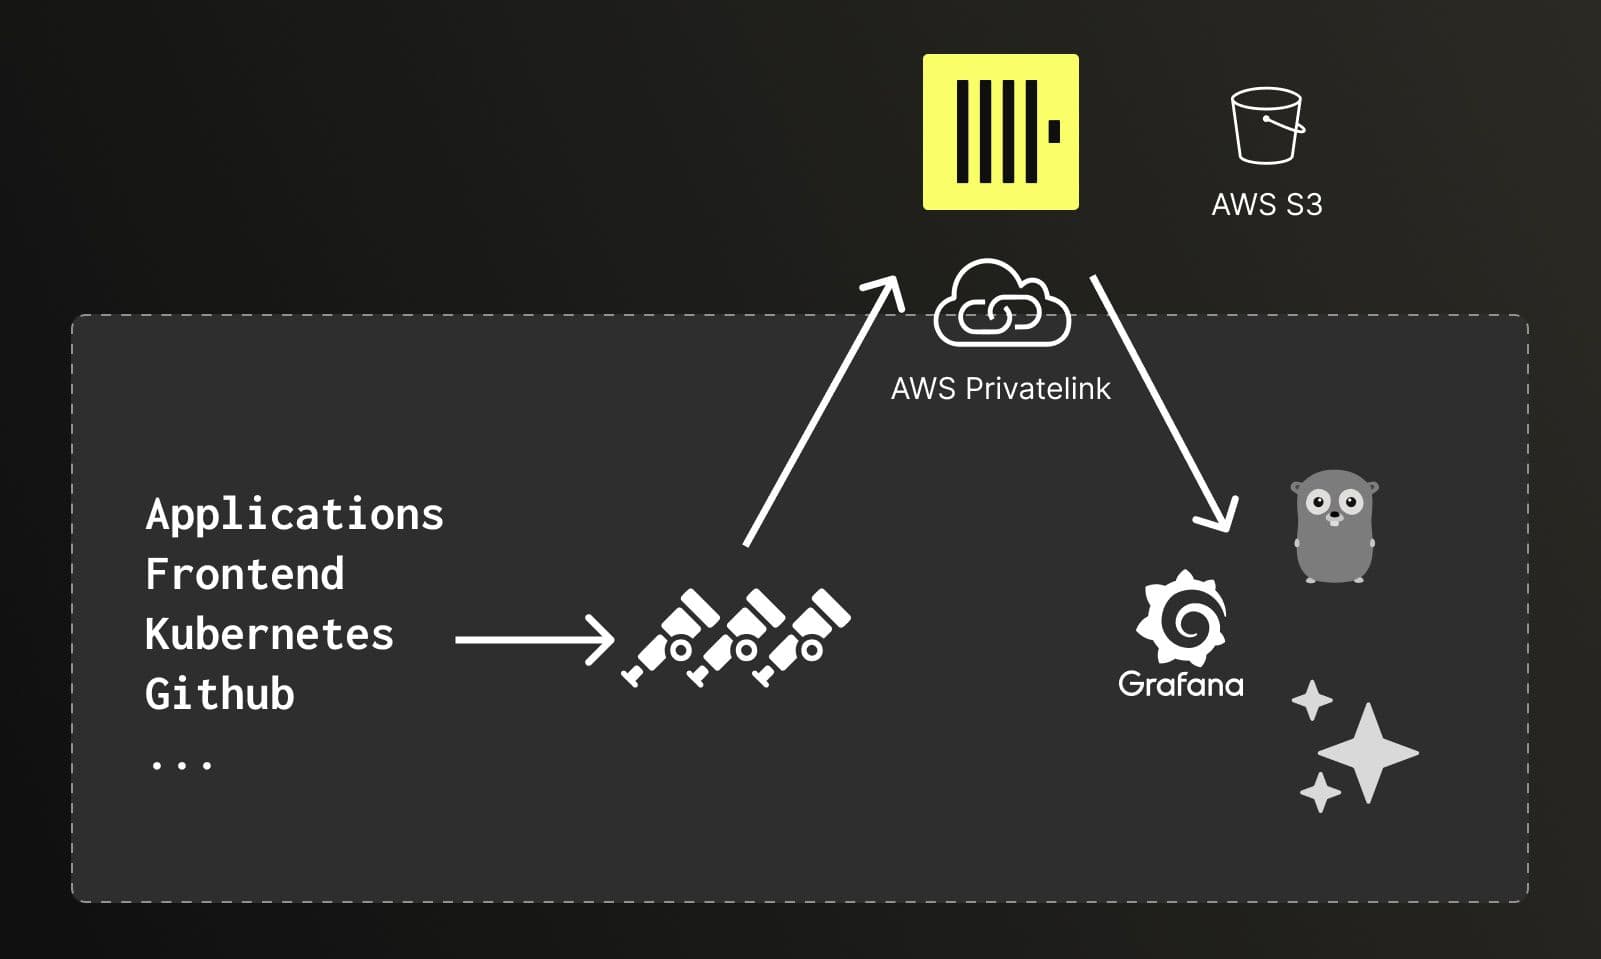
Data from applications, frontend, Kubernetes, and GitHub flows through OpenTelemetry collectors to ClickHouse Cloud over AWS PrivateLink, with Grafana handling dashboards and visualization.
If ClickHouse was the first ingredient in Qonto’s new observability recipe (the “engine,” as Javier describes it), OpenTelemetry was the second, providing the semantics. Because OTel is a widely adopted standard, its field names and structures are familiar to LLMs. This means engineers don’t need to spend tokens explaining the schema or maintaining a data dictionary for the AI to work with. The data is already legible.
AI-powered observability with ClickHouse MCP
With a database that could handle anything and a semantic layer AI understood, step three was building what Javier calls an “incident companion,” so anyone at Qonto can investigate an incident or ask a question in plain English and get a real, data-backed answer.
At its core is the ClickHouse MCP server, which Qonto uses with a thin security layer on top to enforce read-only access to specific instances, roughly 30 lines of Python. The MCP is accessed through different clients as Claude clients and conversational UIs. One example using Dust.tt shows a split view: natural language conversation on the left, and on the right, full transparency into what the agent is doing, including its reasoning, the SQL queries it’s running, and the results it’s working with. Engineers can inspect any query and take over if they want to. The agent always surfaces trace IDs so findings can be verified directly in Grafana.
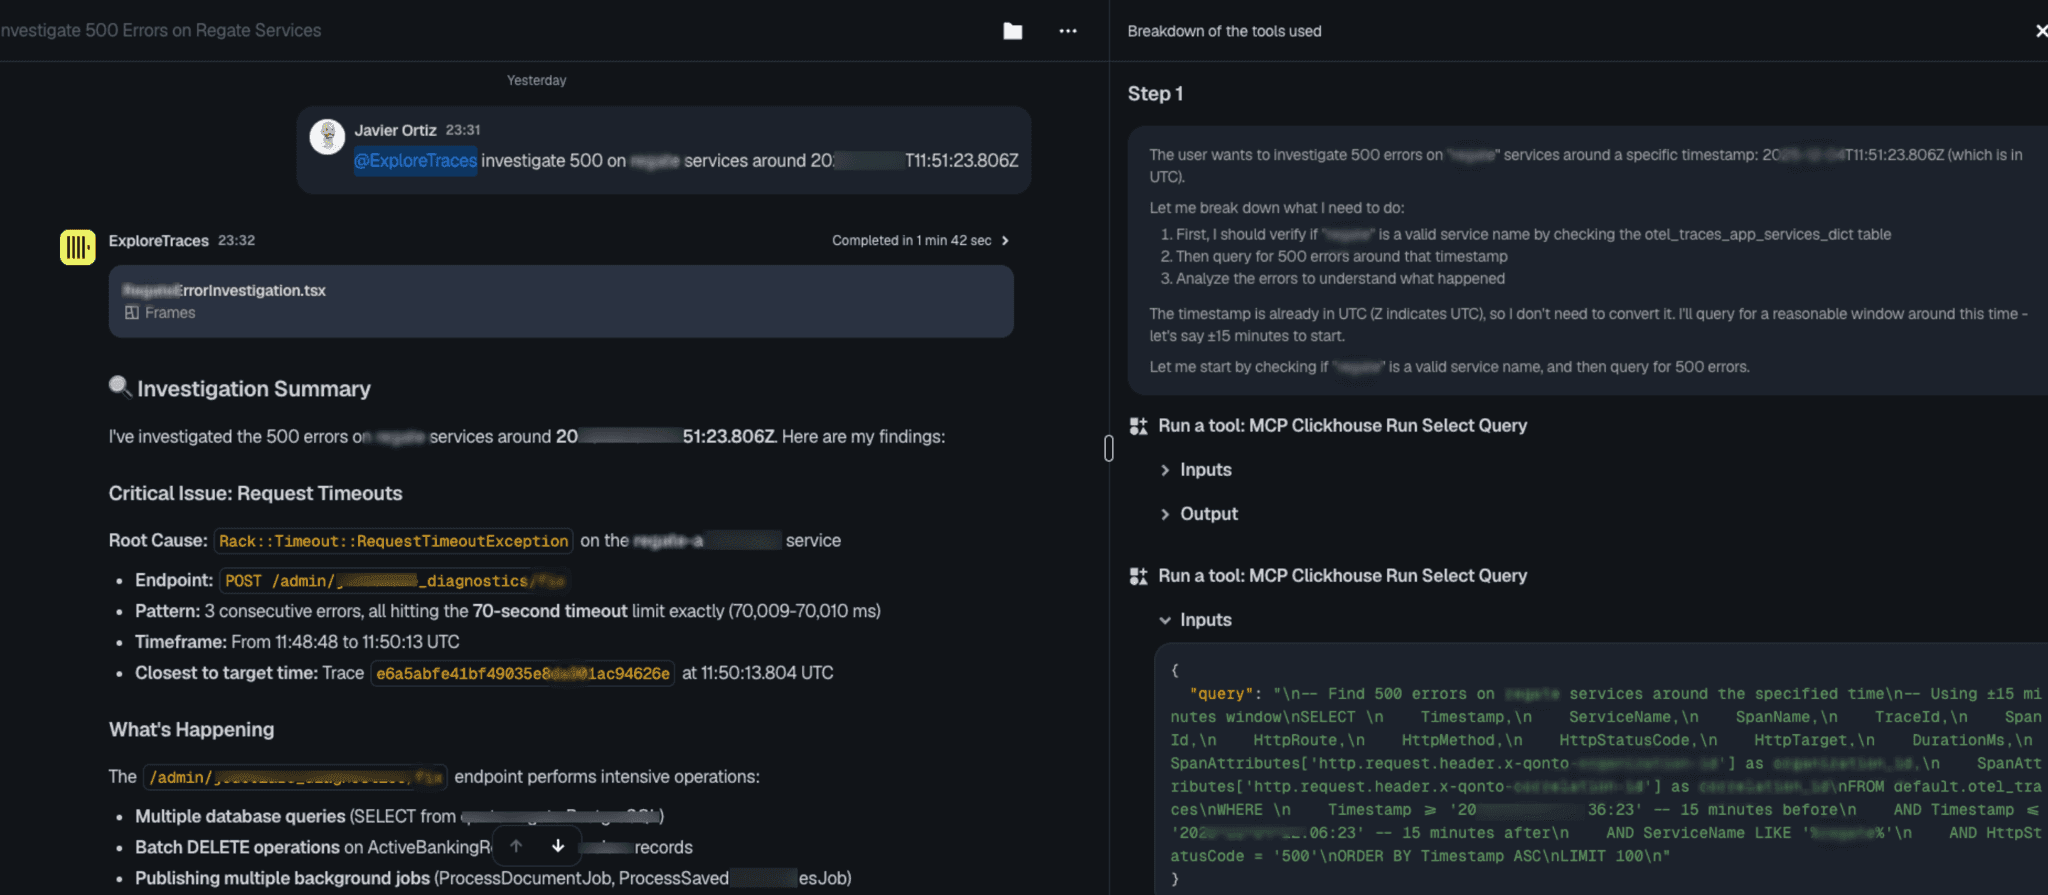
Qonto’s AI-powered incident companion in action, with a plain-language input on the left and agent reasoning and ClickHouse MCP queries on the right.
At the Paris meetup, Javier showed a real example of the system in action. In barely a minute and a half, the agent interpreted a brief natural-language input and timestamp, planned its approach, ran queries through the ClickHouse MCP server, and returned a structured investigation summary identifying request timeouts as the root cause.
Not only is incident response faster, the scoping process is far simpler. What used to require engineering effort and expertise (figuring out which customers were affected, which countries, which account types) is now a question anyone can type. Javier recalls a case where the team was able to identify exactly which customers were affected by an issue and send targeted communications to only those individuals, rather than a blanket notification to everyone. “You can see how this system enables you to build things that aren’t just about SRE,” he says.
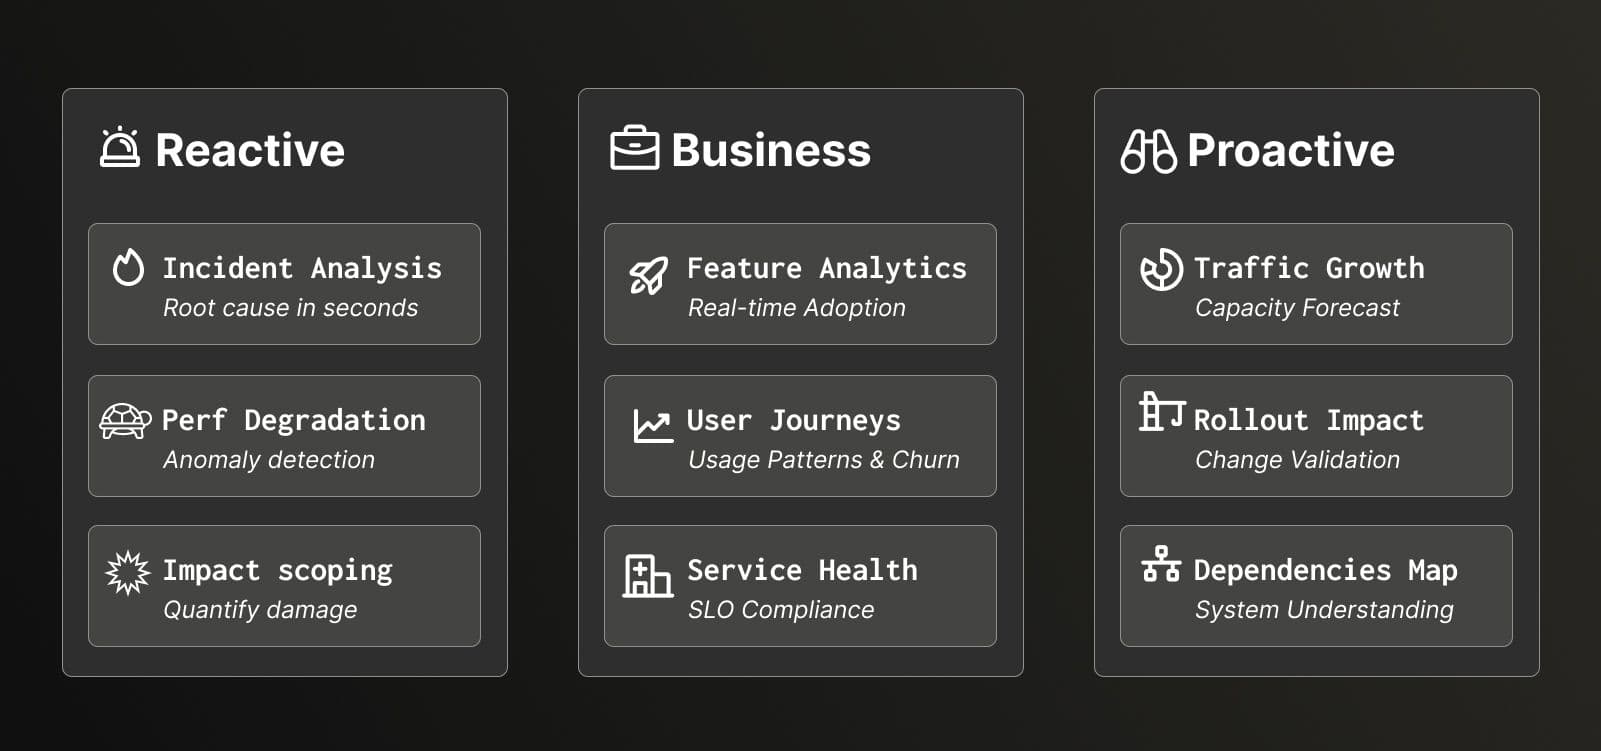
Some of the reactive, business, and proactive use cases powered by Qonto’s AI incident companion.
That democratization goal was explicit from the beginning. No one should need to be the engineer who built a component in order to investigate an incident involving it. “Anyone should be able to resolve any incident,” Javier says. For Qonto, the reality has exceeded even the original goal. Product teams are querying the same data to understand feature adoption and user behavior. Where the barrier used to be query syntax and schema knowledge, now it’s just about having a question worth asking.
What’s next for Qonto and ClickHouse
Qonto’s observability story isn’t finished, and for Javier, that’s exactly the point. “Everything’s a bit blurry now,” he says, “and that’s where we want to be.” Treating observability as a data problem has opened doors that the team is still walking through.
One ongoing development is a collaboration with Qonto’s data engineering team. Previously, the observability and data teams were siloed enough that the latter’s Apache Flink expertise never crossed over. But with observability data living in ClickHouse, the conversation became possible. The teams are now exploring real-time pre-aggregation pipelines, computing P95 metrics over rolling windows in Flink and feeding results back into ClickHouse. “Since your system is no longer ‘traces, metrics, logs,’ but just data, now we can use the expertise from our Data colleagues,” Javier says.
Qonto is also looking at consolidating its log storage (currently split between a lower-cost store and Elasticsearch) into ClickHouse, and experimenting with ClickStack, ClickHouse’s integrated observability stack. “ClickHouse is a very good playground, because we can just leave the doors open for everybody to test it out, whereas with our previous system, we needed to protect it, asking people not to do long or complex queries,” Javier says. “That changes the experience of learning completely.”
The throughline is simple: stop protecting the infrastructure and start building on top of it. Once the database stopped being a constraint, the team stopped being its custodians and started being its users, finding use cases they never would have put on a roadmap.
“The thing I’m most proud of is the decision to stop thinking about the three pillars and start thinking about wide events,” Javier says. “To do that, you need a technical foundation to support you and break the silos around observability. We were very lucky to find ClickHouse, and that AI was ready at exactly the same time.”
Get started today
Interested in seeing how ClickHouse works on your data? Get started with ClickHouse Cloud in minutes and receive $300 in free credits.
Sign up