50.4k
50.4k

TL;DR:
- We are releasing an open harness, data-agent-mnist, for benchmarking analytics agents so you can run against your own data warehouse.
- Against our data warehouse, Claude Fable 5.1 holds the top spot for correctness, scoring 76.6% across 201 questions.
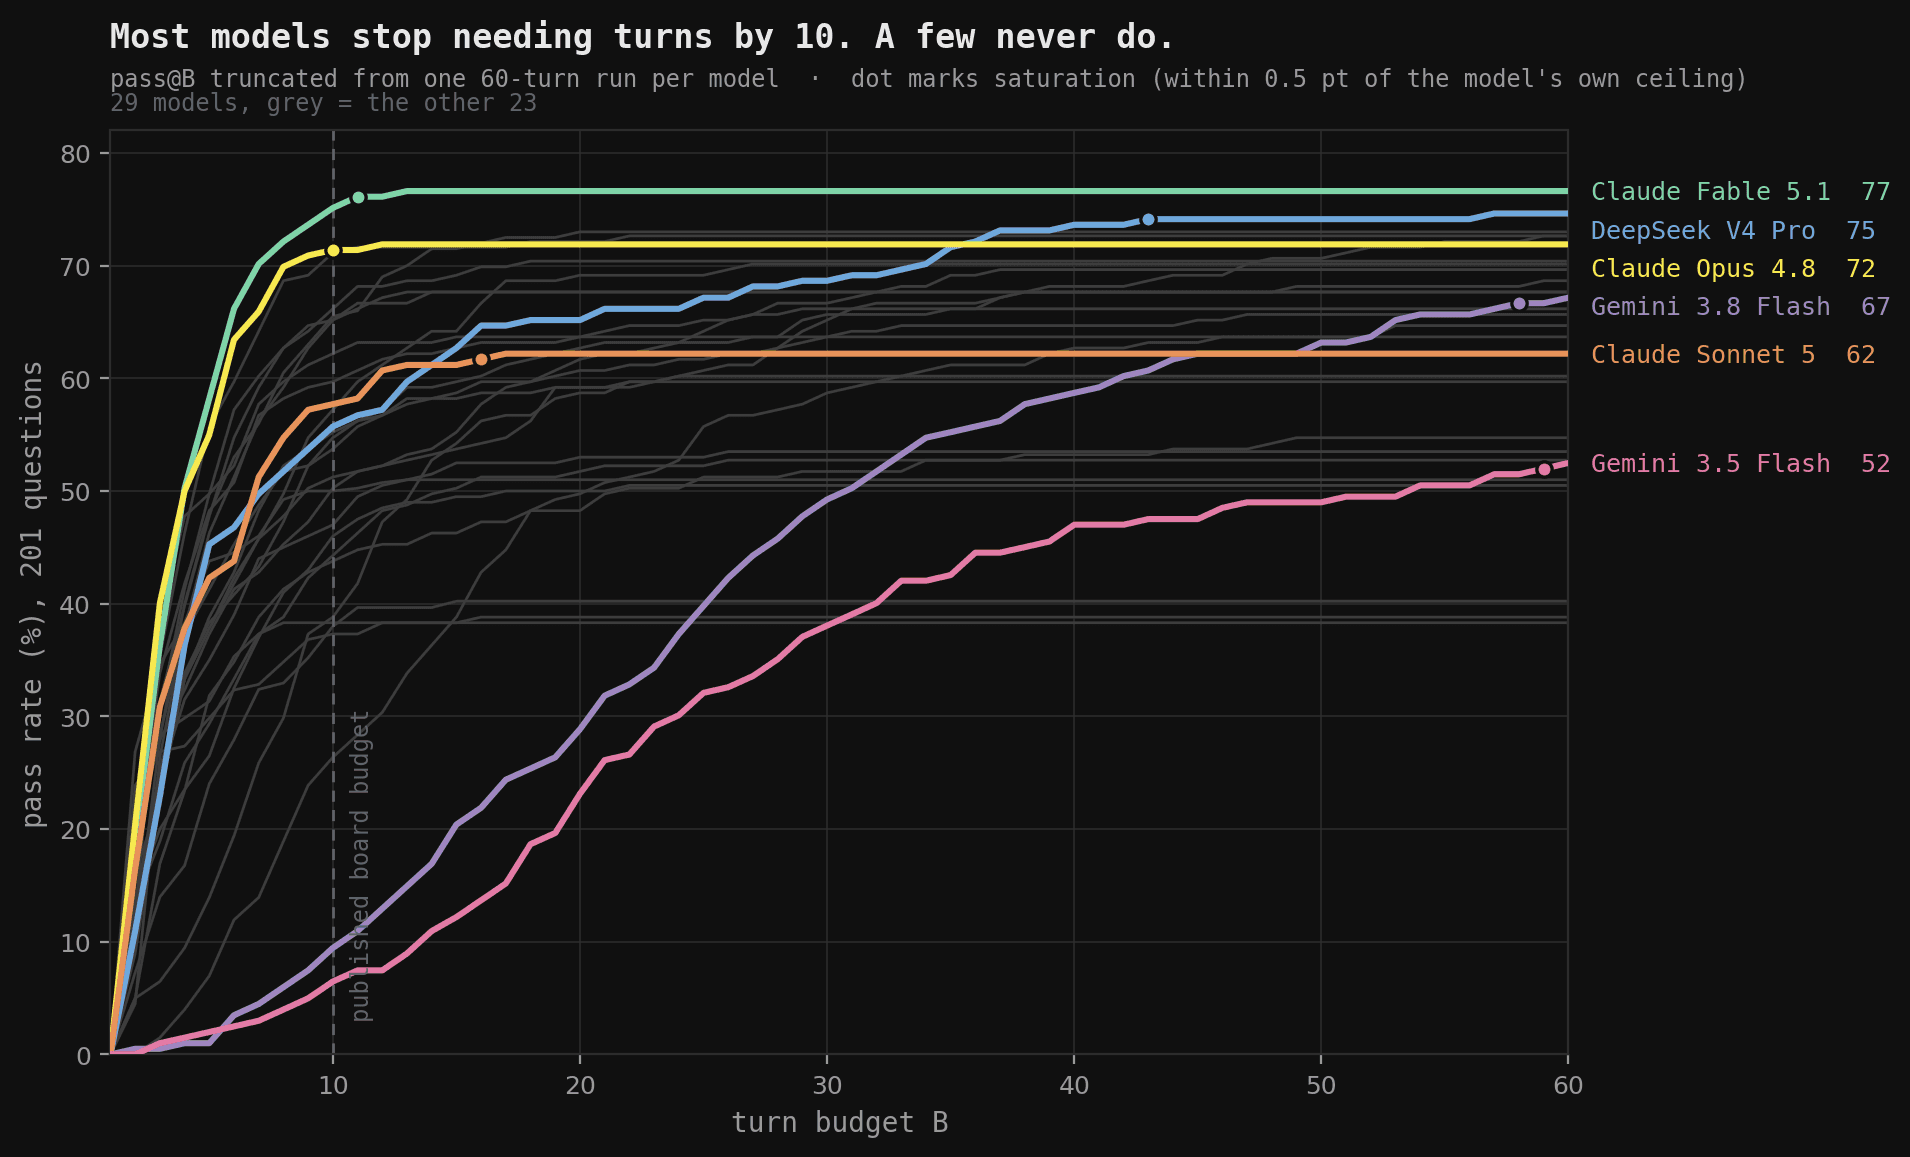
- Claude Fable 5.1 is 4 points more correct than Fable 5 at the same price per question, and it gets there in fewer turns, saturating at 11 against 18.
- Frontier-level models hold all top 10 positions, 5 of which are open-weight, when scored on correctness alone.
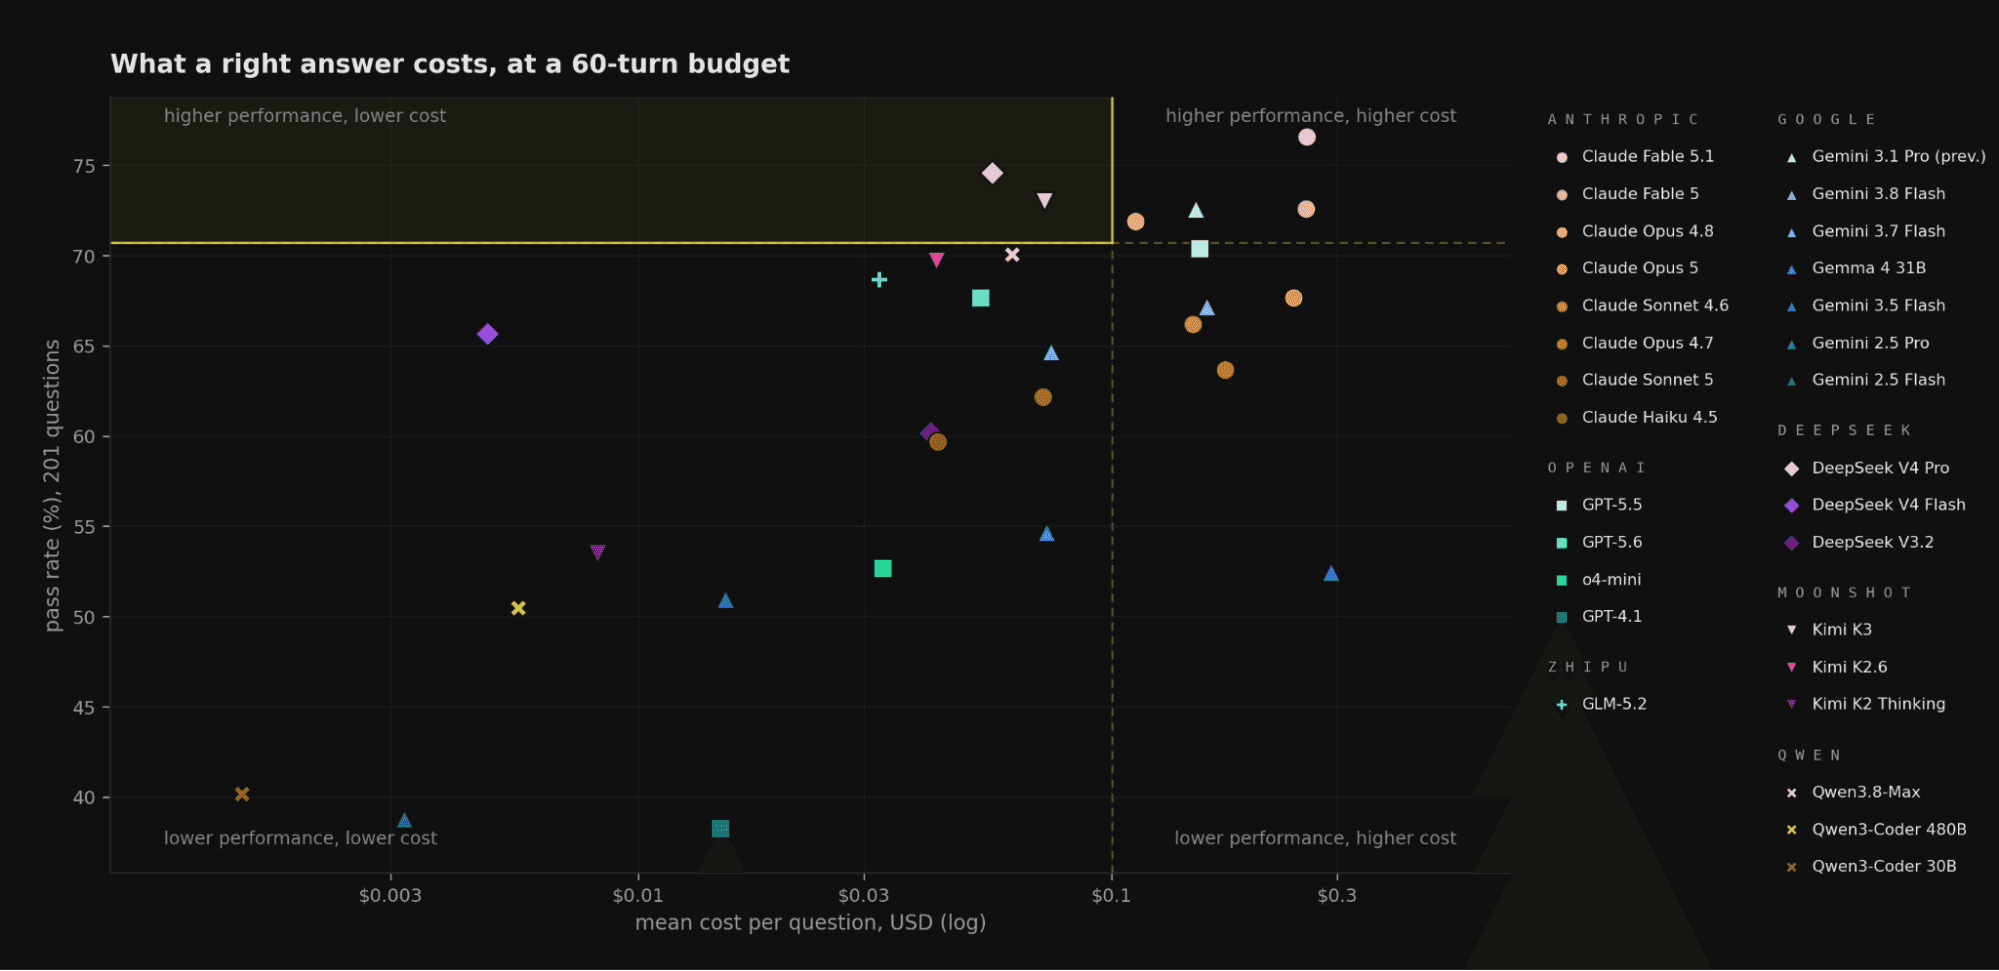
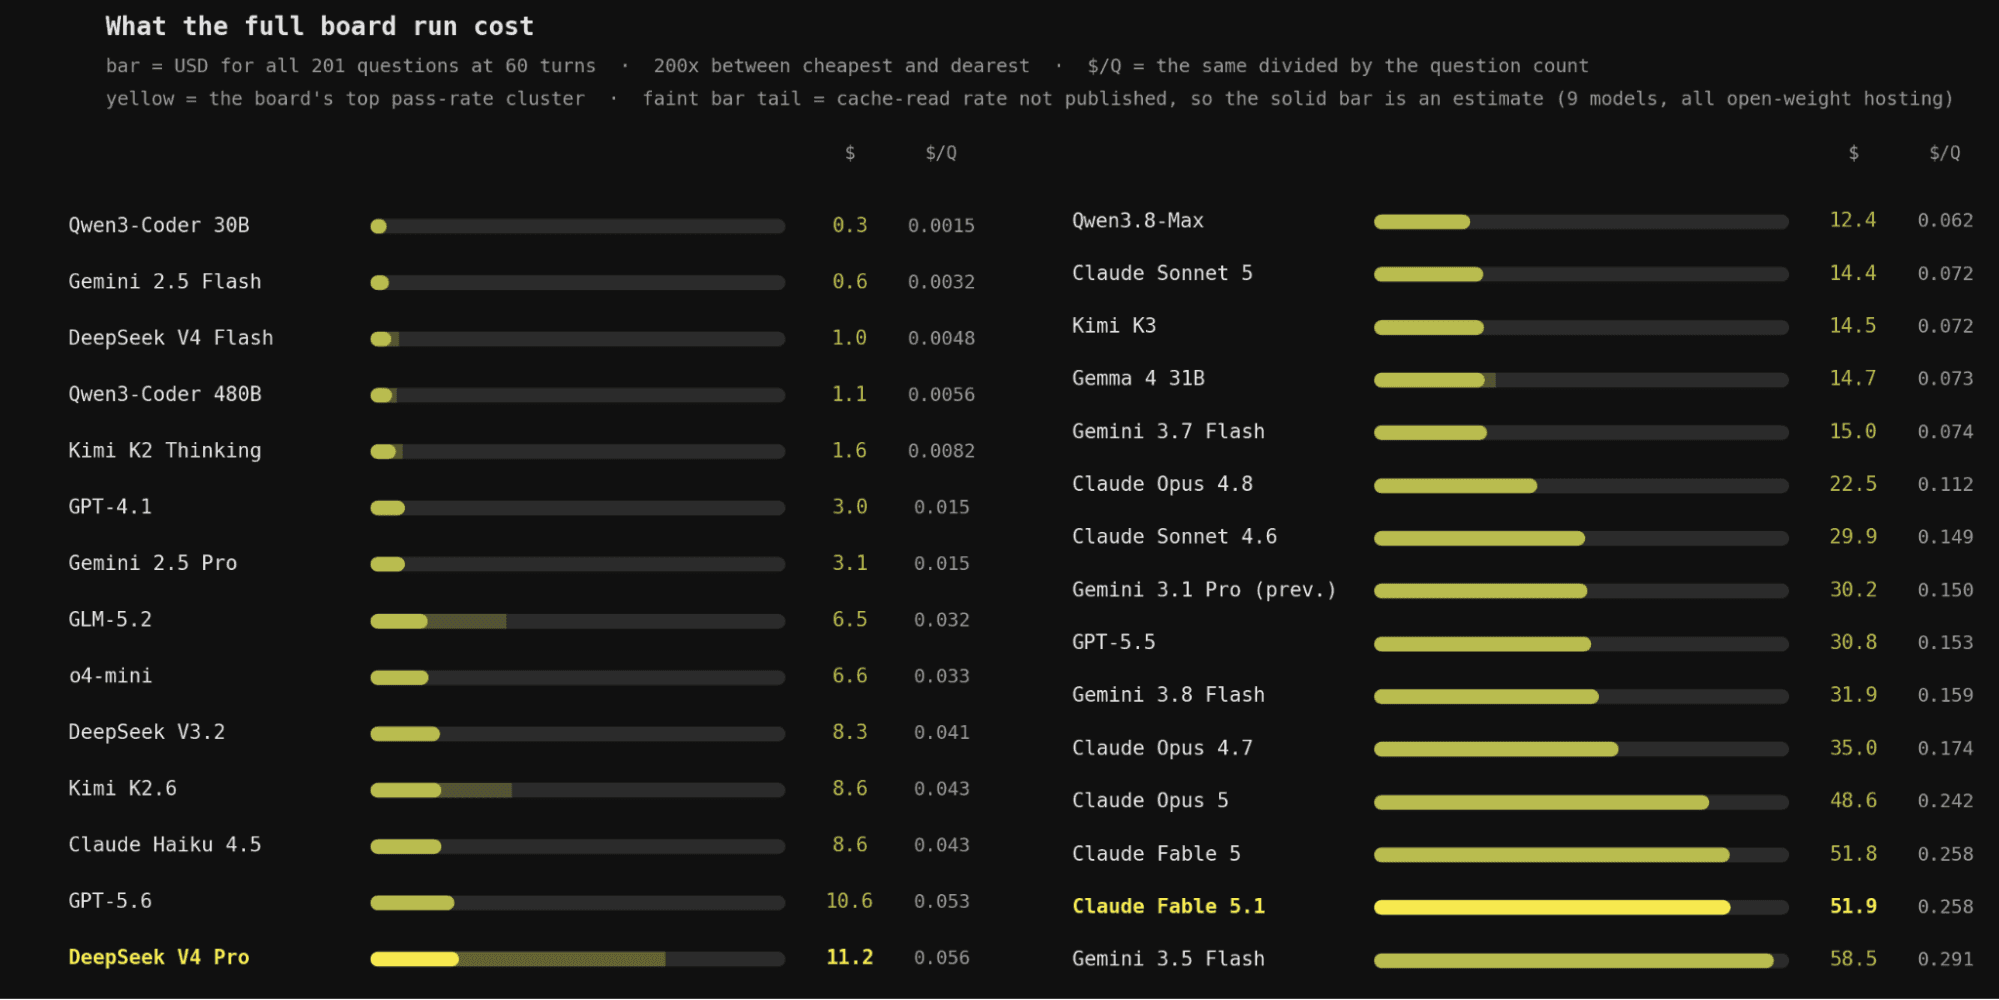
- Running our full 201-question benchmark costs $1 with DeepSeek v4 Flash vs. $52 with Fable 5, sacrificing only 6.9% in correctness.
We took 201 real analytics questions from the production traffic of DWAINE, ClickHouse’s internal analytics agent, and benchmarked 29 models spanning every vendor tier, proprietary and open-weights, against a synthetic-yet-truthful reconstruction of our data warehouse.
Prior work like Spider, Spider 2.0, WikiSQL, BIRD focus on measuring a model's ability to translate text to SQL. While useful, it only measures a small part of the problem. A text-to-SQL benchmark can generally proclaim a model as the overall winner, appropriate for anyone. But for agentic analytics, the criterion of the best model is a lot more context-dependent. We believe most recent models are generally more capable in this area.
While writing this post, Hex released DataBench, which aligns very closely with how we see agentic analytics. We highly recommend giving their post a read.
This benchmark aims to not just be a point-in-time snapshot of current model capabilities, but a framework that can be used to benchmark model performance against your own data warehouse, and assess which is appropriate for you.
This post explains how we built it, what we found, and how you can build the same thing from your own data warehouse traffic.
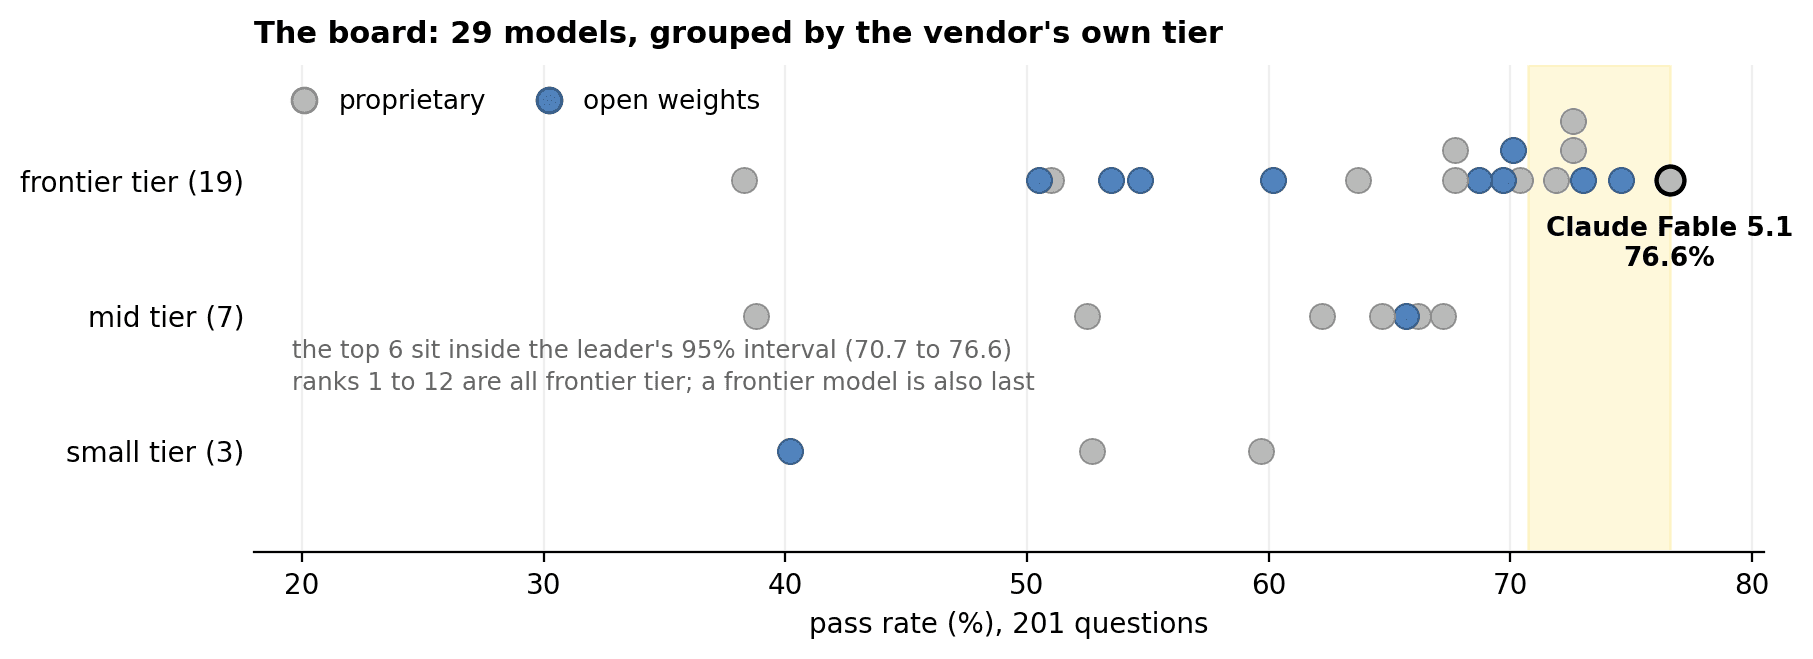
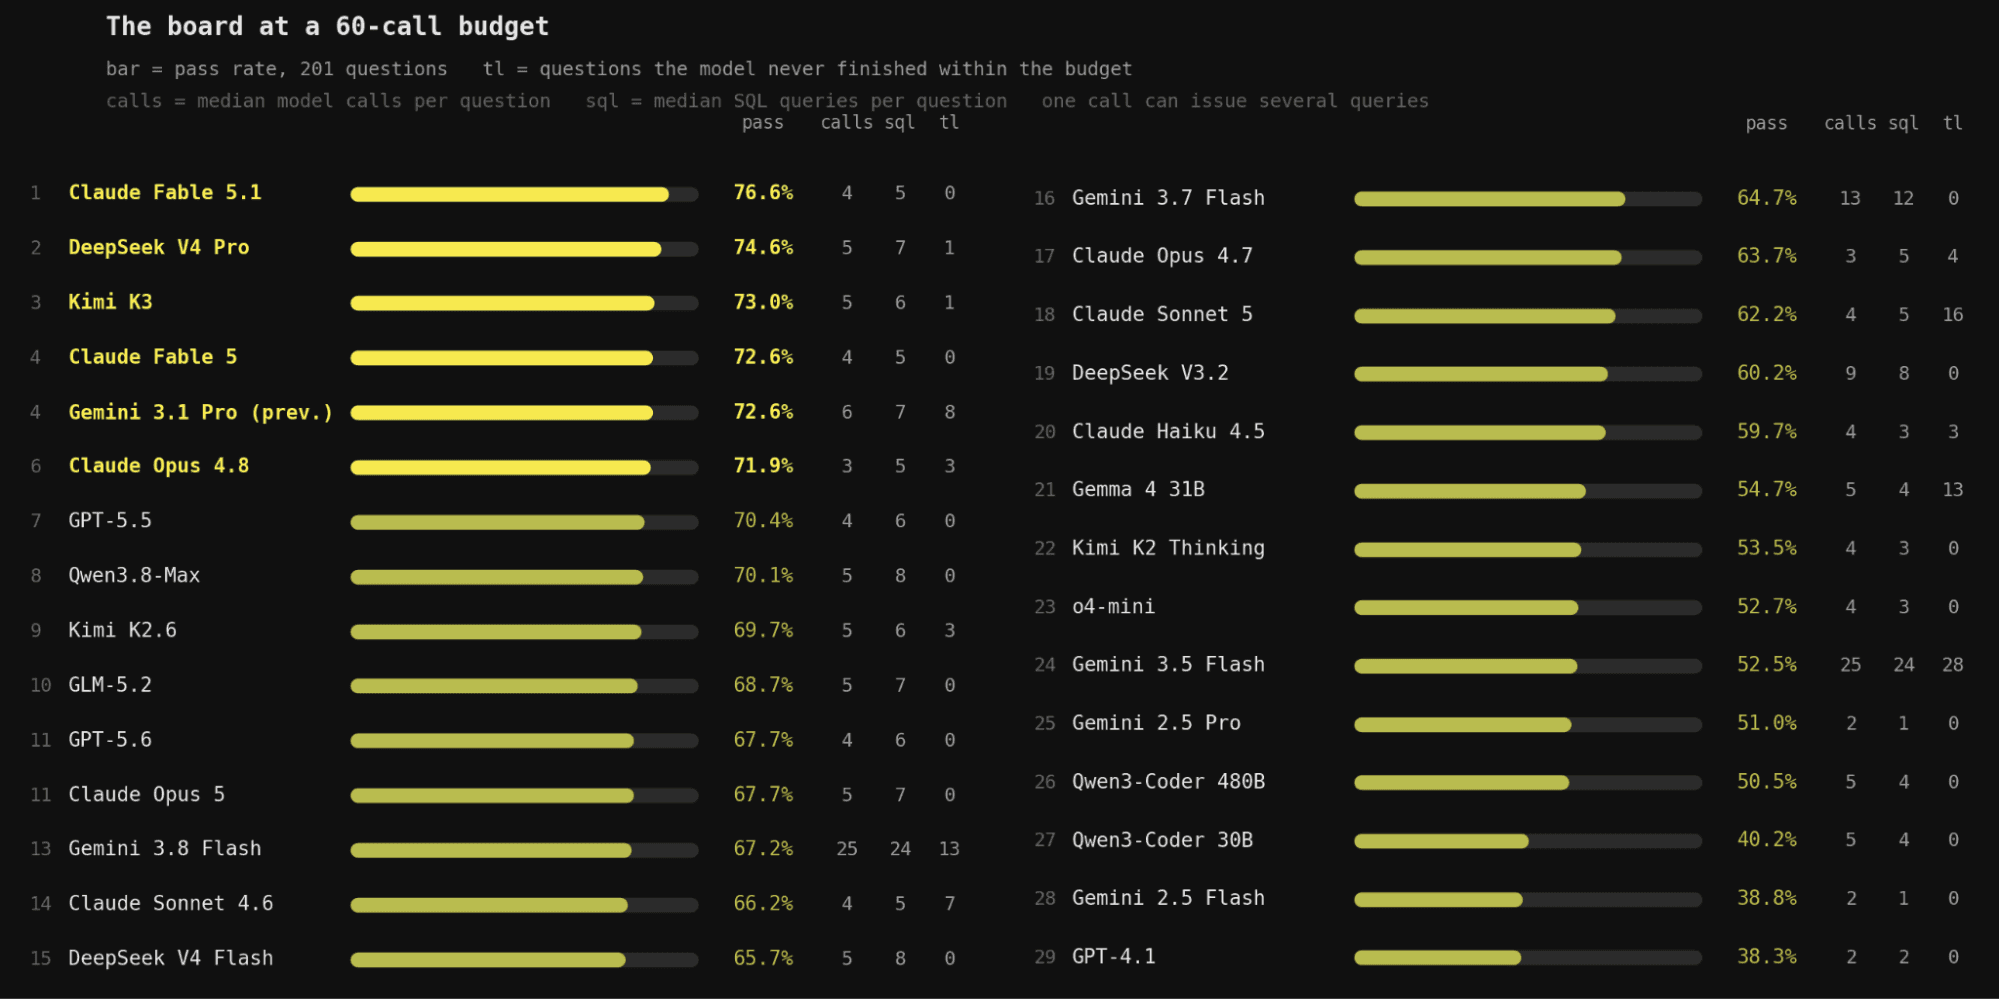
Pass Rate of all 29 models. No mid- or small-tier model reaches the top twelve, frontier tier alone does not guarantee it, and an open-weights model comes second, two points behind the leader.
Agentic analytics vs. text-to-SQL
Text-to-SQL is the translation of a natural-language question into a single SQL query, given the schema. It is one of the most heavily benchmarked tasks in NLP, and a decade of those benchmarks rests on four shared assumptions:
- the schema is handed to it up front
- the model gets one shot
- there is a single gold query
- scoring is an execution match against that gold query
However, agentic analytics drastically challenge the assumptions here in real world use cases. The agent must still turn a natural-language question into SQL, but the other three assumptions go: it discovers the schema itself, it takes as many turns as it needs, and there is no gold query to match, because the answer is the result set the annotators agreed on.
Agents are able to explore and discover schemas on their own, build a plan, and run multiple queries to formulate an answer. This style of agentic analytics is now in production in many data platforms, including ClickHouse Cloud, and simple text-to-SQL is no longer representative of real work.
Benchmarking this loop tests some of the more opaque qualities of LLMs and needs a purpose-built benchmark. Here are the three requirements we had when designing the benchmark:
- Personalised: There is no single, best model for everyone. The benchmark should support any company using their own questions, their own data and data warehouse.
- Schema-aware: The difficulty lives in the size and multi-hop join structure of a real data warehouse, not in a compact hand-built schema. A benchmark that abstracts the schema away measures the wrong thing.
- Replayable: To compare models fairly, the same questions must run against the same warehouse state on demand, which a live production system cannot guarantee.
Methodology
The shape of a production-grade data warehouse
Enterprise data warehouses are rarely a pile of raw tables. Different organisations follow different patterns, use different tools and the level of complexity varies. That’s one reason why we think it’s important to be able to run the benchmark yourself.
We’ll walk through the structure of our data warehouse as an example.
Our raw tables are modeled with dbt into curated layers.
The mart layer (dbt_marts_general) covers product usage and billing: flat, denormalized tables with one row per entity or entity-period, the JOINs already done, and columns curated. A typical question against it is a filter and an aggregation on a single table. For the benchmark, this layer has 235k rows, 144k of them in usage_history.
The dimensional layer (dbt_dds) is sourced from Salesforce and covers the CRM side: accounts, opportunities, leads, contacts, support cases, all in a classic star-schema, entities in dim_* tables, events in fct_* tables. Answering a question using dbt_dds tables requires a multi-hop entity-resolution join: resolve a name to an organization, join to its account by key, and from there to opportunities, cases, or services. dbt_dds has many more tables and columns (746 of the 865 columns) and introduces the difficulty of finding and joining the right tables.
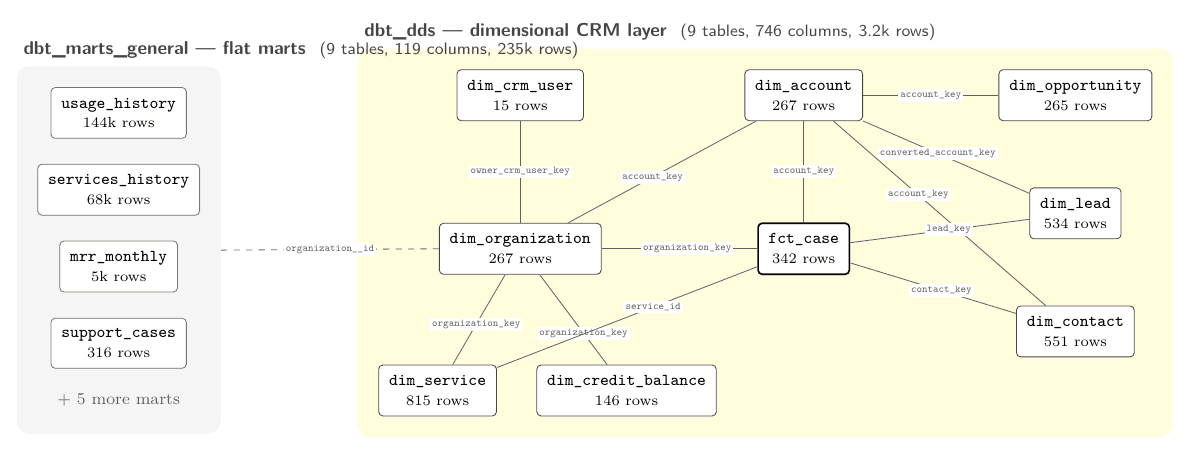
The synthetic data warehouse: flat marts on the left, the dbt_dds dimensional CRM layer on the right, connected only by the organization identifier.
Building the synthetic data warehouse for the benchmark
DWAINE (Data Warehouse AI Natural Expert) is our internal analytics assistant. Employees ask business questions in natural language and it answers by querying our data warehouse. On a typical weekday, it handles around 100 messages across 30 to 60 conversations, from a few dozen distinct users.
DWAINE is instrumented with Langfuse and we log every interaction: the users’ questions, the SQL the agent ran, the result sets, the final answers. From that, we get a range of real analytics questions at production complexity.
However, the data warehouse and questions contain sensitive data, like customer names and billing figures, so it can never be released as is.
To ensure privacy, we construct a synthetic data warehouse.
This is a reconstruction of the data warehouse where all entities remain internally-consistent, but anonymous. No real names or figures remain, but relationships and scales are true. Questions are also updated to match the new entities.
With this, we can satisfy the requirements above:
- Personalised: the data and questions represent the real world for our business
- Schema-aware: the reconstruction keeps the real schema's structure (in our case: 18 tables and 865 columns across two dbt-style layers)
- Replayable: deterministic seeding means every evaluation runs against the identical warehouse, from a single command.
The construction of this synthetic warehouse is a core part of the benchmark harness. It is intended to be reusable by anyone, so you can apply it to your own questions and warehouse.
Curation, anonymization and seeding
None of the raw questions from DWAINE can become a benchmark item as is. We pass every candidate through three gates:
-
Curation drops traces that are not questions at all: pasted transcripts, HTML dumps, bulk entity rosters. It then drops questions that only make sense in context, using a zero-shot classifier to separate self-contained questions from ones leaning on an earlier turn ("what about those customers?").
-
Anonymization replaces structured PII (emails, Salesforce IDs, UUIDs, cloud account identifiers, internal URLs, etc.) with deterministic Faker values. Free-text names have no reliable structure, so we pose them as a zero-shot extraction task, biased deliberately toward over-extraction, and scrub the result against a curated backstop list. Billing figures are scaled by per-question factors that preserve ratios.
-
Verification re-scans every anonymized question and hard-fails the build if any real structured token survives. A leak cannot pass silently.
Importantly, anonymized questions still name specific entities (e.g., organization, account ID, email domain). Each question’s referent must exist in the synthetic data warehouse, otherwise the question is unanswerable, yet must not be conspicuous (or finding it is trivial). So we seed by a needle-in-a-haystack construction: plant every entity the questions reference under exactly the identifiers the question uses, then bury the needles in a realistic synthetic population, twelve cloud regions, ten industries, tier-conditioned revenue with eighteen months of daily history, drift, noise, and usage spikes.
From an initial 501 candidates, we end up with 475 after the curation step. A schema-compatibility gate (is the question answerable from the reconstructed schema alone?) brings this down to 243. The ground-truth committee (described in the next section) cuts it to 204. Finally, a legal review removed three more, leaving the 201 questions we will evaluate.
Where does the answer come from?
Measuring whether an answer is right requires knowing the right answer, and data-agent-mnist starts without knowing it.
The questions used are from real traffic, and they do not come with a validated answer attached. Instead, three models from three different providers (Claude Opus 4.8, GPT-5.5, Gemini 2.5 Pro) each solve every question independently, running the same full agentic loop against the warehouse. If at least two arrive at the same result by independent paths, that result becomes the ground truth. If all three models end up with different answers, the question is dropped as not reliably answerable (noted in the previous section, committee disagreement resulted in 39 questions being dropped from our set).
However, agreement is not verification, and we have to recognise that this isn’t a perfect solution. Two models can be wrong the same way. Provider diversity reduces that, but doesn’t remove it, since all three share training data and reasoning habits. Just over half our ground truth is unanimous at 51.7%, the rest pass with a two-to-one majority. We do not know how often the committee agrees on something wrong.
It is a future goal for us to have human-audited answers for all of our questions, and support doing so in the benchmark harness for others who want to do the same.
We also recognise that two answers can agree but not be identical in form. One answer might name a column total_dollar_usage, the other monthly_spend, for example. A column-linking step provides a mapping that judges can use to ensure equivalence (column linking, row alignment, numeric tolerance). This proved vital, as 84.9% of scored result sets in our test match only through the linked mapping.
Addressing bias with LLM-as-a-jury
Rather than a single LLM-as-judge, every candidate answer is scored by a three-seat LLM-as-jury panel. One seat each to Anthropic, OpenAI, Google, and the panel excludes the candidate’s own model family, so nothing scores itself.
Majority vote decides; a three-way split scores as a tie. The same column-linked equivalence check runs on the candidate’s result sets against the ground truth, and its verdict is passed to the judge as an authoritative data signal alongside the model’s written conclusion.
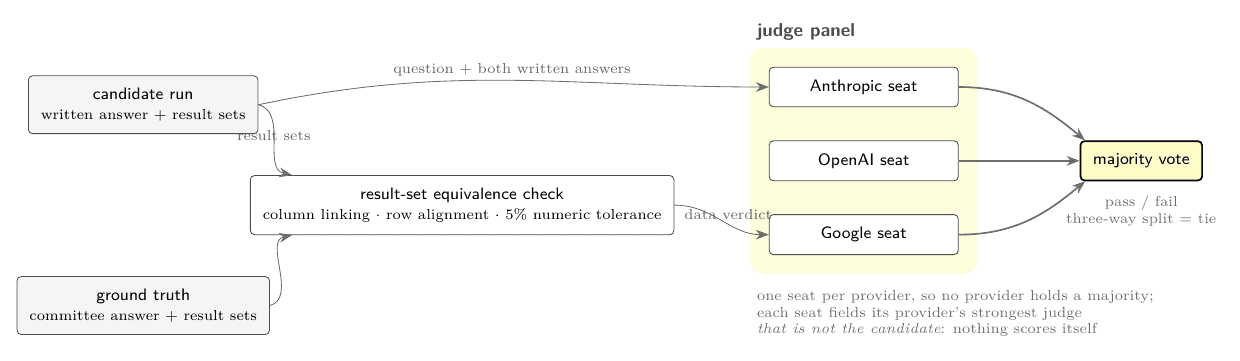
How is a candidate answer scored? The column-linked equivalence check compares result sets against the ground truth, and its verdict reaches the panel as a data signal alongside the written answers; each seat fields its provider’s strongest judge that is not the candidate, and majority vote decides.
Measuring bias in LLM jurors
A fair question is whether one provider’s models might have positive bias towards their own answers. We audited this by comparing the favourable-vote rate of each provider in our panel against answers from a range of different providers.
What we note is that providers tend to differ in their leniency, but don’t show much overall bias. Across the board, OpenAI judges more favourably, while Google is the harshest judge.
Centering each seat on its own mean and comparing its vote on its own family against the other seats’ votes on that same family, the in-group residuals are +0.9, 0, and +1.2 points. No seat over-credits its own family enough to swing a majority vote. The panel is lenient, not partisan.
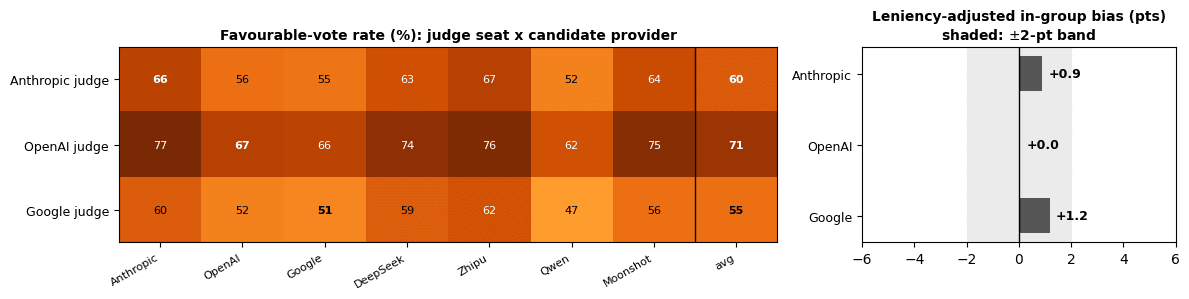
Left: favorable-vote rate by judge seat and candidate provider (last column: the seat’s overall leniency). Right: leniency-adjusted in-group residual per seat; the shaded band is ±2 points. Leniency varies far more than in-group bias.
Measuring contamination
Benchmarks like Spider and WikiSQL have been public with gold SQL since 2018, and they are demonstrably in training sets (we measure exactly that, below). Spider 2.0 also inherits the same contamination pressure as its predecessors.
Frontier models can complete the question from these text-to-SQL benchmarks from memory. Show one the first 60% of a question from Spider and the strongest memorizer completes it at 0.92 word-level similarity, nearly word for word. This presents a challenge: over time, these benchmarks stop testing generalisation and start measuring memorisation.
To test for memorisation of Data Agent MNIST, we probe all 29 models with three instruments:
-
Completion probe. Show the model the first 60% of a benchmark question, name the dataset, and ask it to complete the question exactly. Word-level similarity between the generation and the true continuation measures memorization.
-
Entity-recovery probe. The warehouse’s entities are random Faker draws with no world-knowledge prior, so asking for a named organization’s ID can’t be answered from memory. On a public benchmark, a competent model can answer probe questions from memory.
-
Positive control. A null result is only meaningful if the instrument detects contamination where it exists, so the identical completion probe runs over Spider, public with gold SQL since 2018 and demonstrably memorized.
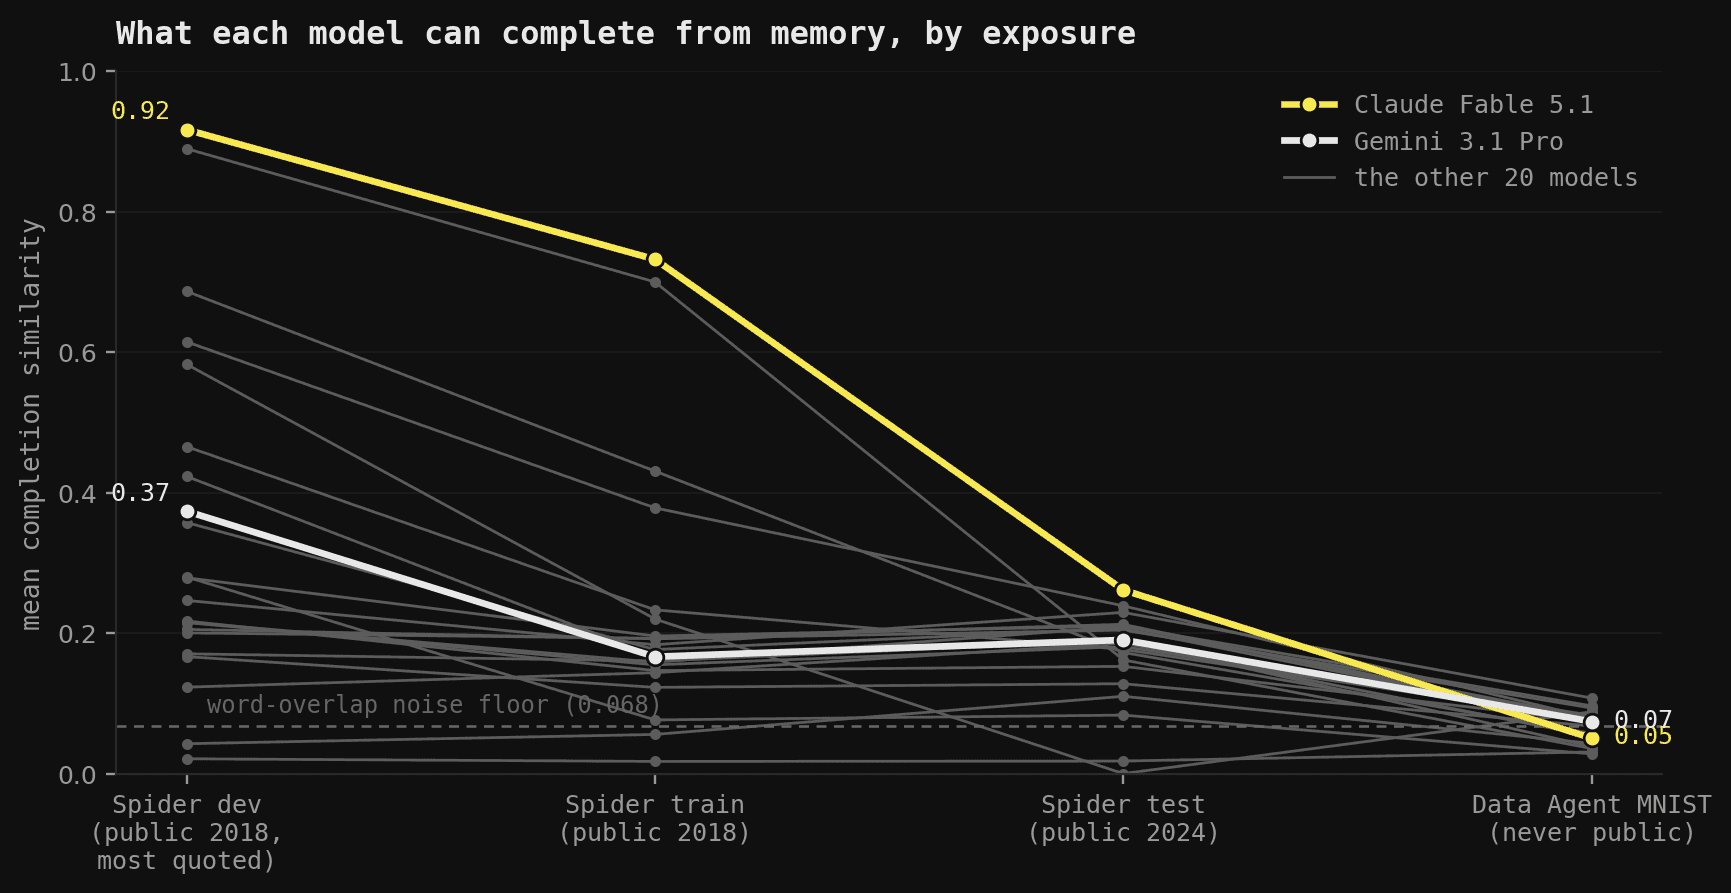
The exposure gradient: mean completion similarity per model on the three Spider splits and on Data Agent MNIST questions, ordered by how long each has been public. Whatever a model memorized of Spider, the gradient collapses on Data Agent MNIST, where nothing separates the heaviest memorizers from the rest. Entity recovery returned zero exact matches in 670 attempts across 27 models.
The questions, answers and data for Data Agent MNIST are not public. Every model lands in the same narrow band on our questions (22 models between 0.03 and 0.11 mean similarity, fleet mean 0.068; a single one of 1,100 completions reaches 0.5 similarity), and entity recovery is zero across every model tested and every item: not one of the warehouse's organization identifiers was ever produced in 670 attempts.
On Spider dev, the most-quoted public split, the strongest memorizer scores 0.92, and the exposure gradient is clean within a single model (the board leader, which is also that strongest memorizer, scores 0.92 on Spider dev, 0.73 on Spider train, 0.26 on the test split that was only released in 2024, and 0.05 on Data Agent MNIST).
We also embed a canary string in our private test set as another possible way to detect if the benchmark ends up in a training corpus. And, because the benchmark is built as a re-usable harness rather than a static entity, we can mint a fresh, non-contaminated instance from new traffic at any time.
Results
At the time of writing, 29 models were included in the benchmark. All 29 models run with an identical agent harness, prompt and warehouse.
We rank across 4 dimensions:
- Pass rate: the percentage of questions answered correctly
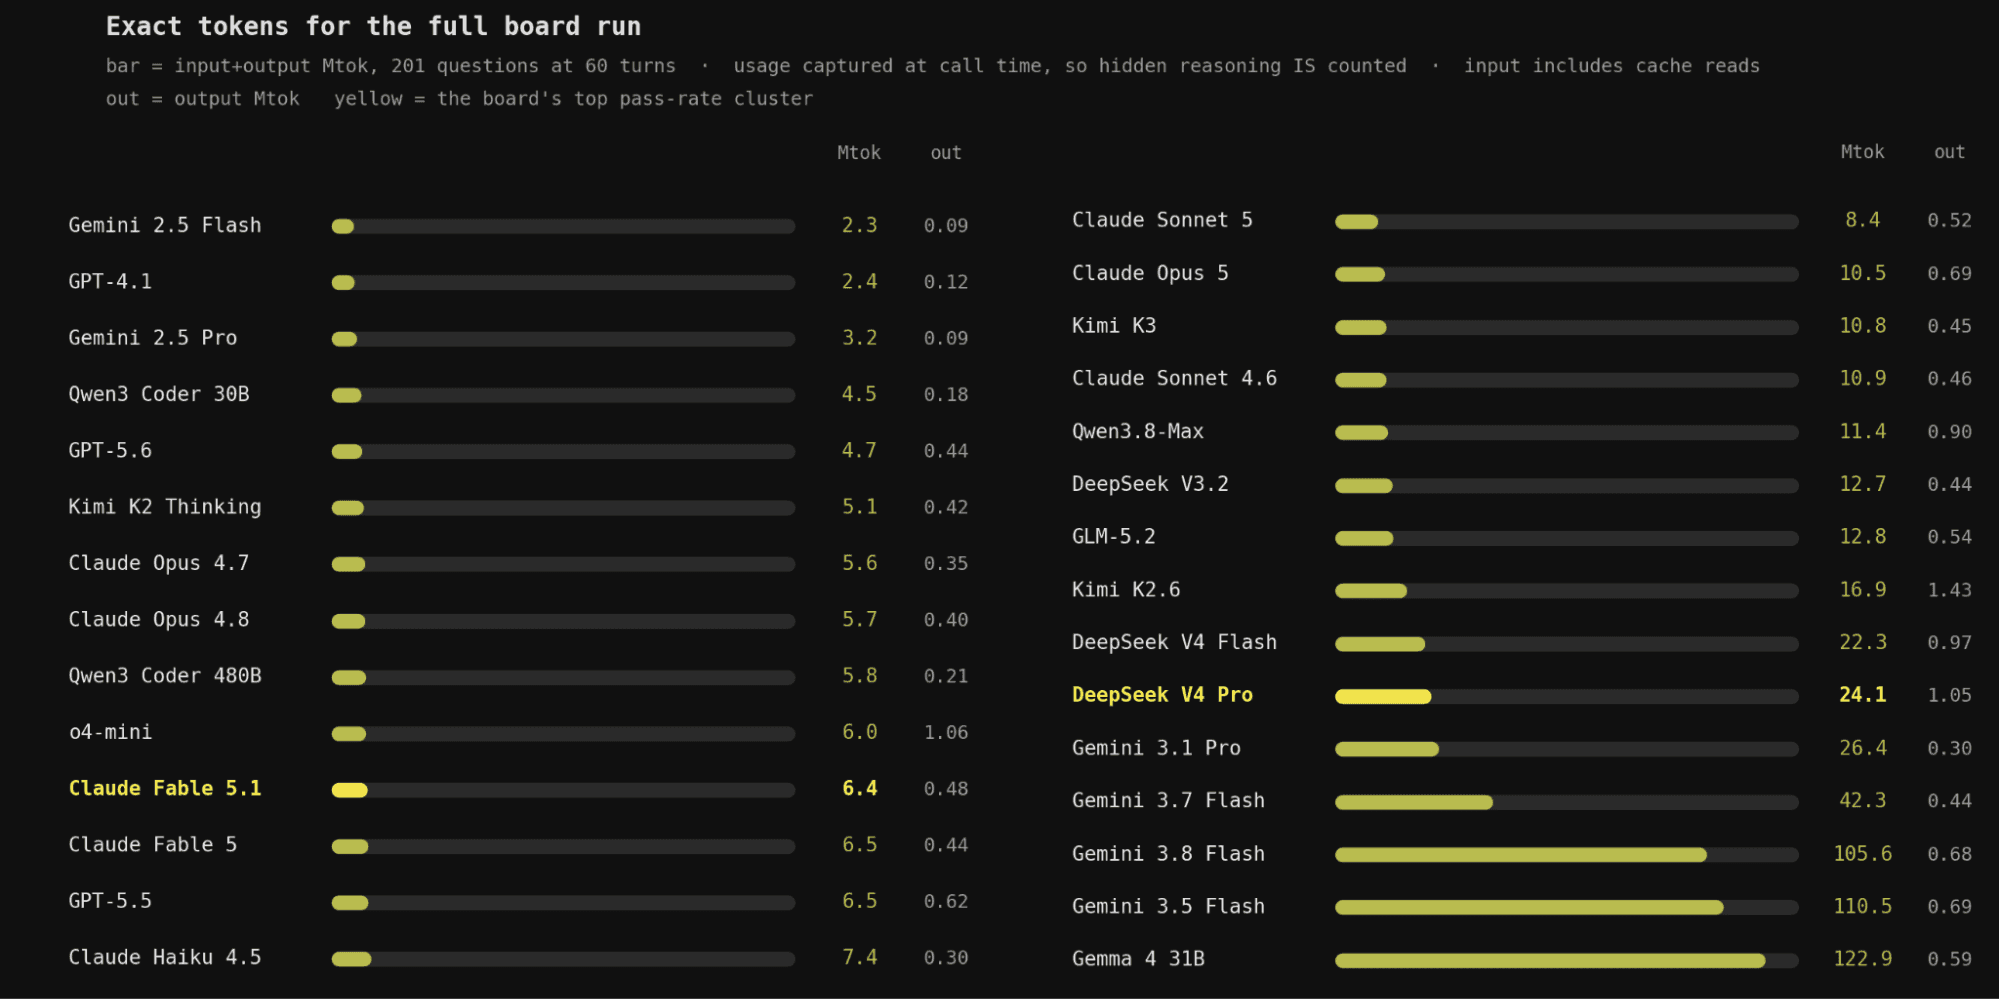
- Tokens/cost: the total combined input and output tokens used (+ estimated USD cost at current public API pricing)
- Wall-clock time: median time (in seconds) from prompt to answer
Pass rate
In the figure below, models are ranked by their pass rate.
Turn budget
In the figure below, each model's pass rate is traced against the turn budget it is allowed. The curves come from a single 60-turn run per model, truncated at every budget, so all 29 models are measured against one run rather than one run per budget. The dot marks the first budget within 0.5 points of a model's own ceiling, and the dashed line marks a 10-turn budget for reference.
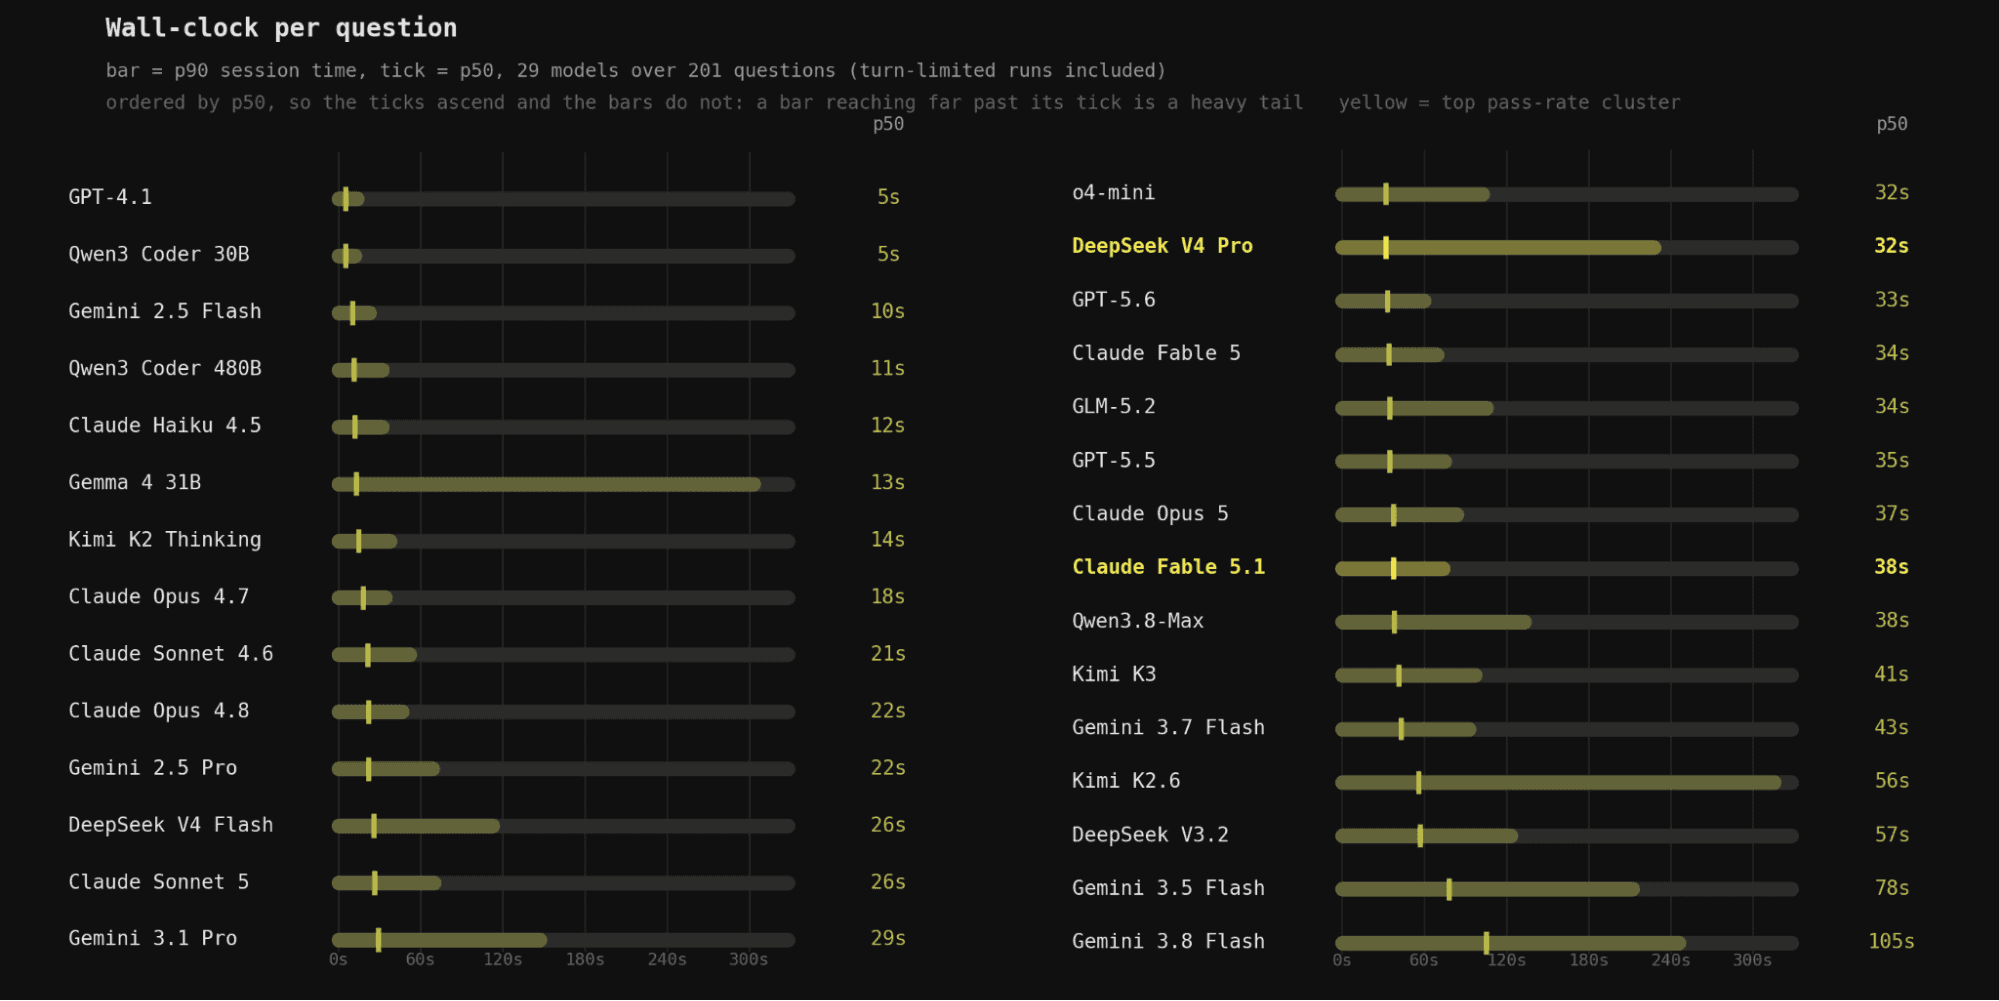
It is interesting to observe that Claude Fable 5.1 and Claude Opus 4.8 reach their ceiling at turns 11 and 10. Claude Fable 5.1 sits at 75.1 of its eventual 76.6 by turn 10, and Claude Opus 4.8 at 71.4 of 71.9. Claude Fable 5 saturates only at 18, so turn efficiency varies inside a single family and is not a property of the provider. An interesting case is DeepSeek V4 Pro which scores 55.7 at 10 turns and 74.6 by 43, passing Opus 4.8 at budget 36. The extreme is Gemini 3.8 Flash, the newest model here, at 9.5 by 10 turns and 67.2 by 60. That 57.7-point gain is the largest on the board, and it buys it with the slowest answers here at 105 seconds per question. Gemini 3.5 Flash goes from 6.5 to 52.5 and only reaches that at 59, so this run does not establish its ceiling. This demonstrates that different models offer different turn budget, token cost and pass rate profiles.
Tokens & cost
In the figure below, models are ranked by their token usage.
In the figure below, models are ranked by their cost (based on public API pricing direct from model providers, as of August 2026).
Wall-clock time
In the figure below, models are ranked by their median wall-clock time per answer. The tick marks the median and the bar runs out to the p90, so a bar reaching far past its tick is a model with a heavy tail.
Finding the tables matters more than joining them
Of 201 questions, 83 need the dimensional CRM layer (dbt_dds). Answering those requires discovering the right tables and resolving a multi-hop join, so we expected this to be where the board separated. It mostly isn't.
In the figure below, models are ordered by their overall pass rate. The yellow bar shows the pass rate for the 83 dimensional CRM layer (dbt_dds) questions. The grey bar shows their pass rate on the other questions (non-dbt_dds).
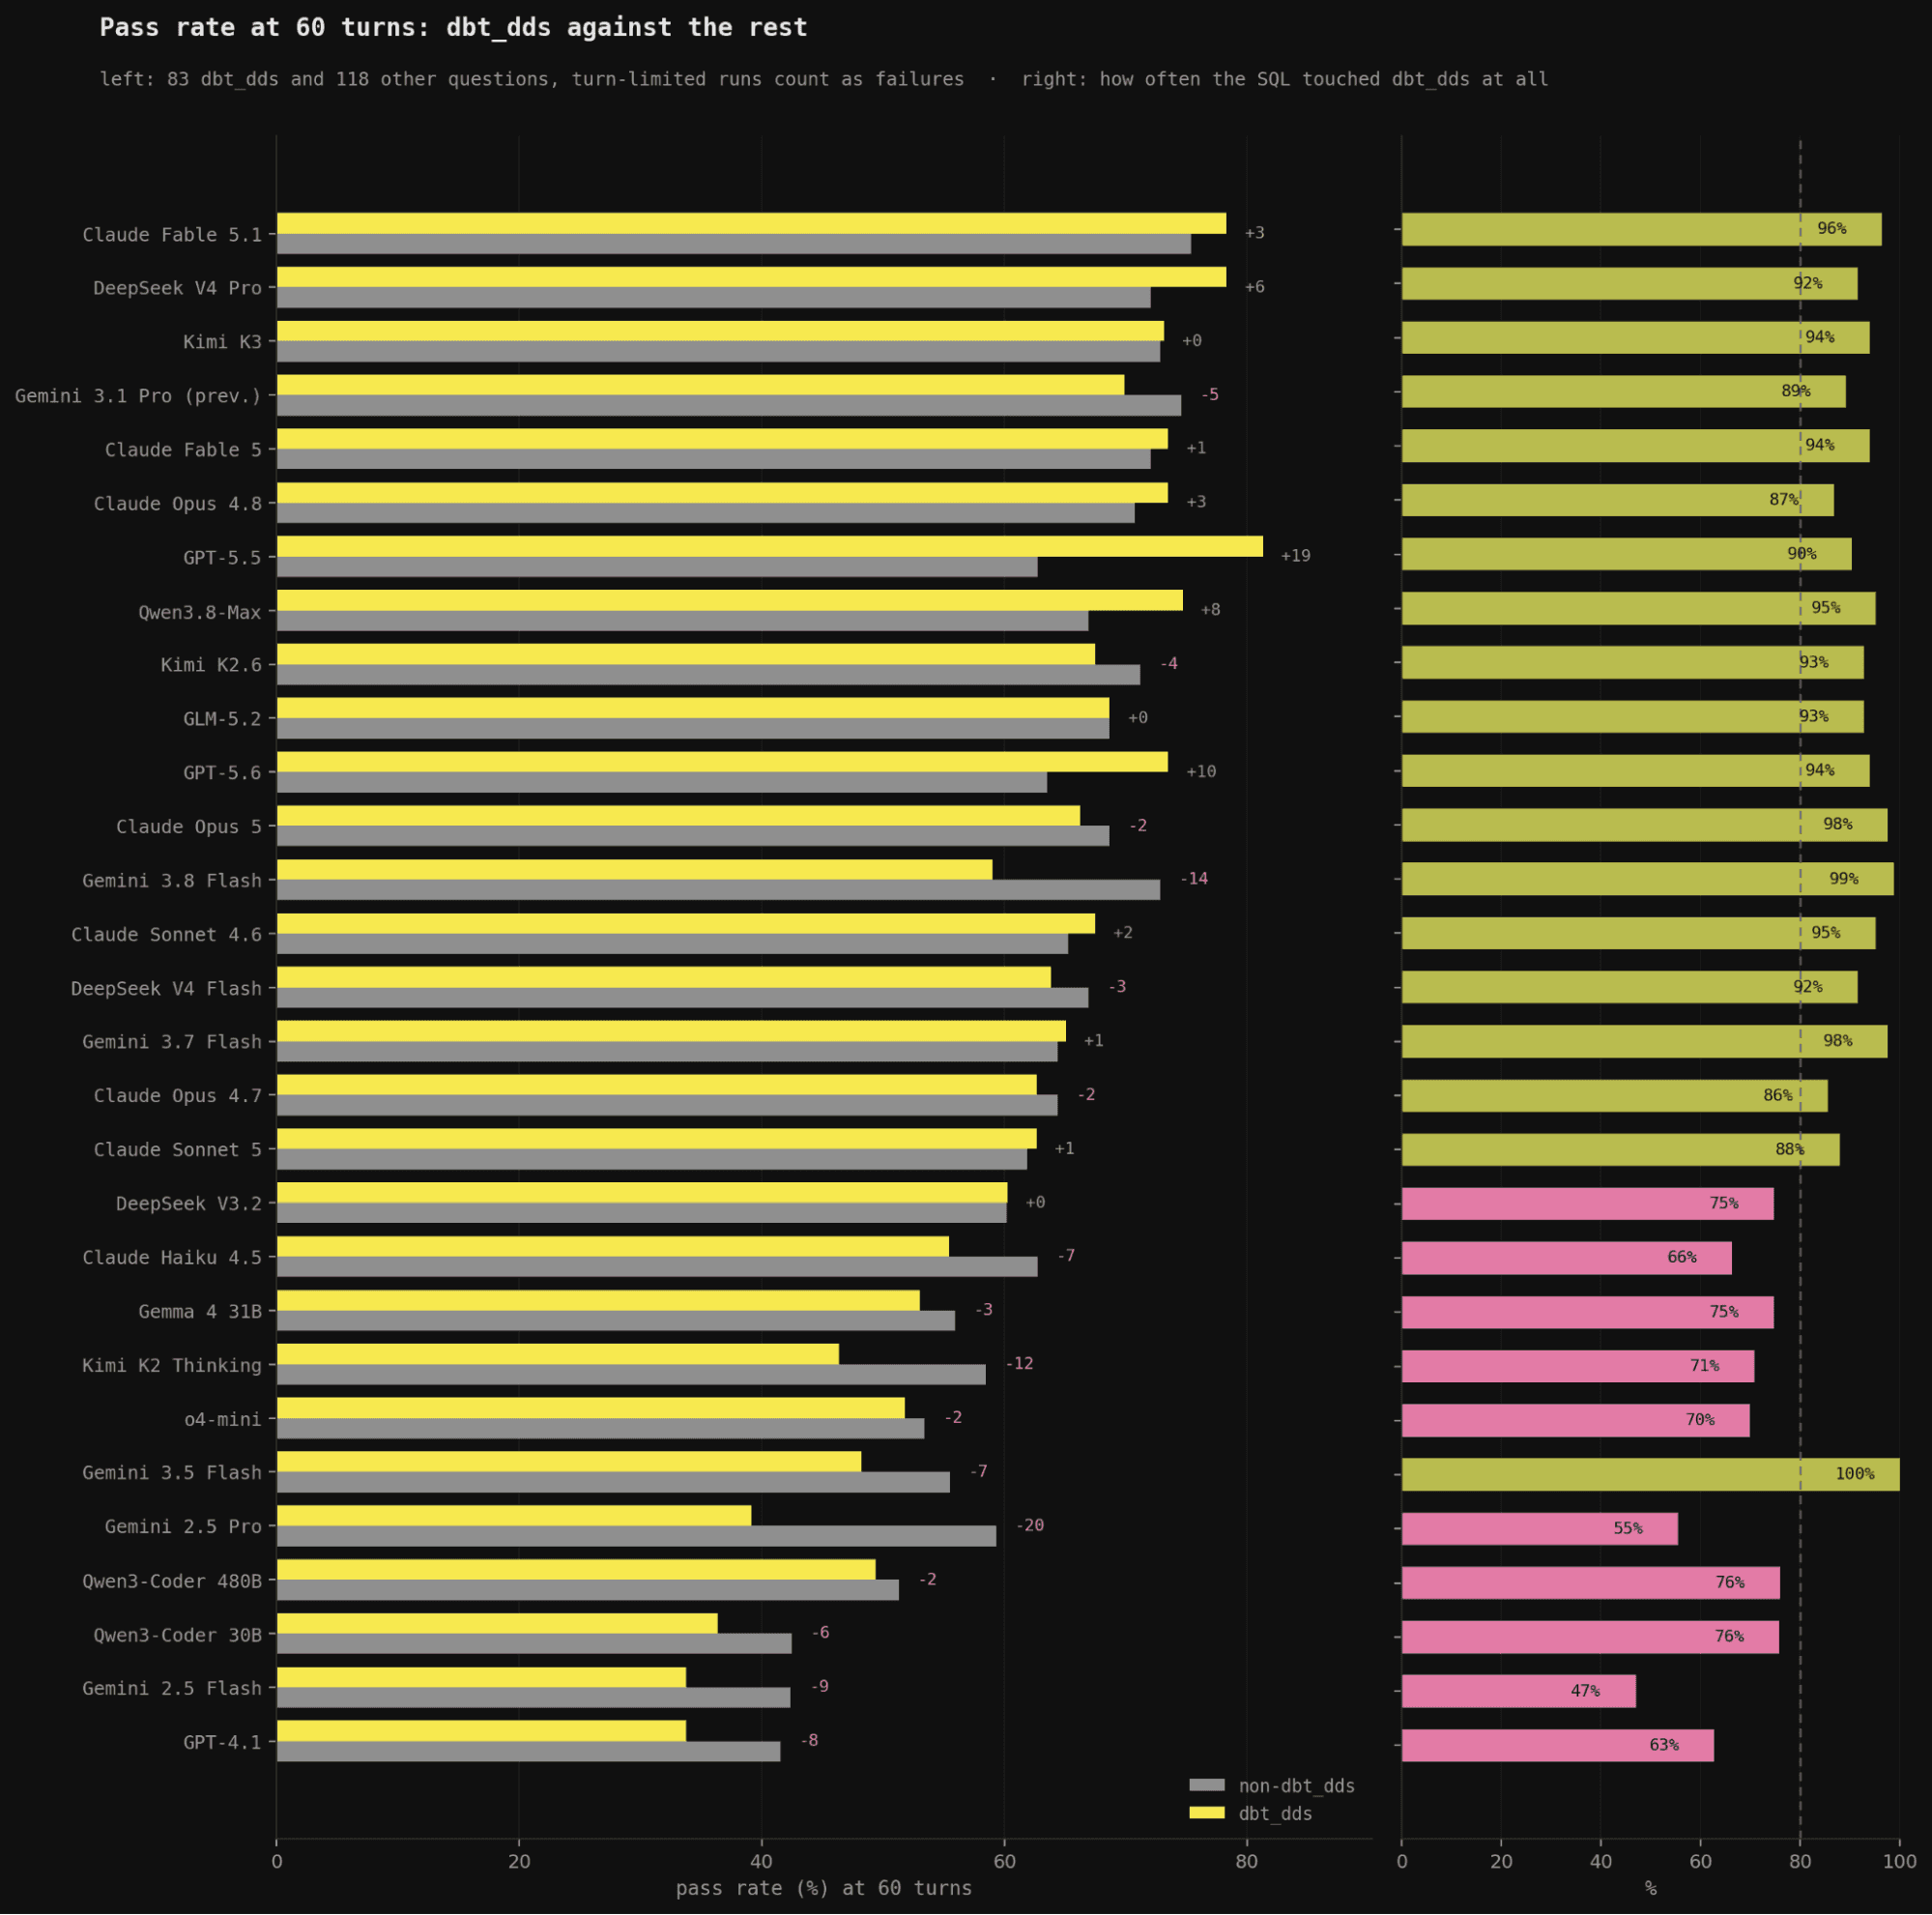
Left: pass rate on dbt_dds questions versus the rest, per model, with the gap annotated. Right: how often each model’s SQL touches the dbt_dds layer at all on those questions.
It seems that most recent models handle both flat and normalised table structures equally well. Further down the board, the gap between flat vs normalised widens, with a clear preference for flat tables - most of these models are smaller and/or older, showing a clear generational improvement.
The failure for these older/smaller models is usually earlier than the join. Models in the top half discover the dbt_dds tables on 87 to 99% of the questions that need them. Models in the bottom half don't reliably find the tables at all. Gemini 2.5 Pro drops 20 points at 55% discovery, and Gemini 2.5 Flash 9 points at 47%.
We see 3 outliers on the board, all of them from Google. Gemini 3.8 Flash discovers dbt_dds on 98.8% of the questions that need it, second highest on the board, and still drops 14 points on them. Gemini 3.5 Flash (a low overall performer) reaches for the normalised tables on every question that needs it - the only model on the board with 100% discovery - but doesn’t use them and drops 7 points. Gemini 3.1 Pro nearly has the best flat-table pass rate on the board, has similar normalised-table discovery as its peers, but, again, fails to use them and drops 5 points.
We think these outliers help to make the case for running your own benchmark on your own data warehouse. We could generalize and say “big, frontier models have the best performance”, or “smaller, mid-tier models have good-enough performance, and much lower cost”, and while these statements are generally true, they don’t mean “just pick any model with that category and you’ll have a good time”. You really need to run it yourself and create a short-list of specific models.
Planning is the main failure mode
When a model concludes with an answer and we score it wrong, we label the failure with one of five modes: FM1 no attempt, FM2 wrong plan, FM3 wrong data, FM4 wrong implementation, FM5 runtime error.
In the table below each model is a row, and each cell is the percentage of that model's failures falling in one mode, so rows sum to 100. The n column is the number of failures. For example, DeepSeek v4 Pro has 49 failures and 73% (36) of them are type FM2. This helps to show the shape of how models fail.
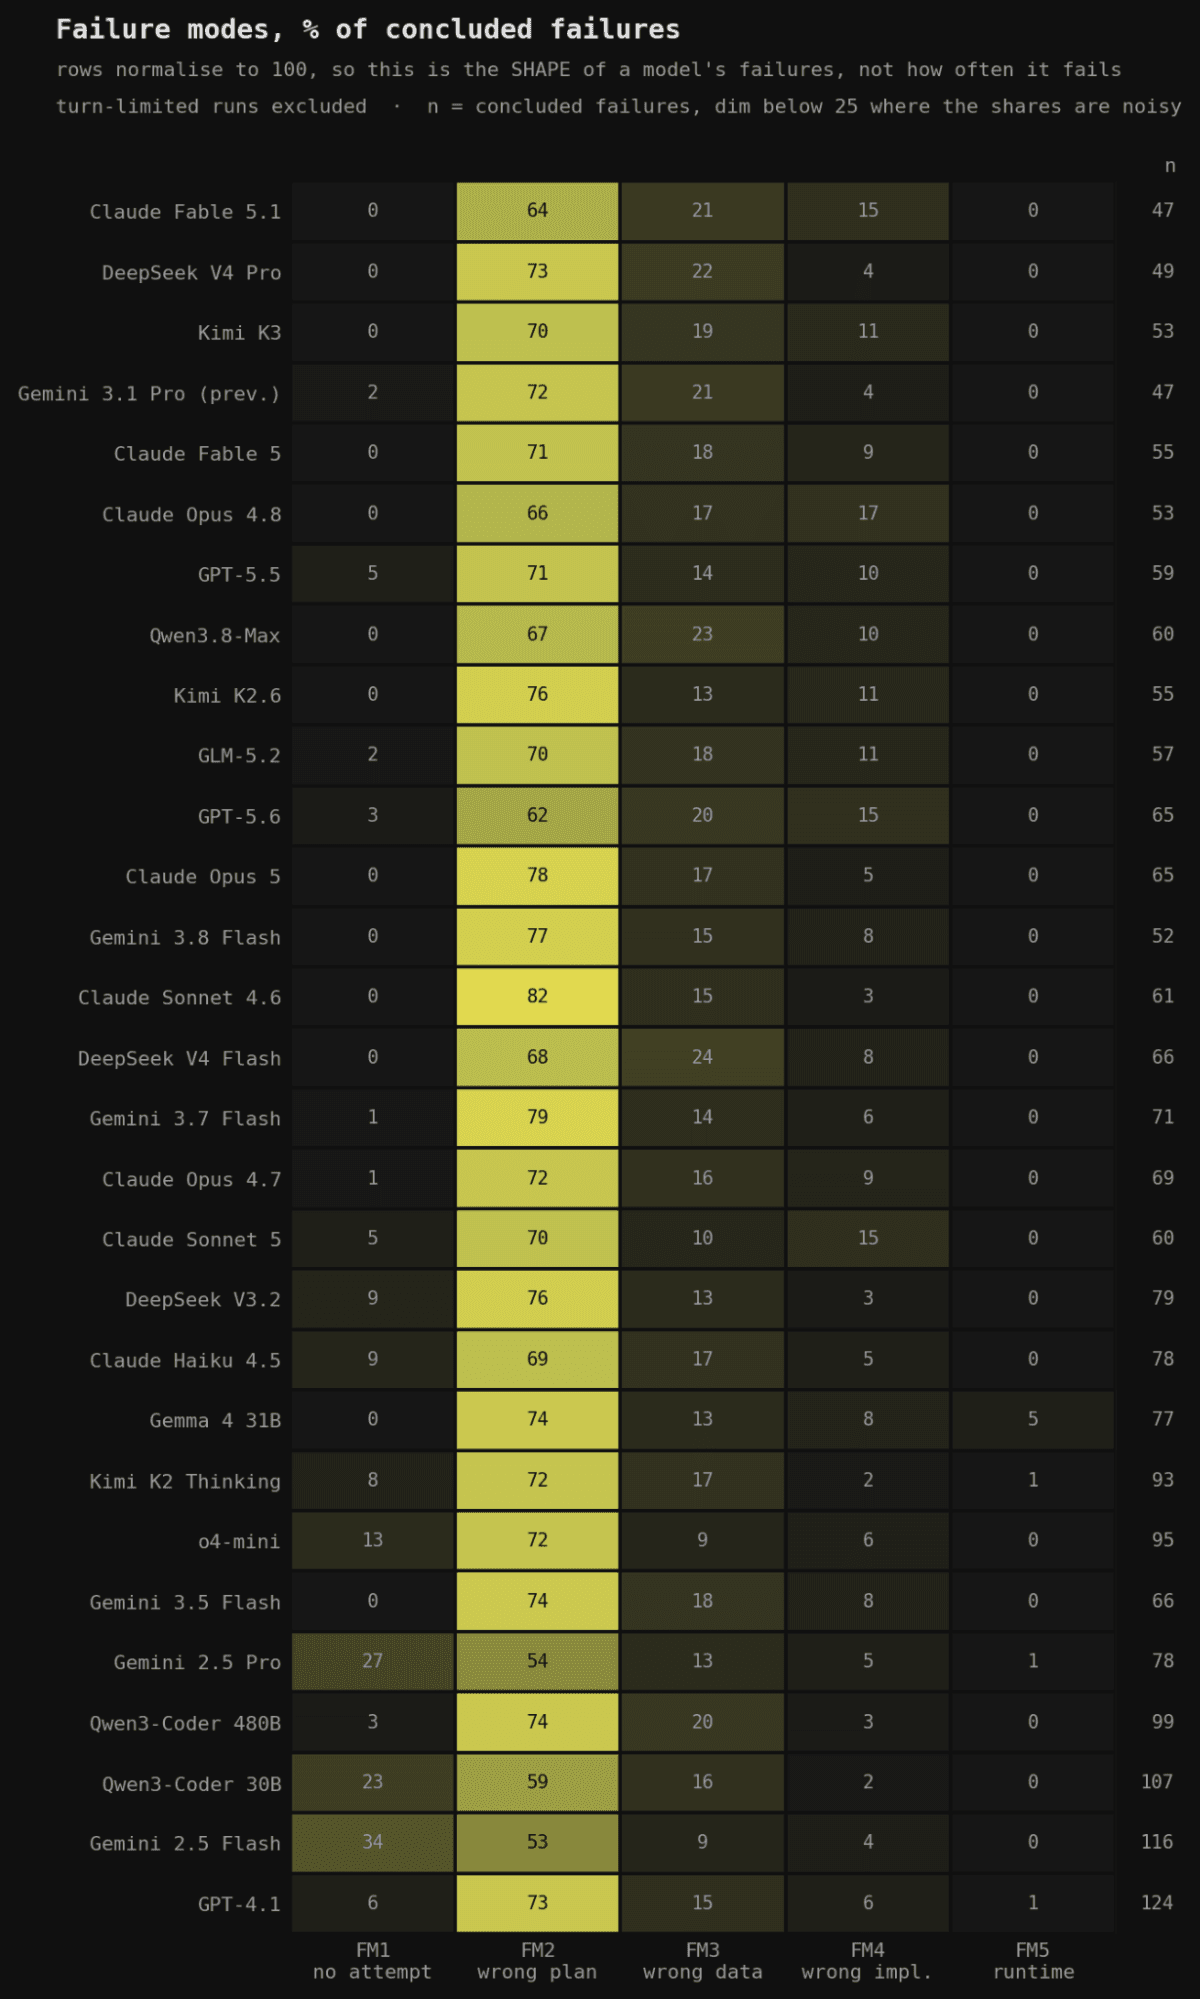
Each model's failures split across the five failure modes. Rows are percentages of that model's failures, not of its questions, and sum to 100; how often a model fails is the leaderboard's job. Turn-limited runs are excluded here as "ran out of budget."
FM2 (wrong plan) is by far the most common, at 53 to 82% of failures for every model with a substantial failure count.
FM5 (runtime error) is close to absent. Only four models record any at all, and only Gemma 4 31B exceeds 2%, so modern models rarely write SQL that fails to execute.
FM1 (no attempt) is a different story. It is generally absent, but grows towards the bottom of the board. It reaches 34% for Gemini 2.5 Flash, 27% for Gemini 2.5 Pro and 23% for Qwen3-Coder 30B, all in the bottom third, while seven of the top ten models record none at all. The highest occurrences are with older and/or smaller models, though not exclusively, as GPT-5.5 and 5.6 both have 3 to 5% of failures in this group.
Fable 5.1 (the board leader) has the lowest FM2 share in the top ten, at 64%. The residual lands downstream: 21% FM3 (wrong data) and 15% FM4 (wrong implementation), 36% together and the highest combined execution share in the top ten. It plans well and then picks the wrong field or grain.
These results show that SQL syntax and execution are no longer bottlenecks for modern models. For agentic analytics, data modeling and schema context matter far more.
The right model for the right task
From the results, can we conclude that the frontier models are the best fit for agentic analytics?
On pass rate alone, tier does hold: ranks 1 to 12 are all frontier-tier models, and no mid- or small-tier model reaches them. But tier says nothing about what a model costs. Inside that top group the price per question spans a factor of eight. The model in second place (DeepSeek V4 Pro) is only 2 percentage points (pp) behind the leader (Fable 5.1), yet costs >75% less.
Outside of the top-tier, consider DeepSeek V4 Flash. It scores 65.7%, which is 11pp behind Fable 5.1, but it costs 52x less ($1 for the full run, vs $52). It’s also faster.
Running our full 201-question benchmark costs $1 with DeepSeek V4 Flash vs. $52 with Fable 5.1, sacrificing 11pp of correctness.
The choice is not simply frontier vs. frontier, nor frontier vs. mid-tier. You need to assess what level of correctness is tolerable for your use case, and what you are willing to pay for the last few points.
Further, failure-mode analysis points at where performance could be supported outside of the model. Wrong plan is the most common failure for every model, at 53 to 82% of failures, and the cheap models are not meaningfully worse at the rest of the job. If the plan is the universal bottleneck, then buying a good plan and executing it cheaply is the obvious architecture: put the strongest model where the plan is made, and let a low-cost model execute it.
We have not benchmarked split-role architectures yet. It is the follow-up we are most interested in: can we close enough of the gap that a model at one-fiftieth of the cost becomes the production default?
Run this on your own data warehouse
data-agent-mnist is not intended to be a fixed score for today's models, nor is it tied to usage of ClickHouse. It’s a reusable harness that can be used by anyone to benchmark models against their own environment.
The harness includes an instrumented assistant (any tracing that captures the question, the SQL it ran, and the results), a modeled warehouse schema, and API access to a handful of frontier models for annotation and judging.
There are multiple stages to reproducing the benchmark for yourself, as discussed in this post: mine and curate the traffic; anonymize with hard-fail verification; reconstruct the schema synthetically and plant every entity the questions reference; recover ground truth by provider-diverse committee; score with a judge panel that never grades its own family. Each stage is a script, and a full evaluation replays from a single command against a deterministic warehouse.
By running the benchmark, the goal is not to say which model is universally the best, but which models will be most appropriate for you to use in production behind your agent, on your workload. Our results show that the discriminator for us is a dimensional CRM layer; your warehouse will have its own discriminator, and only running it yourself will discover what that is. When the next frontier model ships, you can add it as a candidate and grade it against your current selection, knowing that it is comparing apples-to-apples.
What’s next
Of course, new models are released all the time, and we intend to continue updating the results to see how the picture changes. We aim to follow up with additional testing capabilities for different reasoning levels within a model as well as split-model architectures.
We’ll also be writing a full white-paper on test methodology.
We also publish the harness so you can run the benchmark yourself, we would genuinely love to hear what yours finds. Reach out to us in our Slack community or through the git repo!