Observability is meant to give teams confidence when things go wrong. Instead, once systems scale, it often turns into one of the largest line items in the infrastructure budget. What begins as a safeguard against outages and breaches quickly becomes a source of runaway costs.
Teams find themselves constrained: constantly debating what data they can afford to keep, stuck in workflows more about managing spend than solving real problems. Switching platforms seems daunting. The inertia of sunk costs, proprietary technologies, and lock-in can feel overwhelming.
Observability costs can balloon to staggering levels. In 2022 it was reported that a major cryptocurrency exchange was spending around $65 million a year on Datadog.
But it doesn’t have to be this way. How did we end up here? and more importantly, how might we break free?
How we got here - the evolution of observability #
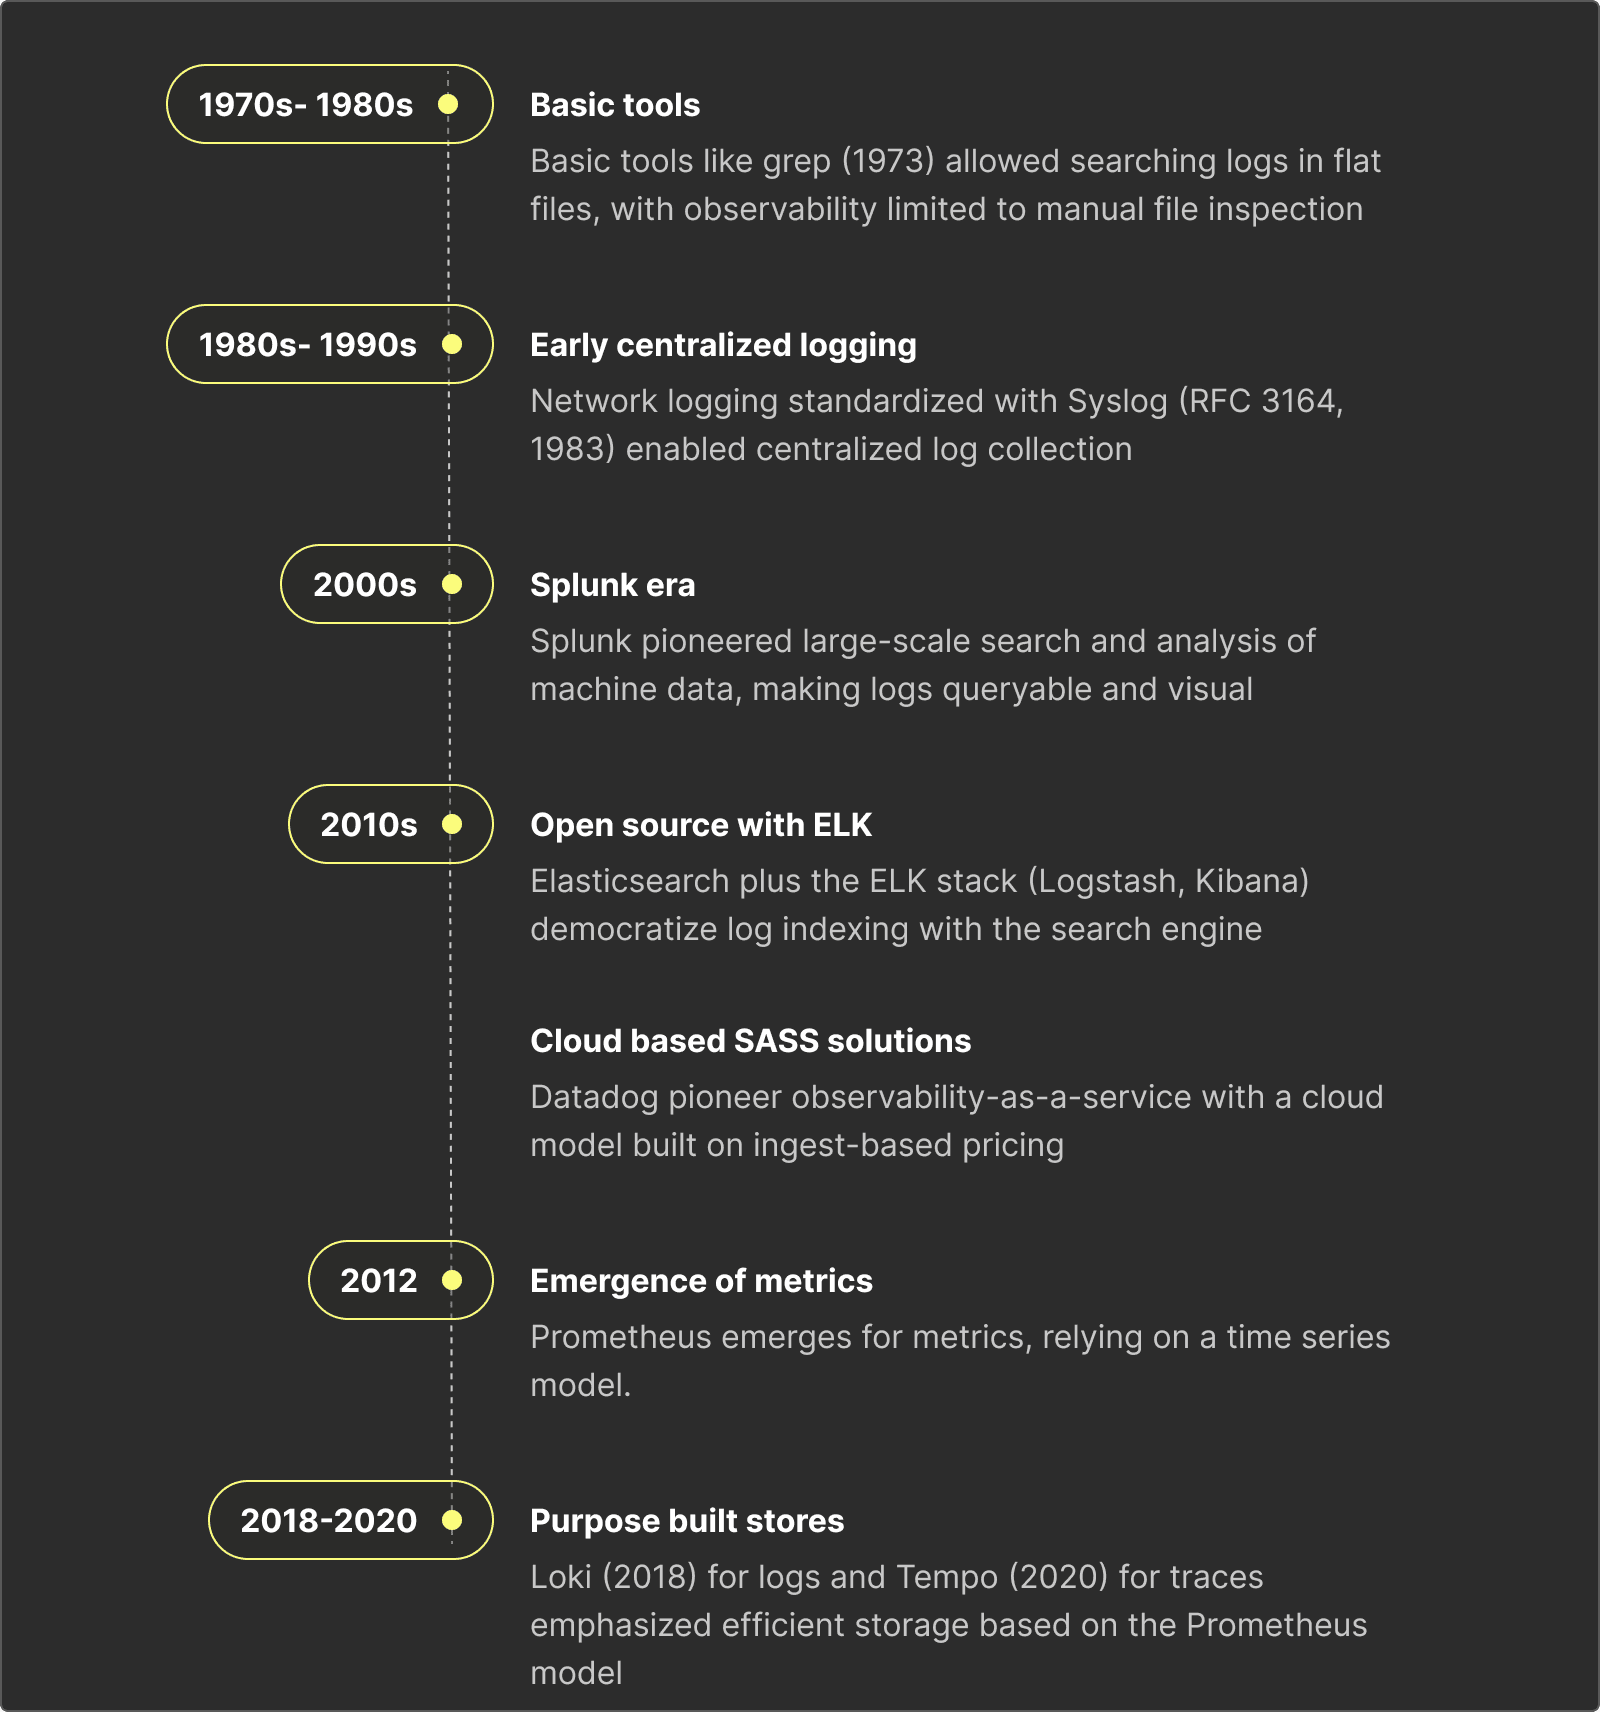
In the beginning, the tools were simple. In the 1970s, engineers reached for grep to sift through logs, a purely manual process. By the 1980s, syslog gave us a way to centralize logs across machines. It was basic, but effective, and cost was never the concern.
The era of Splunk #
Then came Splunk, and with it a new era. For the first time, logs were queryable at scale, visualized in real time, and explored through SPL - a powerful query language that allowed schema-on-read (vs requiring users to define a table schema prior to insert). This flexibility was transformative, but Splunk also set a precedent that still shapes the industry: charging based on how much data you ingest.
Open source and search-based observability #
The early 2010s brought an open-source alternative in Elasticsearch. The ELK stack was cheaper than Splunk but came with trade-offs: weaker UX, clunky workflows, and an architecture designed for modest volumes and low-cardinality data. As usage grew, Elasticsearch hit hard limits - horizontal scaling constrained by the JVM, reliance on inverted indices, and single-threaded shard execution. It struggled with high-cardinality metrics, slow aggregations, heavy disk usage, and costly data movement, making it ill-suited to petabyte scale.
Elastic did innovate on pricing with an early shift to a resource-based model. In theory, it let users optimize costs, but in practice it raised the barrier to entry. Teams had to understand internals like shard allocation, which made the system harder to adopt for users who just wanted to send data and query it.
Cloud based solutions #
Get started with ClickStack #
Spin up the world’s fastest and most scalable open source observability stack, in seconds
At the same time, cloud-based observability solutions emerged, with Datadog becoming the dominant success. Elastic lacked the needed abstractions, and Splunk was not designed for a cloud, leaving Datadog to deliver the best user experience. It abstracted many of Elastic’s architectural problems but created a new one: costs that are unmanageable at scale.
Datadog also introduced controversial pricing. Beyond ingest-based billing, it popularized per-host models for APM and traces. This forced engineering teams to make hard decisions about how many hosts and instance types they could deploy. In some cases, observability costs under this model exceeded the cost of running the infrastructure itself.
Pillar-focused datastores #
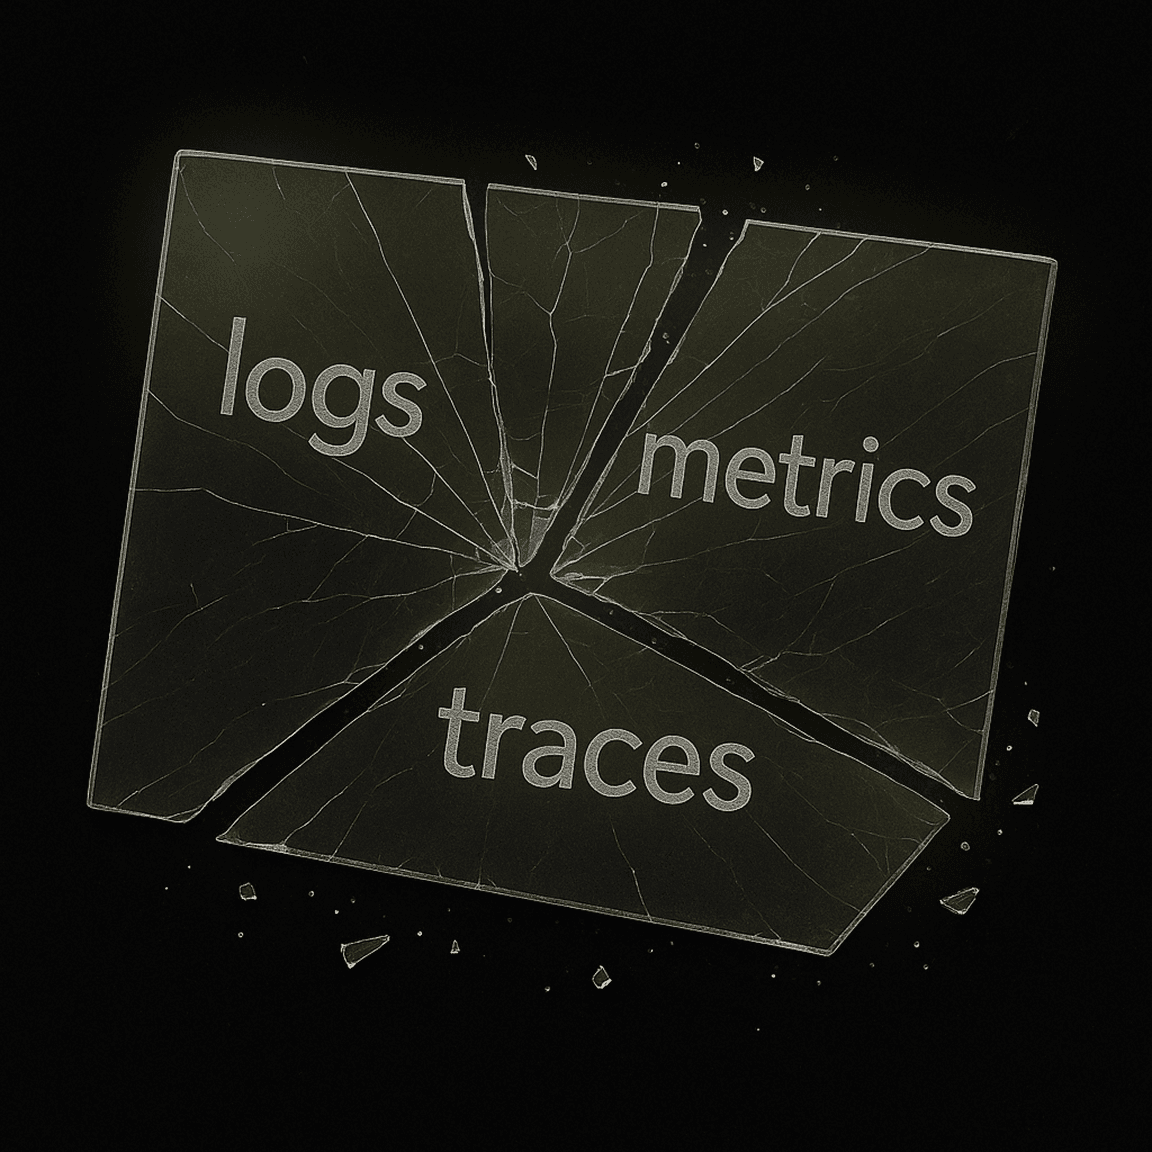
In response to rising costs, the industry broke observability into pieces by building datastores which were resource and cost optimized for a single data type.
Prometheus emerged as a dedicated metrics store, efficient for aggregations but struggling once data exploded in cardinality. Its model inspired others like Loki for logs and Tempo for traces. Each is cheaper to run by design, but only by making compromises, such as limiting query functionality e.g. dropping the ability to search for high cardinality data quickly, such as user IDs.
The result was a trade-off. Data became scattered across stores that could only be linked through predetermined labels, leaving teams juggling multiple dashboards and manual correlation. Exploratory workflows that felt natural in Splunk or Datadog became impossible due to slow performance. And while each system may be efficient alone, running three separate engines adds overhead - teams must learn to operate, scale, and secure each one, paying a tax for every point solution. Instead of solving the pricing problem, we created a new one: silos of observability data.
The idea of logs, metrics, and traces as the "three pillars of observability" came after specialized stores like Splunk, Prometheus, and Zipkin already existed. The pillar models continued to codify and reinforce silos, encouraging yet more single-purpose systems and making fragmentation feel inevitable. Today, those pillars are fundamentally part of the problem we face.
Where we are now #
The choices facing teams today are stark, and neither feels sustainable. On one side are proprietary observability platforms that promise to cover everything in one place but carry costs that simply do not work at scale. On the other side is a fragmented ecosystem of open-source and specialized tools, each optimized for one signal (logs, metrics, or traces) but never the whole picture.
This fragmentation creates its own set of problems. Point solutions can be cheaper in isolation, but they lead to data silos that make correlation difficult. At best, users are left stitching events together with trace IDs or trivial labels. At worst, entire categories of exploratory workflows and the kind of high-cardinality analysis that modern teams depend on become impossible.
In short, we are stuck choosing between tools that are financially unsustainable and tools that are technically limited. Neither path solves the real goal of observability: giving teams confidence and clarity when they need it most.
A path forward: OpenTelemetry as a foundation #
OpenTelemetry has begun to loosen the grip of vendor lock-in. By standardizing instrumentation and data formats, it lets teams collect data once and send it to many backends, giving developers portability that was almost impossible in the proprietary world. Because most vendors now support OTel, adoption can be incremental: new services can start with OTel SDKs while older systems are migrated over time, avoiding the need for a full rip-and-replace.
But not all users are ready to adopt OTel. Any solution also needs to be flexible enough to support all event formats.
If OTel is the foundation, the next step is to ask: what should the full blueprint for observability look like?
What we really need from observability #
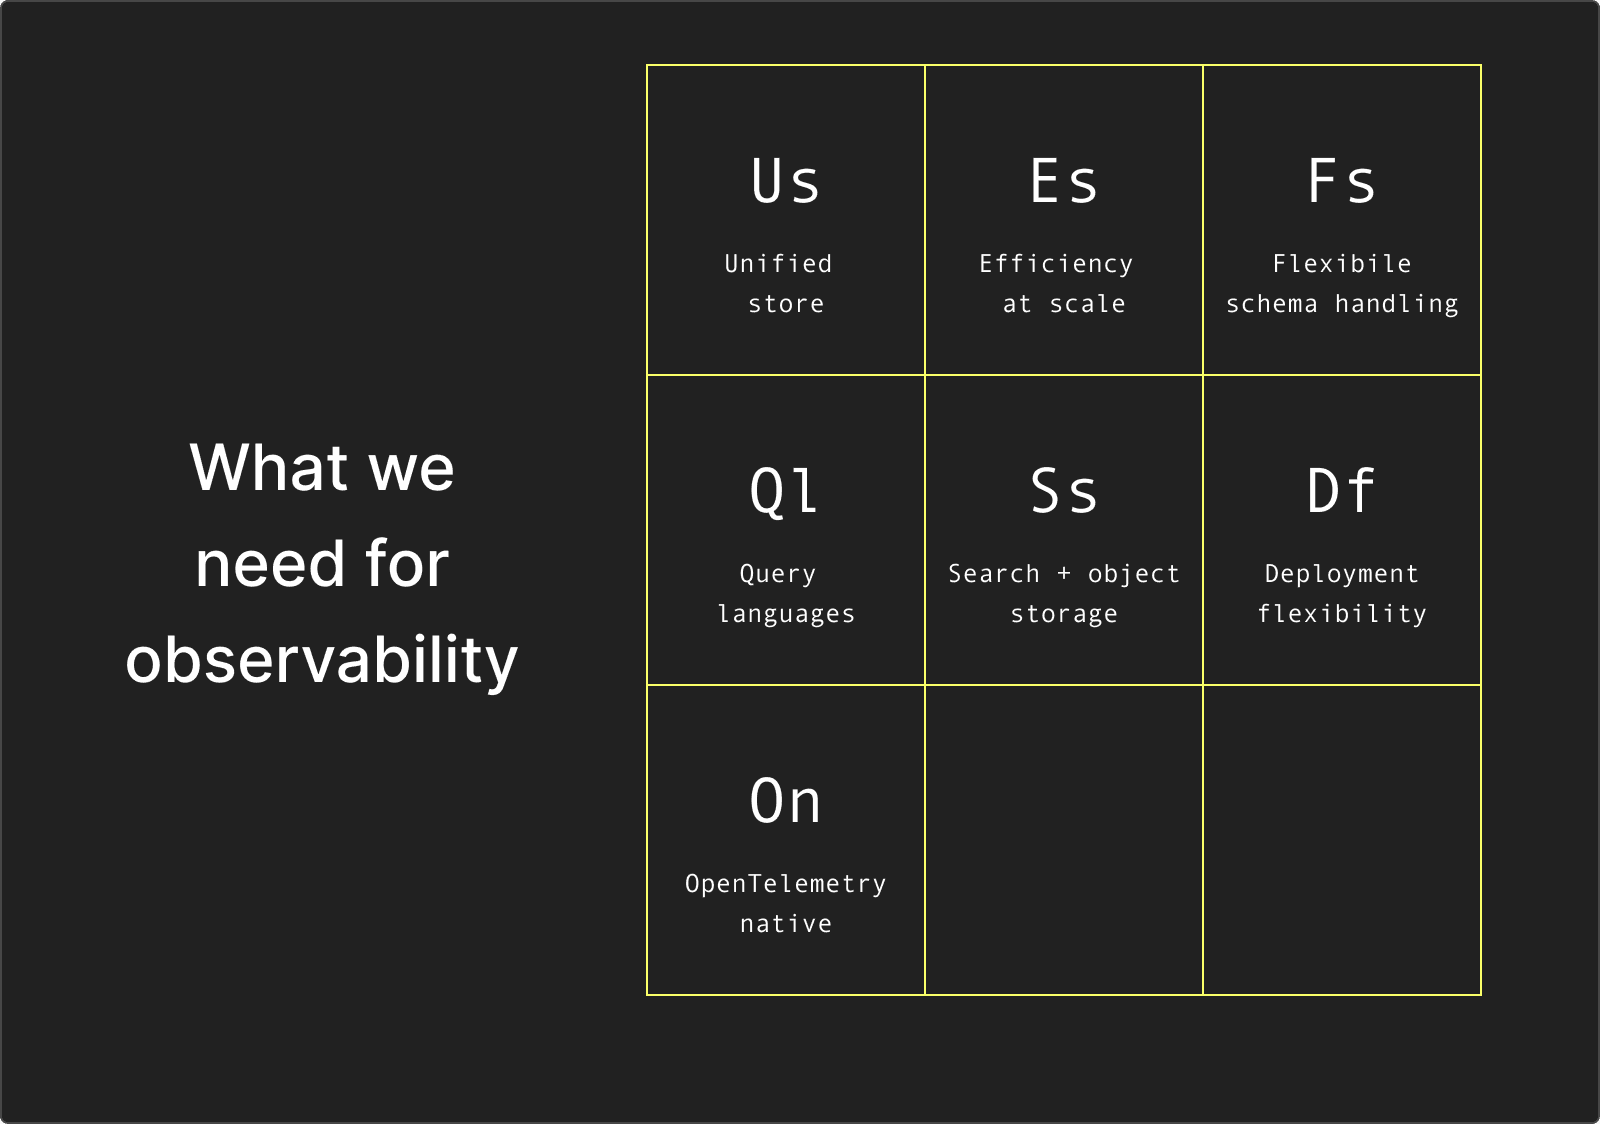
The answer is not another specialized store or proprietary black box. We need a unified engine where logs, metrics, and traces live together and can be correlated alongside business and application data.
We need efficiency and performance at scale. Any viable store must handle high ingest rates while also delivering fast aggregations over high-cardinality data.
Any system should make first-class use of object storage for affordable long-term retention.
It should offer flexible schema handling, combining schema-on-read where necessary but also schema-on-write for supporting JSON and wide events efficiently.
We also need expressive querying. SQL remains the lingua franca, but full-text search is still valuable for hot datasets, and natural-language or DSL-style layers (SPL, PromQL, ES|QL) can lower the barrier further.
Solutions must be OTel-native, but importantly not OTel-exclusive, supporting the familiar data types while also recognising the potential of wide events.
Finally, we need deployment flexibility. Proprietary vendors proved the value of simplicity in managed offerings, but the open-source movement has shown the importance of control. Any future solution must support both: a zero-ops managed cloud for those who want it, and a simple open-source option that anyone can run locally. Without that balance, lock-in becomes inevitable.
Observability should not force teams into trade-offs between what they can afford and what they need. The right solution must deliver all of these properties while making retention and usage costs predictable and sustainable. In the end, this is a data and analytics challenge - and we can solve this by taking learnings from modern data stacks and applying them to observability, as opposed to viewing observability as a special case of lock-in, silos, and punitive pricing models.
The case for columnar storage #

Columnar stores hold columns separately on disk, order these and support codecs such as Delta. The result is high compression and reduced I/O.
For observability, the fit is natural. Columnar stores provide high compression and storage efficiency, cutting costs at scale. They excel at fast aggregations over high-cardinality data and at selective filtering by scanning only the columns needed, powering dashboards and exploratory workflows. They combine fast writes with efficient indices such as Bloom filters, and modern engines add optional full-text search at the column level for when logs demand it.
Columnar databases have also evolved to support both schema-on-read and schema-on-write, with built-in functions for parsing semi-structured data at speed and native support for JSON and wide events. And because they have comprehensive SQL support built in, they enable expressive queries without forcing teams to learn yet another DSL.
In short, columnar storage reframes observability as just another data problem. With compression, cardinality, query speed, and schema flexibility solved in one architecture, columnar databases provide the foundation earlier generations of tools could not.
Why ClickHouse makes the most sense #
ClickHouse is not the only columnar database. Systems like Apache Pinot and Apache Druid share many of the same architectural advantages, and all have found success powering large analytical workloads. But when it comes to observability, ClickHouse stands out due to its real-time focus.
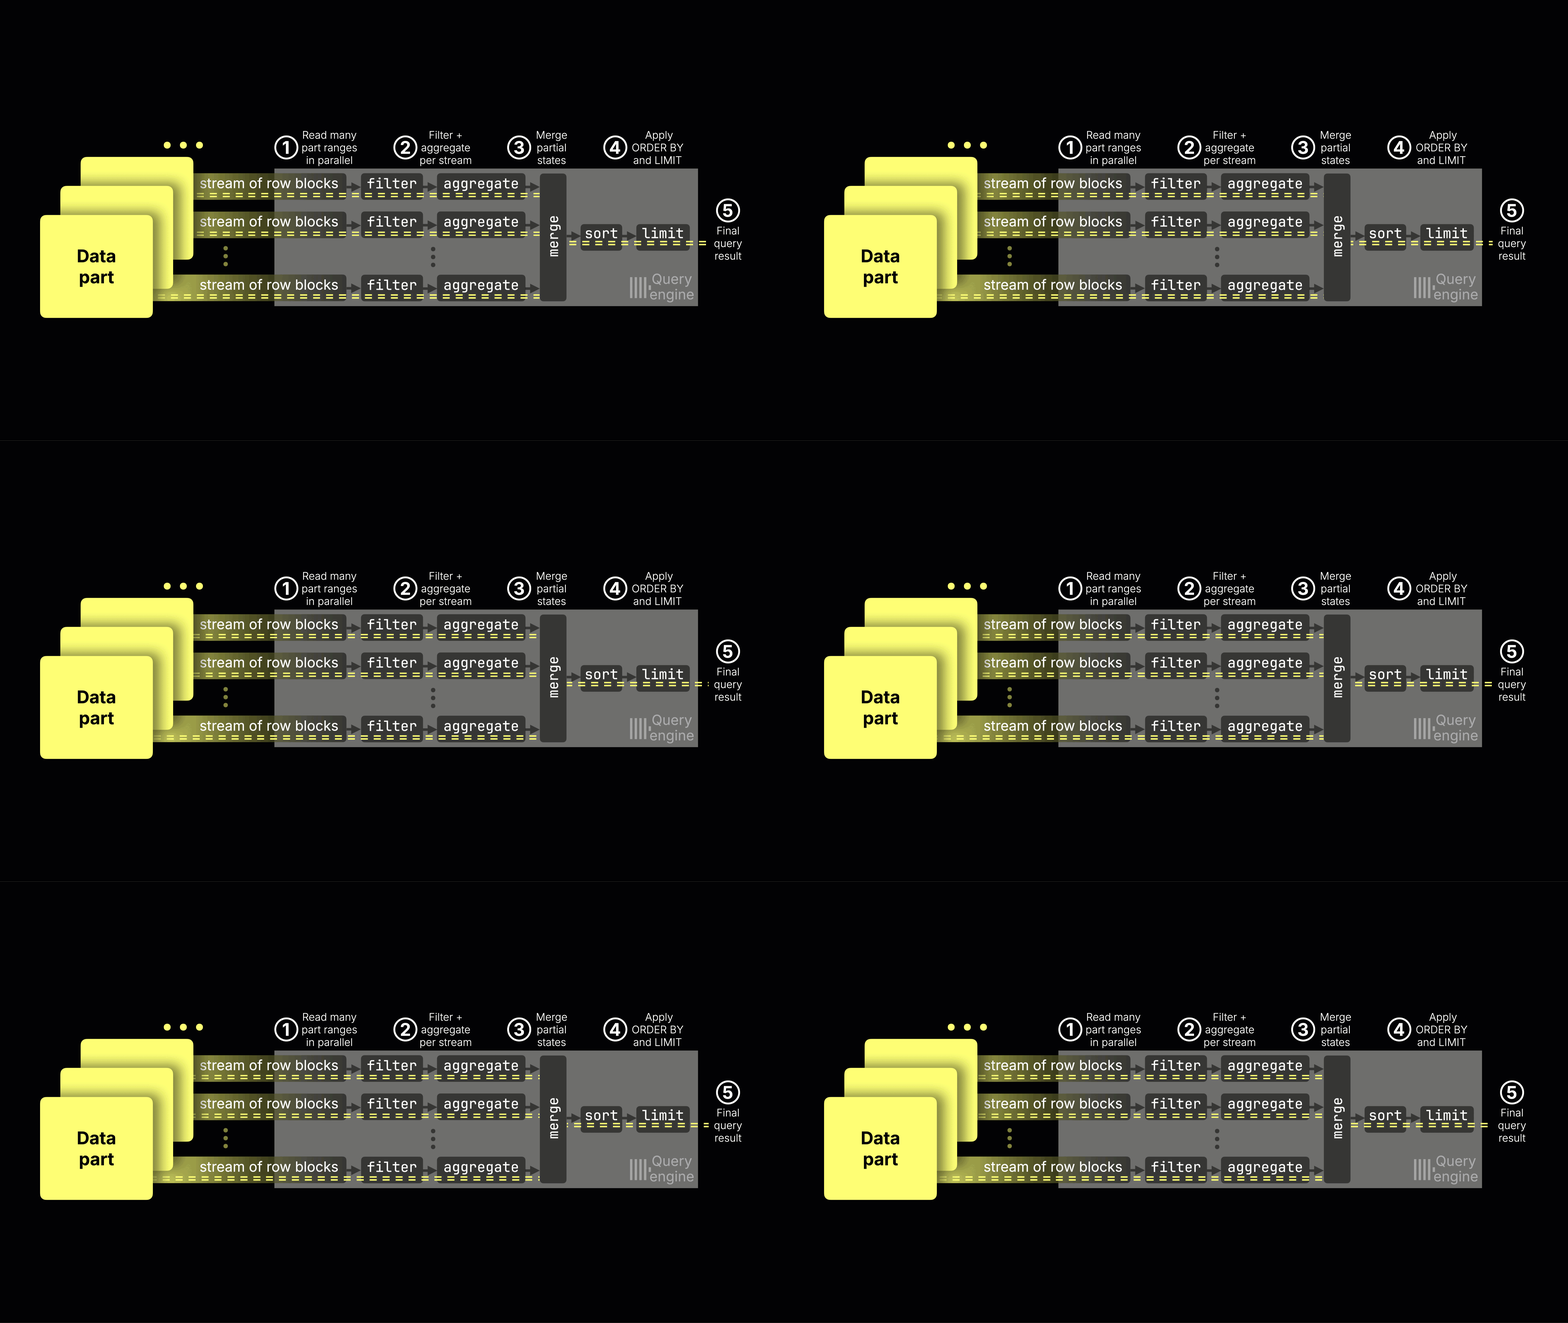
Sparse primary indices make filtering efficient, aligning with observability access patterns, while the parallel execution engine scales queries across large datasets. Skip indices and support for full-text search extend these capabilities, enabling exploratory workflows.
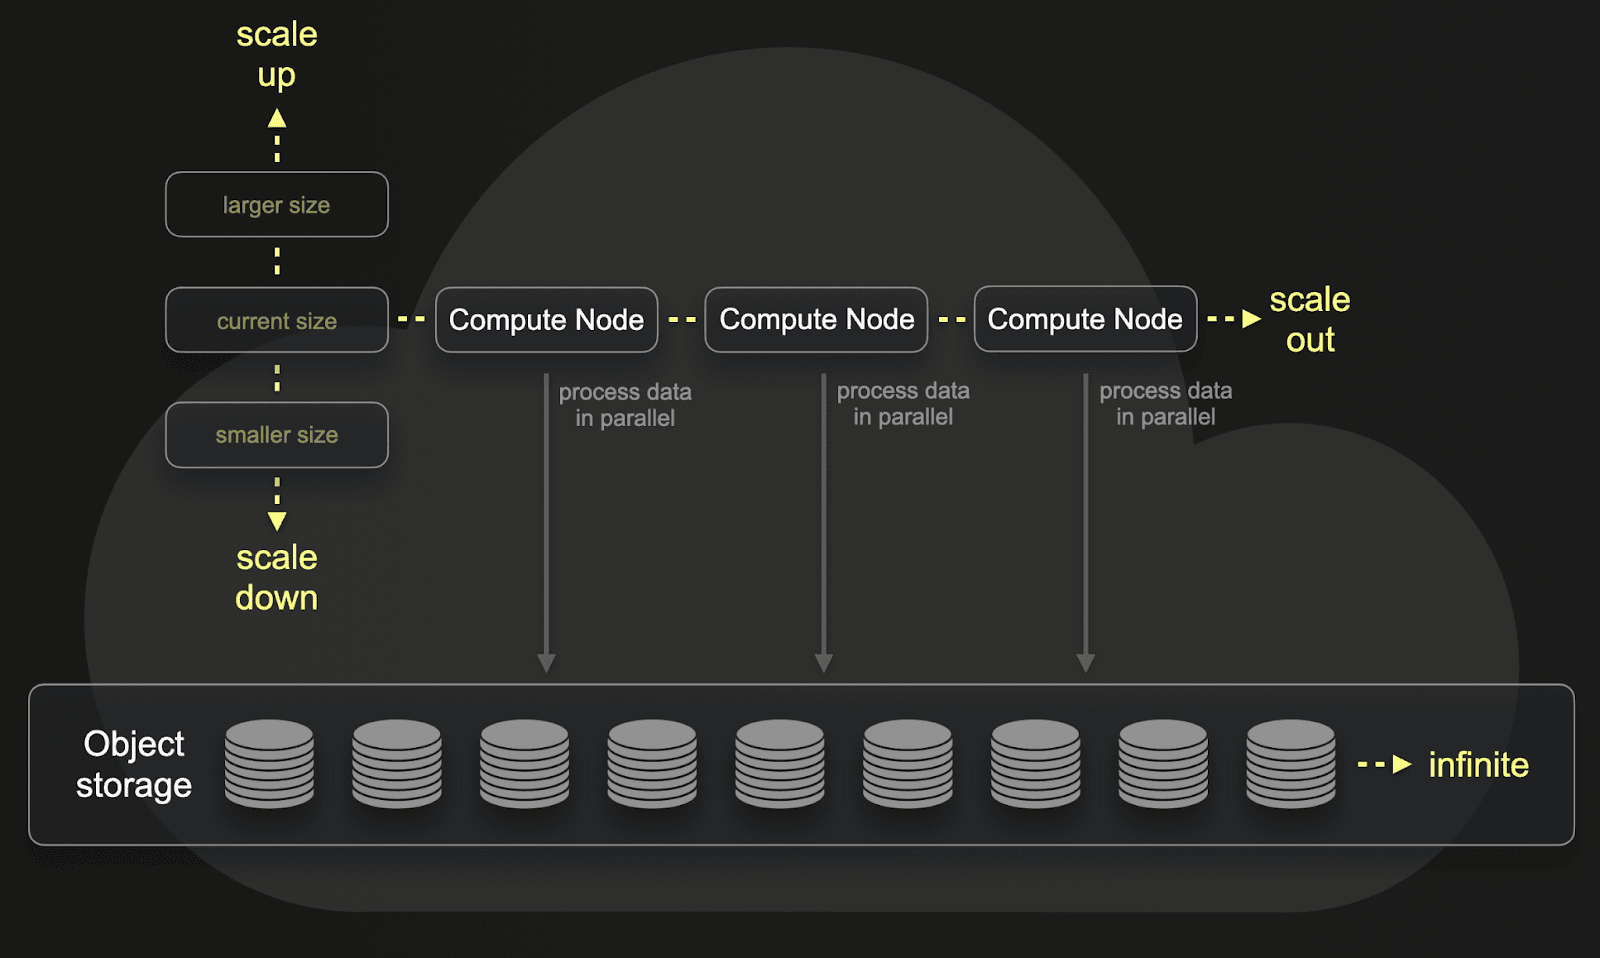
ClickHouse's storage architecture natively supports object storage and separation of compute from storage. When combined with columnar compression, this makes it possible to retain large volumes of data affordably, while still scaling compute resources independently as demand changes.
ClickHouse's JSON type is also unique: it preserves schema and type information while avoiding the pitfalls of earlier schema-on-write systems where the first inserted value determined the type. Teams can "just send JSON" for fast adoption, while still gaining efficient schema-on-read through optimized string parsing when structure isn't available at source.
These features have already been validated in large-scale observability deployments. Companies such as Tesla, Anthropic, OpenAI, and Character.AI rely on ClickHouse to analyze observability data at petabyte scale, demonstrating its ability to meet the demands of modern workloads.
The need for a dedicated UI #
Columnar databases are a natural fit for observability, and many early adopters have already recognized this. Companies like Anthropic, OpenAI, and Netflix have built powerful systems on top of ClickHouse, proving the model works. But what distinguishes these organizations is not only their choice of database - it was their ability to invest in building a custom UI. That approach requires dedicated engineering teams and significant investment, and it is really only viable at extreme scale.
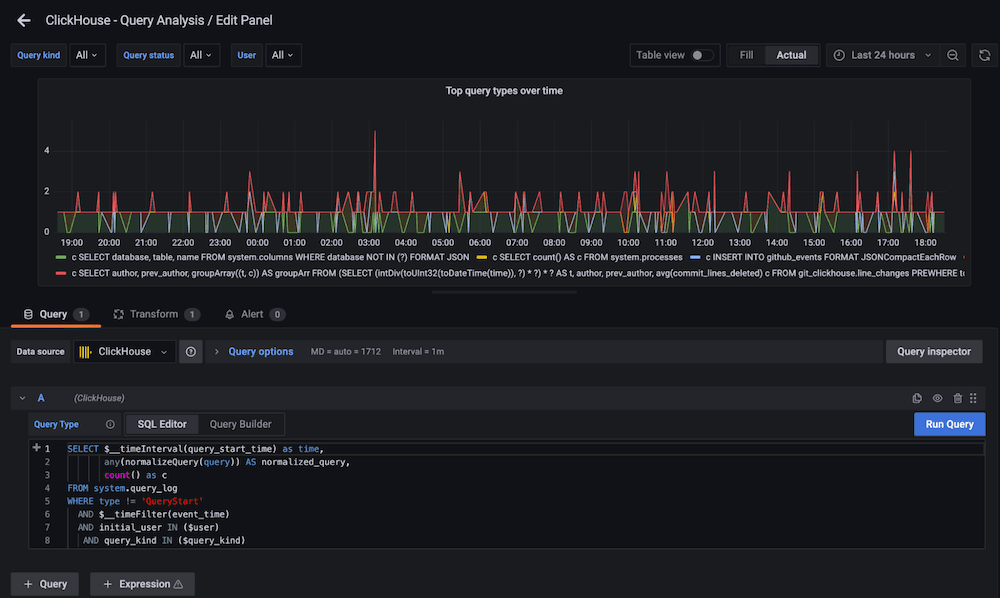
Other users turn to Grafana, which has long been a staple of the observability stack. It remains a powerful way to unify data from multiple sources, but it comes with trade-offs. Querying ClickHouse requires Grafana users to have familiarity with SQL and puts the responsibility of query optimization on the user. For developers who simply want to investigate an issue quickly, that barrier can be high - not everyone is an observability expert.
Every day, developers need tools that are accessible for ad hoc investigations. SQL will always be valuable for deep analysis, but it is not the right fit for fast, intuitive workflows where the goal is quick searches and immediate answers.
What is needed is a dedicated o11y interface for ClickHouse. This needs to be developer-friendly, open, and accessible, while giving direct access to the underlying database when required. Crucially, it should be open source to avoid just more vendor lock-in.
Why ClickStack #
Many companies have already recognized ClickHouse as the right database for observability and built platforms on top of it. But most introduce new issues: some are OTel-only, ignoring flexible models like wide events; others are closed, proprietary systems that recreate the silos we’ve been trying to escape, blocking correlation with business data and cutting off ClickHouse’s broader power.
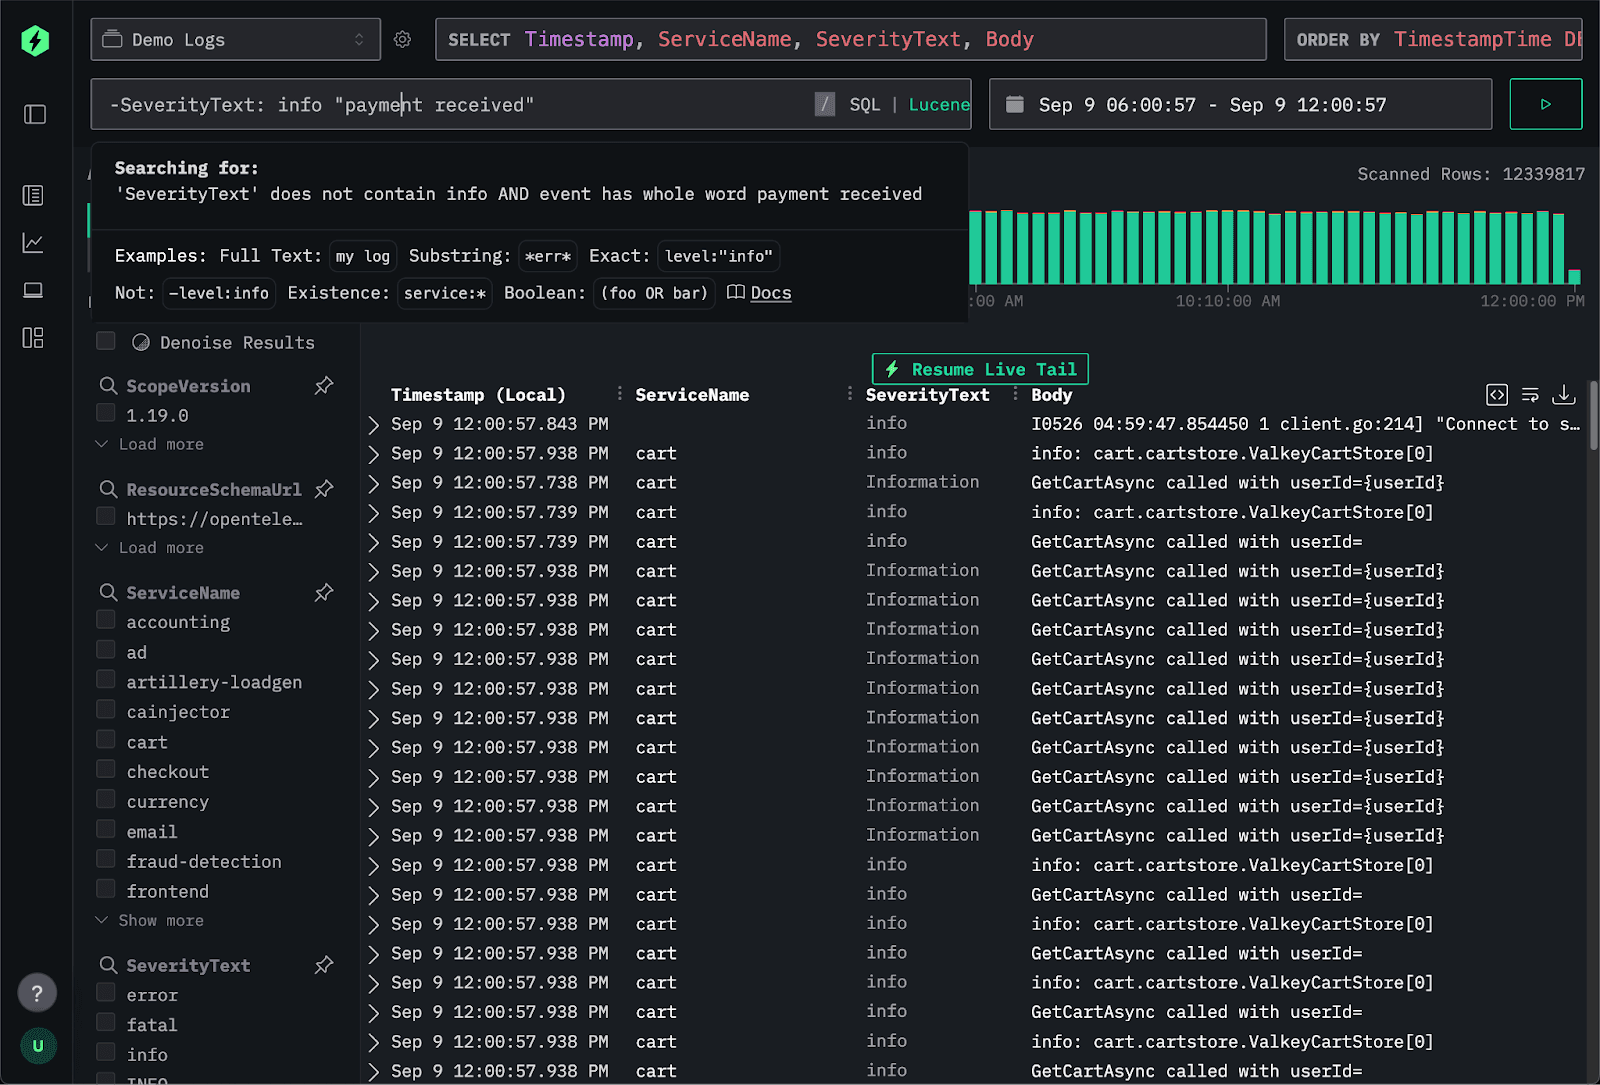
ClickStack was built to take a different path. It unlocks the full capabilities of ClickHouse while avoiding the traps of exclusivity and lock-in. It is OTel-native but not OTel-exclusive, so wide events are first-class citizens too. It is open source, giving teams the freedom to run locally with simplicity, or in the cloud when scale demands it.
In ClickHouse Cloud, ClickStack inherits the strengths of the database itself: separation of storage and compute, industry-leading compression, and extremely low cost per terabyte. Just as importantly, it brings all your data together in one place - observability signals, business metrics, and application analytics - so you can correlate across them without silos..
Get started with ClickStack #
Spin up the world’s fastest and most scalable open source observability stack, in seconds
Conclusion #
The systems of the past have led us here: to columnar databases as the natural foundation for observability. They provide the compression, performance, and schema flexibility that modern workloads demand. Wide events move us beyond the old pillars of logs, metrics, and traces by capturing full context in a single record, and ClickHouse has proven these ideas work at a massive scale. What was missing was accessibility with an open, developer-friendly interface that brings the power of columnar storage to everyone, not just organizations with the resources to build custom solutions.
Clickstack’s goal is simple: to democratize observability. With ClickStack, anyone can get started in a few commands, without sacrificing depth, scale, or openness. It is observability without the silos, without the lock-in, and without the punishing price tags of the past.
