Few companies on Earth operate at the scale of Tesla. From massive Gigafactories to critical energy systems to a global network of connected vehicles, keeping that many moving parts in sync demands real-time observability into what’s happening, everywhere.
“Tesla isn’t a small operation,” says Senior Staff Software Engineer Alon Tal. “We generate a massive amount of metrics, and we want to use that data for things like long-term analysis, forecasting, and anomaly detection.”

When it came time to build a new observability system, Alon and the team looked at the usual suspects. For many growing companies, this re-evaluation is driven by the limitations of proprietary platforms, from per-seat pricing models to vendor lock-in. This pivot point is a common architectural challenge, as a direct comparison of top infrastructure monitoring tools often overlooks the underlying data platform's ability to scale. But while tools like Prometheus were great in theory, they weren’t built for Tesla’s scale. “You can’t scale it horizontally, and there's a limit to how much you can scale it vertically,” he explains. “Also, as a single-server system, it doesn’t meet our availability requirements. If it goes down, you lose your metrics. That’s completely unacceptable.”
They needed something faster, more durable, and more scalable. A system that could ingest tens of millions of rows per second, retain years of data, and stay responsive under heavy load. So they chose ClickHouse and used it to build Comet, a Tesla-scale platform that delivers Prometheus-like simplicity backed by ClickHouse-grade performance and reliability.
This case study explores how Tesla built Comet, why they chose ClickHouse as its foundation, and how a quadrillion-row load test proved the system could scale far beyond even Tesla's demanding requirements.
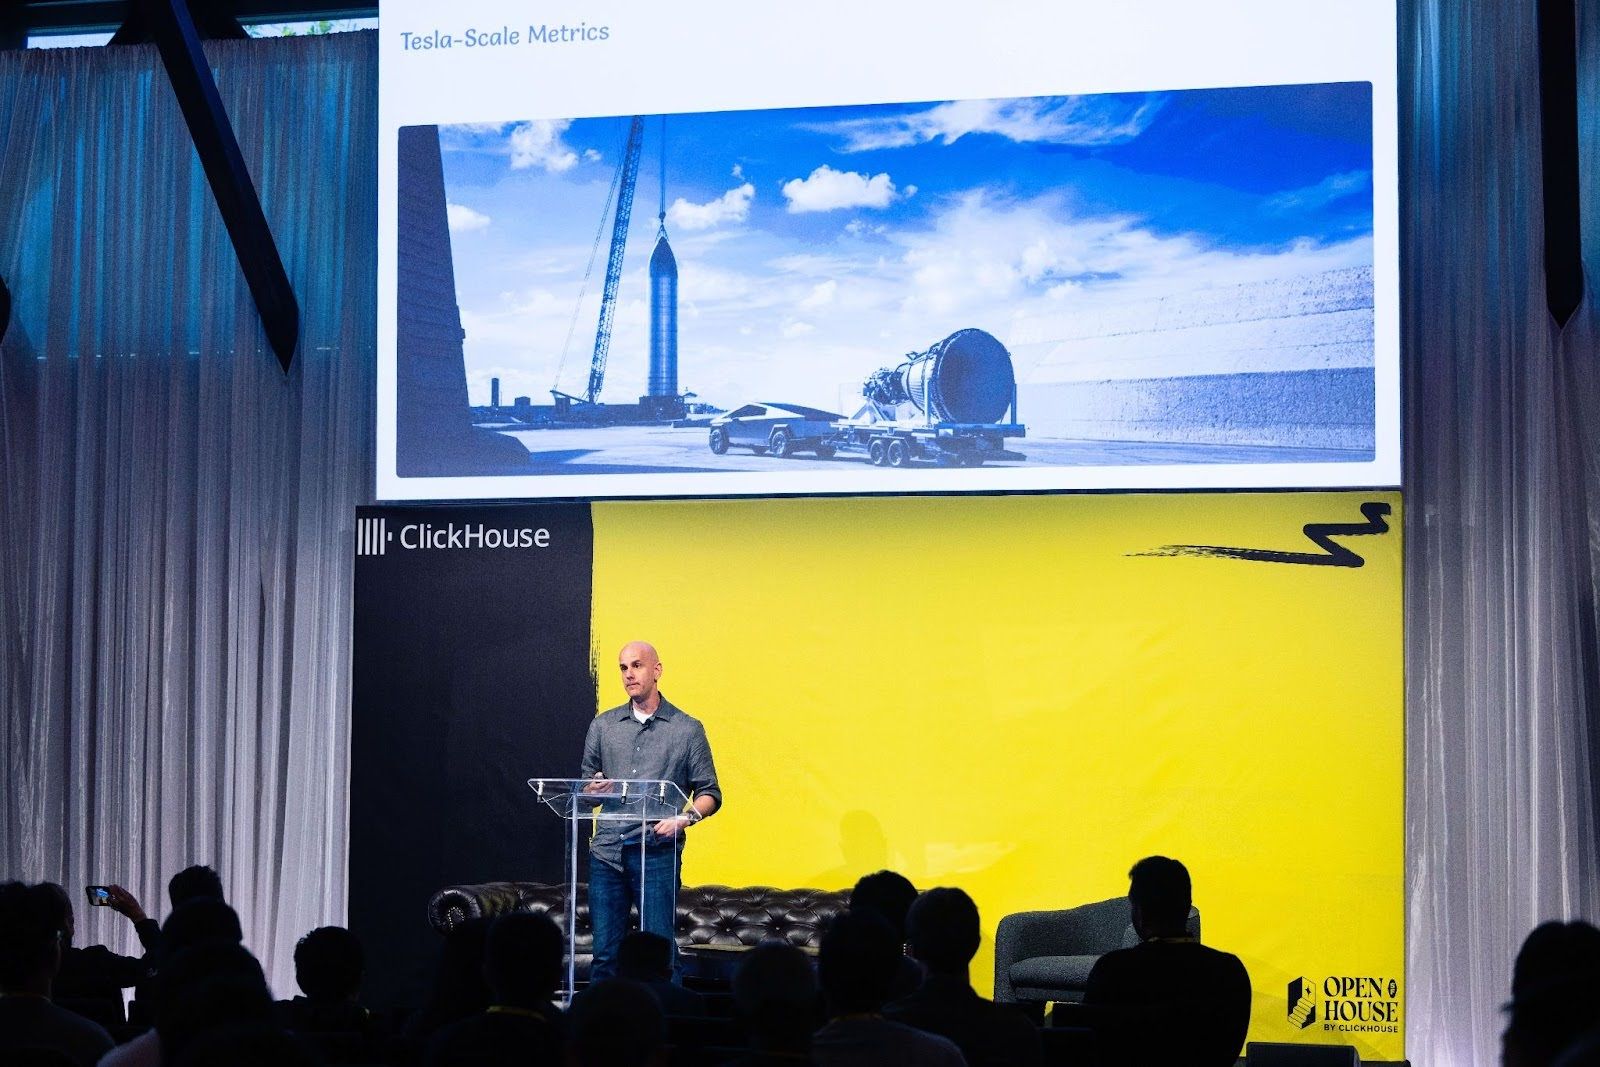
Watch Alon’s talk at ClickHouse’s inaugural 2025 Open House user conference. Watch the video.
A slew of non-negotiables #
From the outset, the team had a clear list of requirements. First and foremost, Alon says, “it had to scale.” For Tesla, that meant handling massive amounts of data in real time, with confidence that the new system could keep up as volume grew.
Availability was just as important. “At Tesla, losing metrics can have actual, real-world, physical repercussions,” Alon says. With so much on the line, the system had to be bulletproof.
Retention was another priority. The team needed to look back across months and even years to spot patterns and predict issues. Durability was a given: once a metric is accepted, it has to persist, even through restarts. And speed was non-negotiable. “Nobody likes a sluggish dashboard, especially when you're troubleshooting an outage,” Alon says.
Flexibility mattered, too. They wanted the freedom to ask complex questions, run custom analyses, and support a wide range of internal use cases. “We want to be able to ask interesting questions about our data and not be limited by a simplistic domain-specific language.”
Finally, it all had to work with PromQL, Tesla’s query language of choice for metrics analysis. “This is the language our engineers know and prefer,” Alon says. They also had a huge library of existing dashboards and alerting rules. “Nobody wanted to reimplement all that.”
Learn about ClickStack #
Explore the ClickHouse-powered open-source observability stack built for OpenTelemetry at scale.
The case for ClickHouse #
As they began their observability journey, there were a few obvious starting points. “When you think about PromQL, the mind immediately goes to Prometheus,” Alon says. It’s the reference system behind the language, widely adopted, and easy to use. But given Tesla’s scale and other requirements, it wasn’t a viable option. “So we set out to build our own,” he says.
The first and “most fundamental” decision was where to put the data. The team looked at several tools, but ClickHouse stood out for its performance and flexibility.
“In our opinion, data in ClickHouse is better than data anywhere else,” Alon says. “No other system lets you slice and dice your data, ask interesting questions, and get answers in an acceptable amount of time.”
This approach frames observability as a data analytics problem, which is the core principle detailed in our playbook for building cost-effective observability architectures.
“ClickHouse checks every box,” he adds. “We have availability, speed, durability. We have everything we could want.” It even offers unexpected advantages, like support for executable user-defined functions (UDFs). That turned out to be especially helpful because, as Alon puts it, “not everything is trivial to express in SQL. Having UDFs was an excellent escape hatch.”
In the end, the choice was obvious. ClickHouse gave Tesla the performance they needed at scale, and the confidence to build something that felt both powerful and familiar. “There’s nothing out there that competes with ClickHouse,” Alon says.
Inside Comet’s architecture #
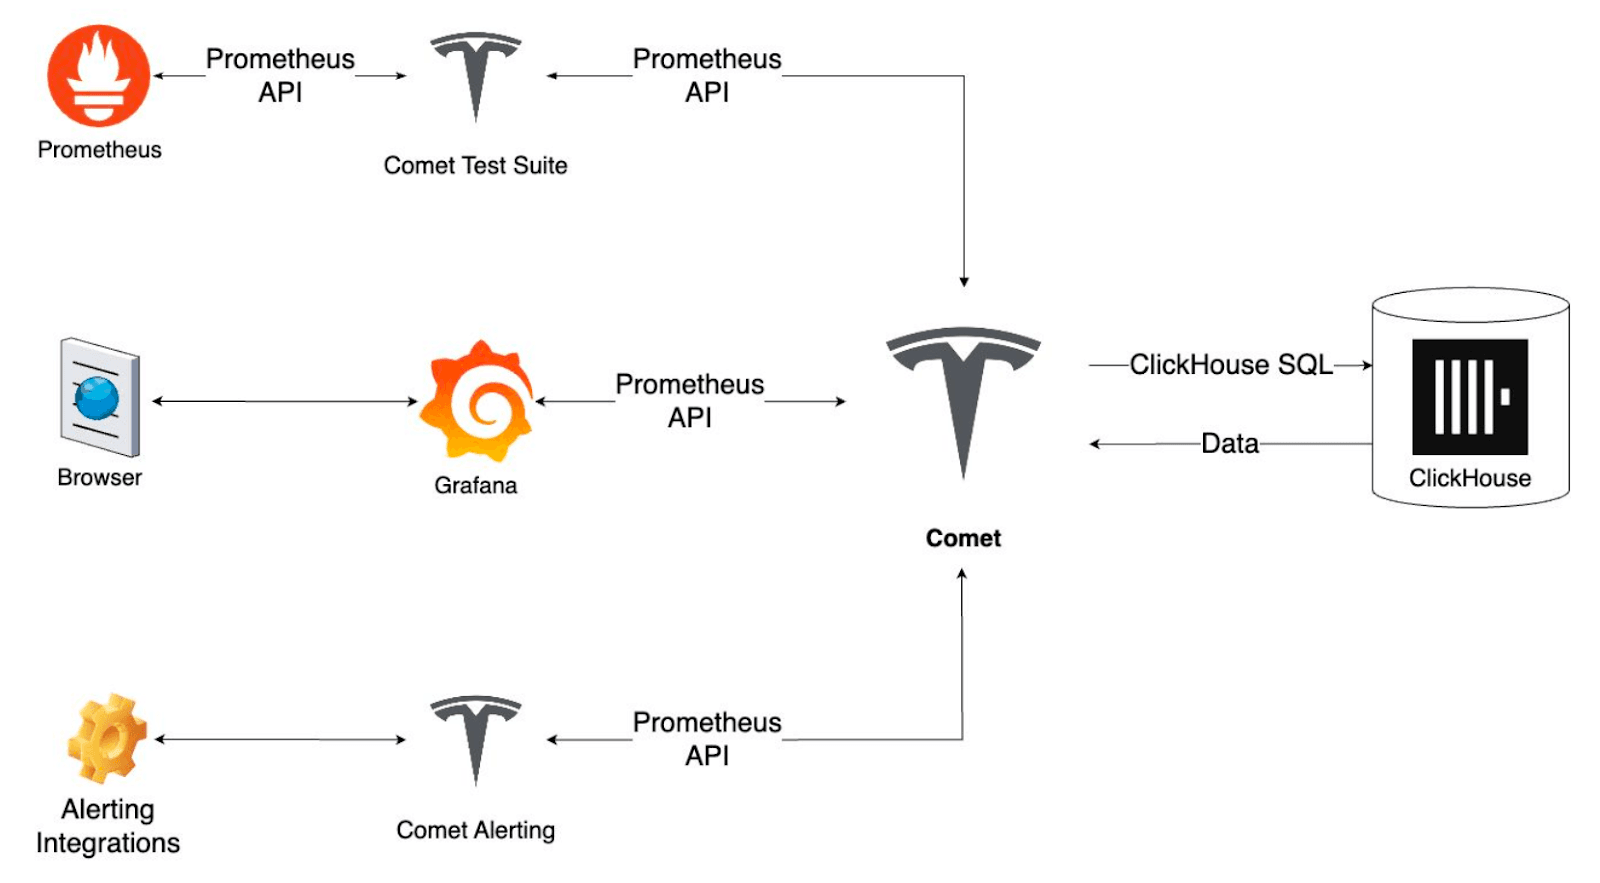
With ClickHouse as the foundation, Alon and the team turned to designing an architecture that could meet Tesla’s demands. The result was Comet, a purpose-built metrics platform with two main pipelines: one for ingesting massive volumes of data, and one for translating and executing PromQL queries on the fly.
On the ingest side, OpenTelemetry collectors deployed across Tesla’s infrastructure send metrics to a Kafka-compatible queue. From there, a set of custom ETL processes (built entirely in-house) transforms the data from OTLP format into structured rows, batches them, and writes them into ClickHouse. The architecture is designed to scale out easily and keep performance steady, even as volumes spike. “It’s a very scalable pipeline,” Alon says.

Comet’s ingest pipeline uses Kafka and OTLP to batch metrics into ClickHouse.
But the real magic happens in the transpiler. This is the engine that converts PromQL into ClickHouse SQL in real time. It’s what makes Comet so powerful. Tesla’s engineers didn’t have to learn a new query language; they can keep writing PromQL just like they always have, while taking full advantage of ClickHouse’s speed and flexibility.

Comet translates PromQL to ClickHouse SQL and maintains compatibility with Grafana and alerting tools.
Once a query runs, Comet formats the results to be byte-for-byte identical to Prometheus’s API responses. That means dashboards, alerts, and all the tools Tesla already uses keep working without any rewrites or special connectors. “Nobody has any idea that this wasn’t just a standard Prometheus environment,” Alon says.
To keep things reliable, a dedicated test suite runs identical PromQL queries against both Prometheus and Comet, ensuring the results are an exact match. The alerting layer also supports the same rules and integrations Tesla was using before, with no rework needed.
Proving the system at scale #
The final tally: over one quadrillion rows ingested—“with not a single hiccup, not a single issue. Memory was flat, CPU consumption was flat. It was just a thing of beauty to behold.”
Today, Comet is ingesting tens of millions of rows per second. “And the system isn’t yet at full load,” Alon says, noting that they’re still onboarding multiple internal teams.
When it comes to time series, Tesla operates at a scale few systems can handle. Each series represents a stream of related metric samples, and over time, Tesla has accumulated tens of billions of them. Since every series contains many individual data points, the total row count is exponentially higher. “That right there is already a problem for systems that compete with Comet,” Alon says. “They’re super-sensitive to high-cardinality time series.”
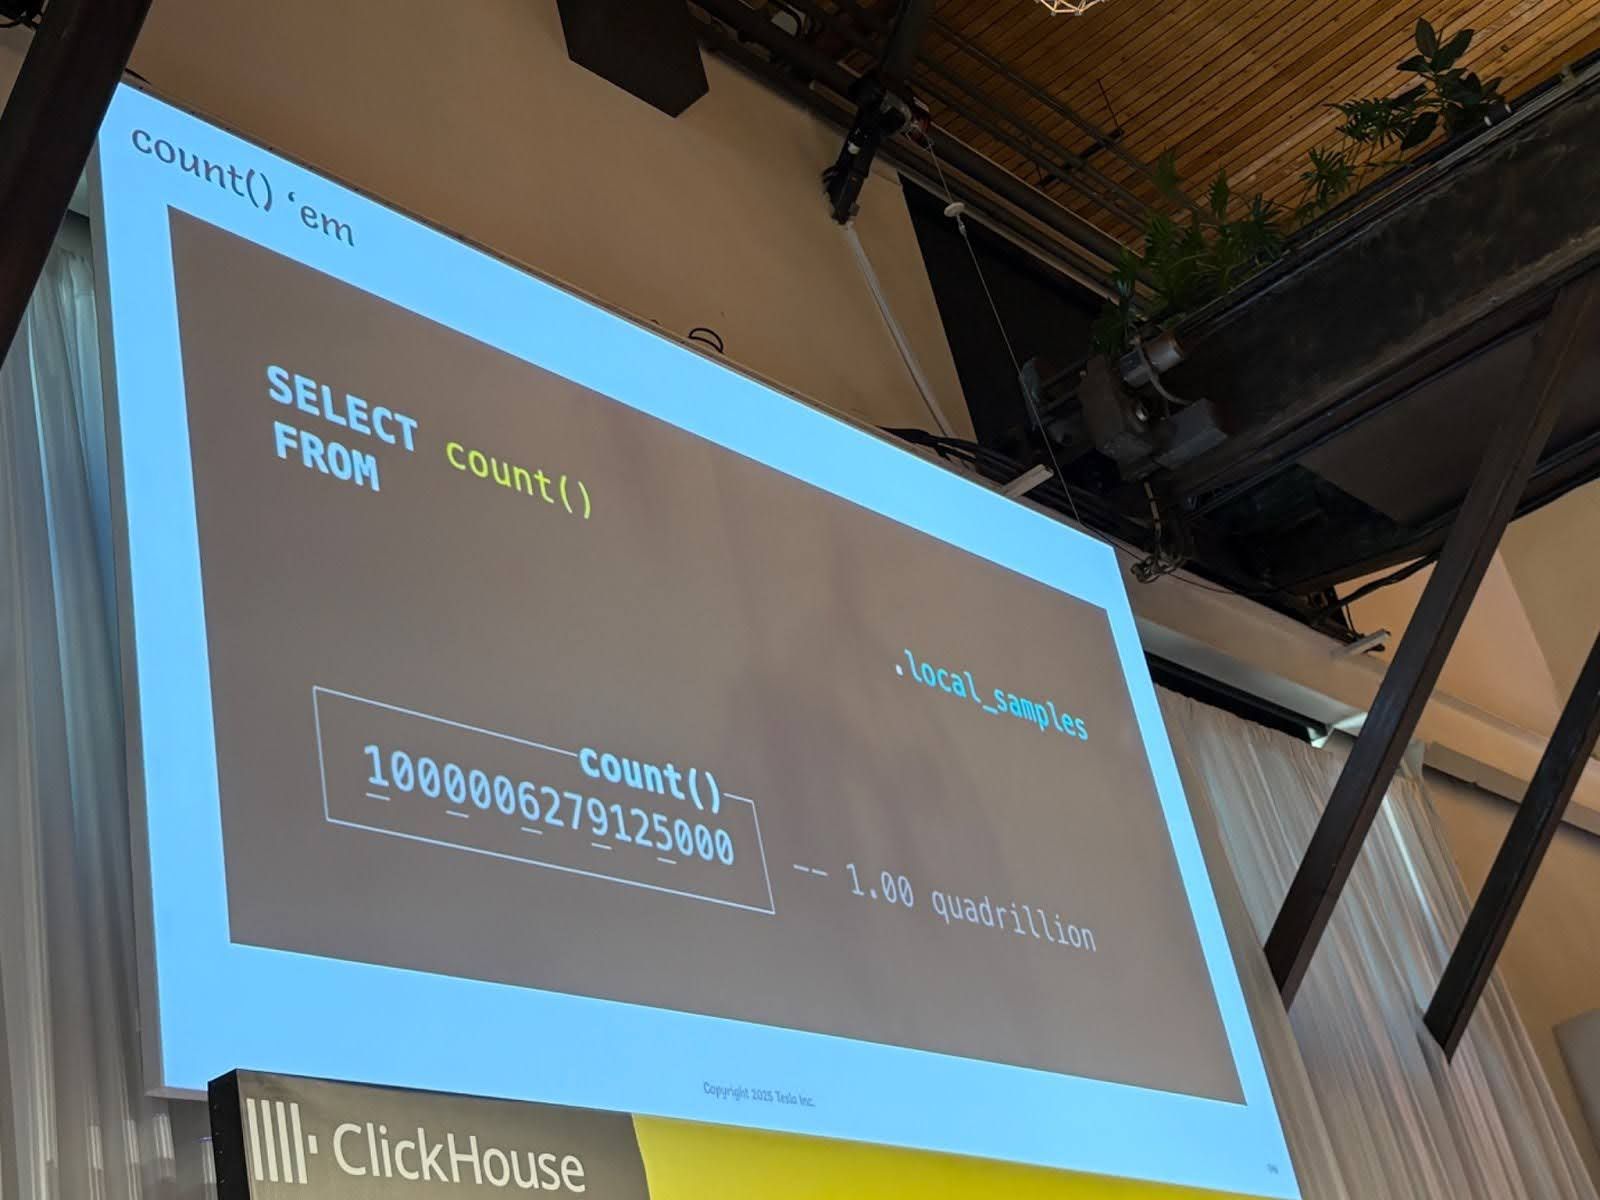
Comet currently stores tens of trillions of samples, and Alon says the team is “very confident it can scale much higher than this.” He’s not exaggerating. To prove it, they pushed ingestion to one billion rows per second and kept it running for 11 days straight. The final tally: over one quadrillion rows ingested—“with not a single hiccup, not a single issue. Memory was flat, CPU consumption was flat. It was just a thing of beauty to behold.”
Discover how ClickHouse powers observability at massive scale with ClickStack.

A count query shows Comet surpassing one quadrillion rows ingested with “not a single hiccup.”
What’s next for Tesla and ClickHouse #
With Comet running smoothly at scale, Tesla is already branching out into new use cases, like distributed tracing. Using the same transpiler-based approach, they’ve added support for TraceQL, letting engineers query trace data just as easily as metrics.
The team is also exploring the idea of open-sourcing Comet. “If we’re able to do that, everyone could take it for a test drive,” Alon says.
Comet is a great example of the innovation happening at Tesla every day. Built on ClickHouse, delivered through PromQL, and designed to provide real-time insights across everything from massive factories to millions of connected vehicles, it gives engineers what they need to manage observability at Tesla scale.
“I want to thank everyone working on ClickHouse,” Alon said at Open House. “You’re building a fantastic product, and it makes my project possible.”
To learn more about ClickHouse and see how it can transform your team’s data operations, try ClickHouse Cloud free for 30 days.


