50.4k
50.4k
Summary
- Uken Games uses ClickHouse as the trace store for its observability platform, monitoring the backend behind its mobile games for millions of players.
- They replaced Datadog with an open-source, ClickHouse-based stack, reducing observability costs by 87%.
- A single ClickHouse node holds all of Uken’s traces in about 170 GB, fed by OpenTelemetry collectors alongside SigNoz, Prometheus, and Grafana.
When you’re building games for millions of players and partnering with the world’s biggest brands, one question tops all others: how do you know if players are having fun?
Uken Games is an independent game studio based in Toronto. Founded in 2009, it has partnered with the likes of Sony Pictures and Apple, built a mobile game embedded in the Tim Hortons app, and sold a game for $100 million to game developer Jam City.
The gaming studio’s success rises and falls on its ability not only to keep players engaged, but also to observe and understand their behavior. Otherwise, players will churn and go to the competition. At a June 2026 ClickHouse meetup in Toronto, Alexei Zenin, who at the time was a Uken software developer, spoke about how they approach answering this question and deciding what to capture.
Alexei divides observability into two layers. On top are the product analytics that reveal whether a game is fun: daily active users, levels completed, in-app purchases, session length, and retention. Beneath that is the foundation he calls tech observability: the CPU, RAM, latency, and error signals that confirm the machinery is working at all.
Under the hood, Uken runs services ranging from cloud saves and inventory to push notifications and leaderboards. “People eagerly compete to be number one on a leaderboard,” Alexei says. “They will send in ‘support tickets’ 24/7, 365 days a year, saying, ‘Someone is cheating, I should be number one.’ And most importantly, they will more likely be paying users.” Having the telemetry to back up and prove who is correct becomes invaluable in these cases.
But monitoring an operation of that scale comes at a cost. We spoke with Alexei about why they moved Uken away from Datadog and how rebuilding its observability stack on ClickHouse helped the company reduce annual costs by 87%.
Challenges with vendor lock-in
For years, Uken monitored its infrastructure—300 containers, 50+ EC2 machines, 100+ disks, dozens of databases, and 100+ service deployments—with Datadog. Alexei says, “It worked well, but even with our best cost reduction efforts, they always kept climbing back unsustainably.”
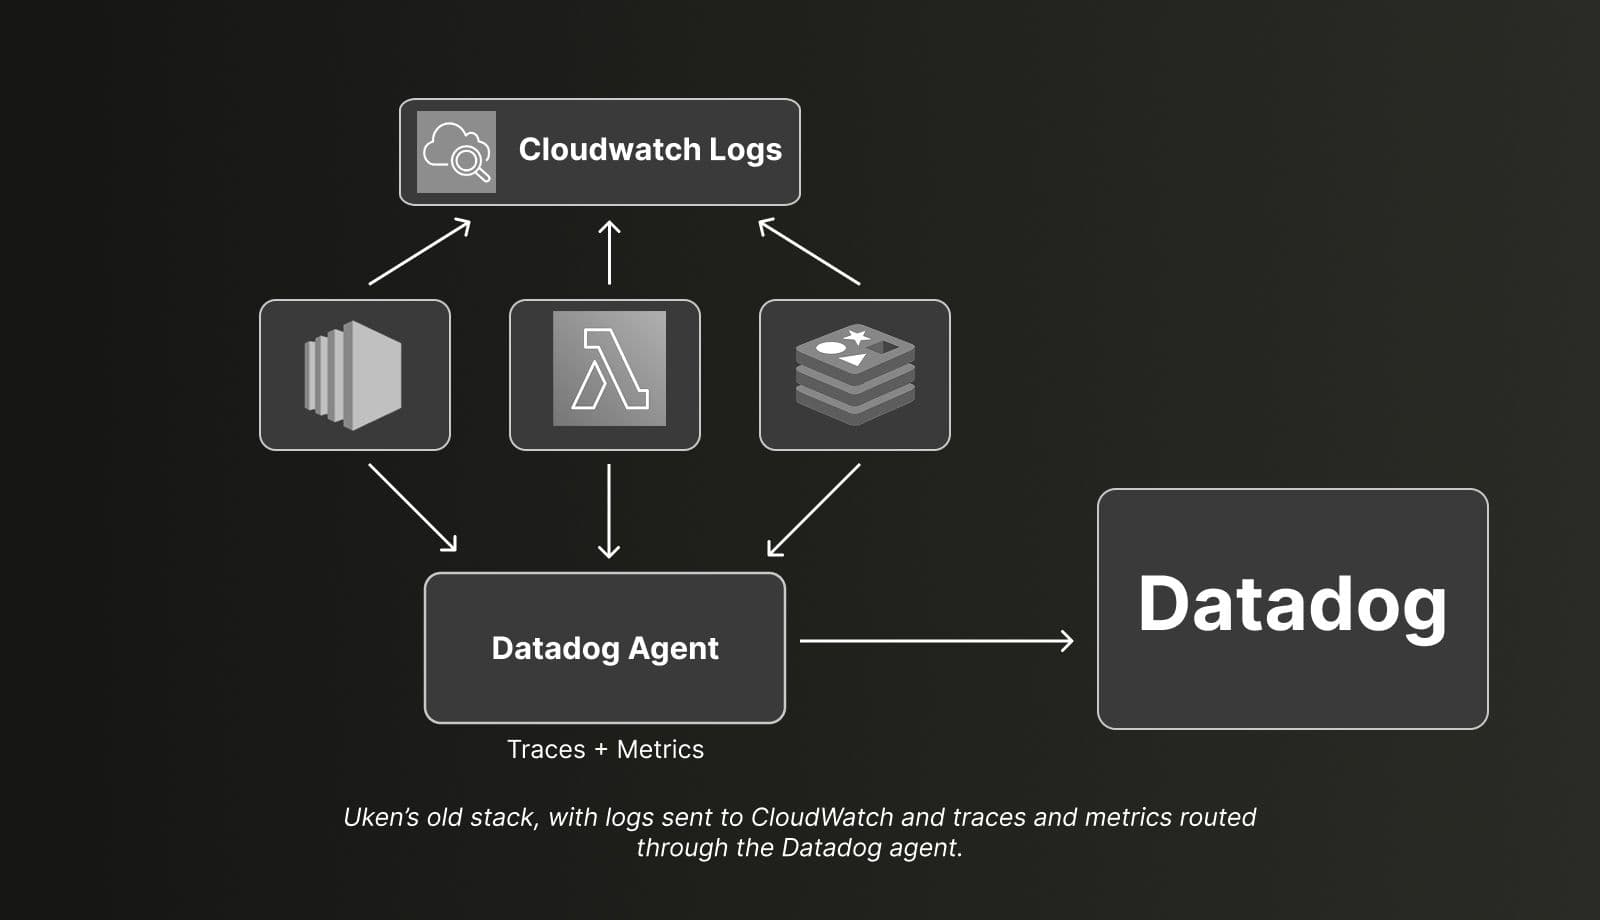
Uken’s old stack, with logs sent to CloudWatch and traces and metrics routed through the Datadog agent.
As an example of the convoluted pricing, he cites Datadog’s container pricing of an additional $0.002 per container per hour, with the option to purchase prepaid containers at $1 per container per month. At the same time, the proprietary Datadog agent was woven so deeply into Uken’s systems, Alexei says, that the vendor held all the leverage. Datadog’s pricing model, for example, started to bleed into architectural decisions, as the price to monitor different technologies, such as serverless versus EC2, would vary significantly.
A new stack built around ClickHouse
The Uken Games team settled on a plan: “Datadog out, open source in.” They had three goals for the new system: lower cost, an open-source-leaning but flexible architecture, and pragmatic feature parity across the three pillars of observability: metrics, traces, and logs.
The data plane of the new system is OpenTelemetry, which Alexei calls “the new de facto standard” for observability. “Essentially, you’re able to collect your different signals and define them in a standard, vendor-agnostic way,” he says. “OpenTelemetry is the standard, and we don’t have to write it to a specific database. That’s a decision done later down in the pipeline, and that you get to control. That vendor lock-in is no longer there. ClickHouse greatly complements that philosophy with its open-source roots.”
Collection runs through OTel collectors—standalone Go processes configured in YAML—deployed in two layers. A lightweight agent runs on each ECS instance alongside the microservices; the application hands off each trace to it via a quick localhost call, where the agent can apply pre-filtering before forwarding to a gateway layer that autoscales, batches, and buffers the writes to ClickHouse. The split keeps instrumentation cheap at the edge—a fast local handoff that barely touches the running application—while concentrating the heavier work of scaling and buffering in one place the team can tune independently.
For traces, it writes to ClickHouse by way of SigNoz, an open-source APM tool built on ClickHouse. “We were able to get the exact same flavor and feel that we had with Datadog,” Alexei says. “You didn’t have to go into the SigNoz tool and say, ‘This is the payment service, show me these graphs.’ That was all automatically inferred from the telemetry for the cookie-cutter things like error rates, P90, and requests per second.”
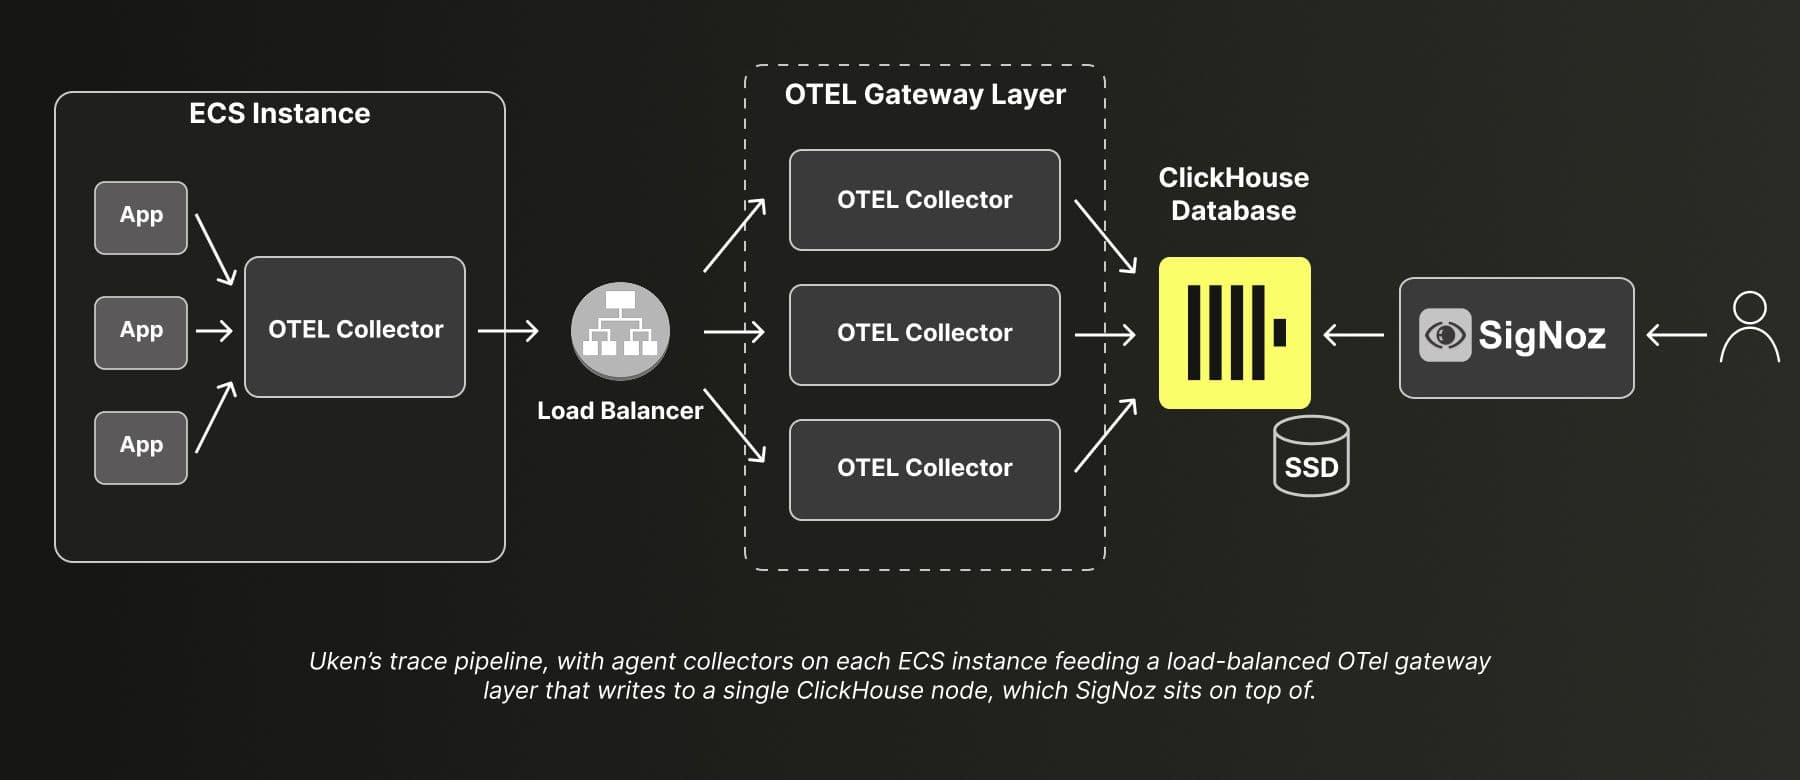
Uken’s trace pipeline, with agent collectors on each ECS instance feeding a load-balanced OTel gateway layer that writes to a single ClickHouse node, which SigNoz sits on top of.
What really impressed Alexei was the database underneath. A single ClickHouse node absorbs every trace the company produces. “All I did was turn ClickHouse on and it just worked, which I loved,” says Alexei. “I had so many other things to re-engineer and build. The fact that it was so easy was a testament to its performance and the engineering behind it.”
Metrics move through the same collector pattern into AWS-managed Prometheus, a deliberate choice since Uken would be on call for whatever it built, and the open Prometheus standard means the team can leave anytime if AWS prices rise. Logs remain in CloudWatch; as Alexei says, “We found it wasn’t the biggest cost sink, and the engineering effort to re-engineer that wasn’t worth it.” Finally, Grafana acts as the connective tissue, querying metrics and closing the loop by alerting Slack and PagerDuty.
The Uken team also automated the alerting itself, writing a custom CloudFormation resource so alerts are provisioned entirely through code. Rather than clicking through Grafana by hand, an engineer defines an alert in YAML, opens a pull request, and, on merge, Jenkins deploys the CloudFormation stack, which provisions the alert in Grafana via its API. “I can instantiate hundreds of alerts through a click of a button,” Alexei says. Grafana now fires roughly 600 queries every minute against ClickHouse, CloudWatch, and Prometheus, escalating to Slack for warnings and PagerDuty for 3 a.m. emergencies.
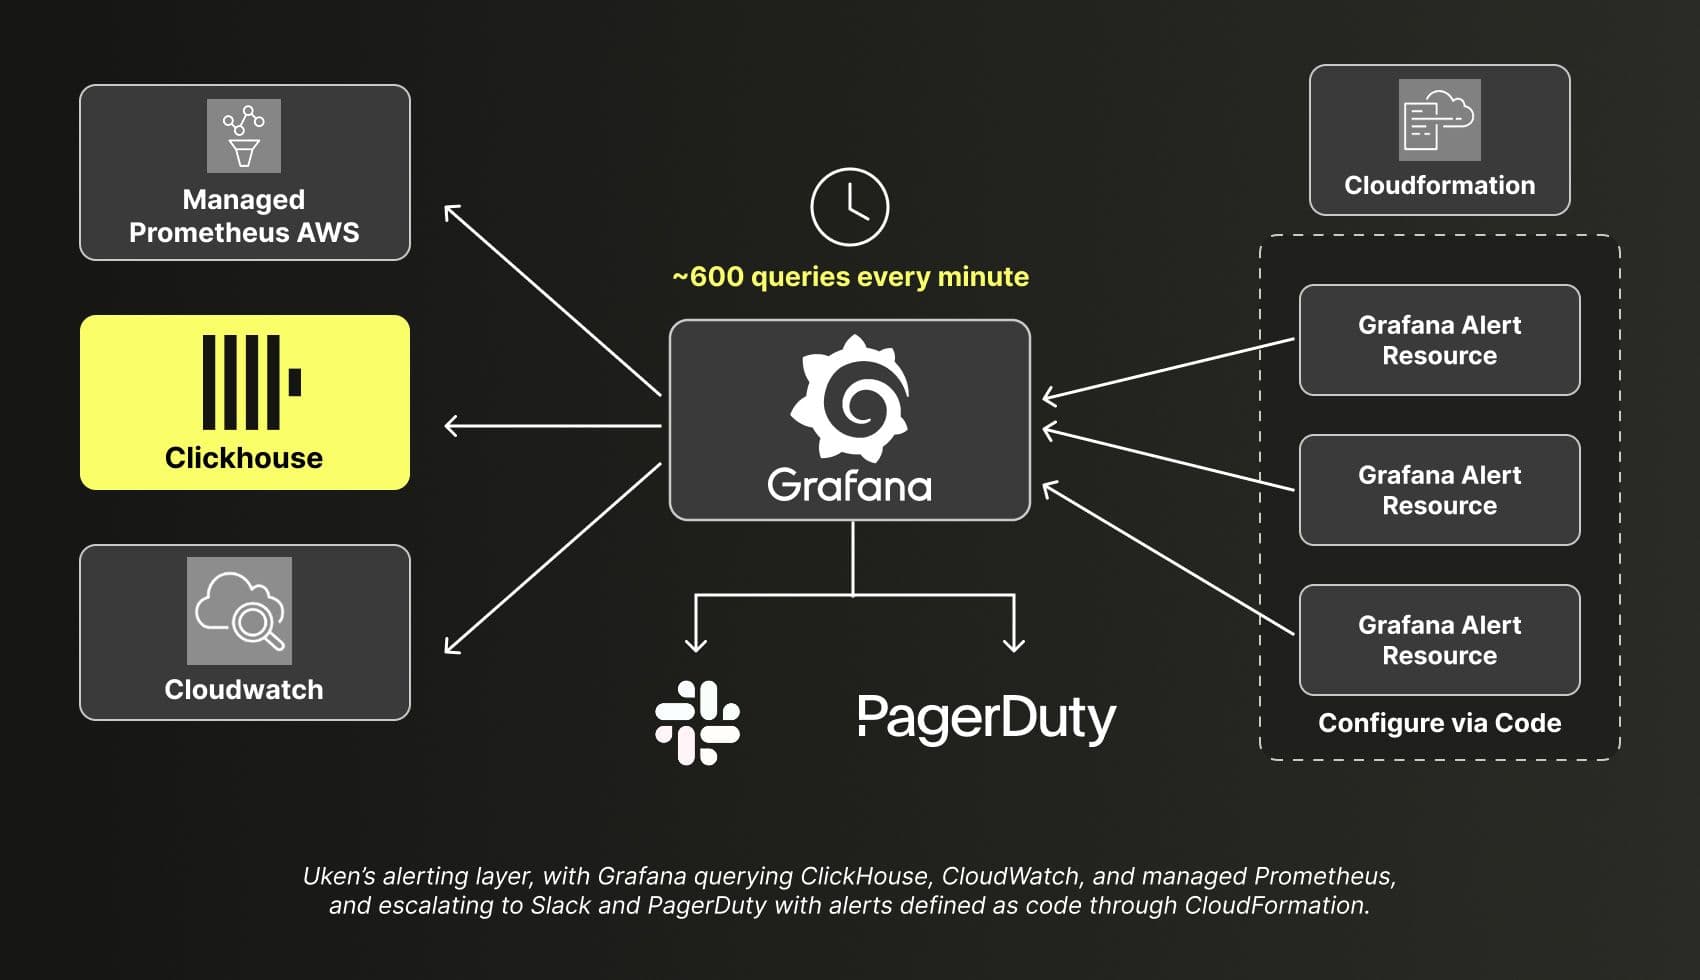
Uken’s alerting layer, with Grafana querying ClickHouse, CloudWatch, and managed Prometheus, and escalating to Slack and PagerDuty with alerts defined as code through CloudFormation.
Lessons learned along the way
For the Uken team, the migration doubled as a forcing function to cut waste. Teams don’t use 95% of the metrics and attributes they collect, Alexei says, adding, “If I could summarize all our learnings: you ain’t going to need it. Just try to drop as much stuff as you can.”
Traces got a similar rethink. “Do you really need to capture every single trace that succeeded,” Alexei asks, “or do you want just a statistically representative sample, like 5–10%?” The approach they settled on is to keep the traces that matter—for example, errors and high-latency requests—take a representative sample of the rest, and drop the noise. To avoid blind spots, they base alerts on aggregated metrics computed without sampling, so trimming data never dulls the signal.
They also resisted over-engineering. “You don’t really need millisecond response times to load a dashboard if you’re a human trying to debug something,” Alexei says. And with no regulatory reason to keep data for years, they capped retention at two weeks. “That helped to reduce costs,” he adds.
The results: one ClickHouse node, 87% cheaper
Today, all of Uken’s traces run on a single ClickHouse node using about 170 GB of disk, fed by several OTel collectors. And there was zero downtime as the new system rolled out, a non-trivial achievement for a live service with millions of players around the world.
“We achieved pragmatic feature parity—being able to explore, visualize, and collect all these metrics and traces and still have a functioning video game,” says Alexei. “I’m proud to say that the open-source solution we built only costs about $12,000 per year to run,” Alexei says. “So almost an order-of-magnitude drop in costs.” Because the savings were so large—nearly 87%—the engineering effort paid for itself in under two years. Along with pragmatic parity with Datadog at a fraction of the price, Uken now fully controls the infrastructure, can avoid vendor lock-in, and can evolve the system according to its future needs.
The case for open-source observability
Alexei closed his talk by noting that the specific stack matters less than the direction of travel. ClickHouse, he says, is a “go-to tool anytime you have lots of data and want to quickly analyze it,” whether used in a hybrid architecture like Uken’s or through all-in-one open-source projects like ClickStack, which Alexei calls “really easy to set up and run.”
His larger point is that open-source observability tooling has matured to the point of being a serious default rather than a compromise. “It’s time as an industry to start thinking about how we get leverage back from vendors,” he says, “and start embracing open-source tooling more to help us gain confidence in building trust for the code that we write.”
Get started with ClickHouse for observability
Build fast, cost-efficient observability on ClickHouse with OpenTelemetry-native logs, metrics, and traces.
Explore ClickStack