The following is a guest blog post by Arnold van Wijnbergen. Arnold van Wijnbergen is an advisor, architect, chief and subject expert in the field of Cloud Native technology, especially around Observability. You can find him almost at every interesting Meetup near Amsterdam, which cover interesting DevSecOps, Cloud Native or Continuous Delivery topics.
Introduction #
In this post, we continue the series on sending log data to ClickHouse Cloud using Fluent Bit. While previous blogs in this series were about Nginx and Kubernetes logs, this post focuses on a threat-hunting use case. In short, we will explain how easy it is to set up advanced log analysis for Microsoft Windows. Our primary data source of interest is the Windows Event Logs, which has significantly evolved over the years. We also look into extending the Windows log collections with a tool called Sysmon from SysInternals. The goal is to identify malicious or anomalous activity and understand how intruders and malware operate on our network. With ClickHouse becoming an increasingly popular backend for receiving logs, this is a match in heaven, especially when using Fluent Bit, which provides a simple and out-of-the-box means of collecting relevant data.
You will learn the basics of Windows Event Logs, how to deploy Fluent Bit for Windows Event log collection, and to create a simple schema for storing the log data in ClickHouse. In addition, you will go through the steps of configuring Sysmon using a community template for setting up high-quality event tracing and simulating certain events using SysmonSimulator, another great Open Source initiative.
Environment #
- Microsoft Windows Server 2022
- Fluent Bit v2.0.6
- Sysmon v14.13
- SysmonSimulator v0.2
For ClickHouse, we recommend trying our serverless ClickHouse Cloud, which has a generous free trial that is sufficient to follow this blog post. The Developer service should be sufficient for the examples in this post. Alternatively, all instructions should be compatible with self-managed versions greater than 22.6. For building the actual visualizations, we will use Grafana Cloud, using the official ClickHouse plugin.
Basics of Windows Event Logs #
Anybody that has worked with Windows knows the all-famous Windows Event Viewer. It’s one of those standard tools you must know when you investigate problems using System, Application, or Security logs. Less well-known is that over the years, the classic model (EVT format) has evolved to a rich ‘winevtlog.h’ (EVTX format) that now has full API support with many advanced improvements. This provides support for application and service-specific log channels used by tools like ‘Sysmon’.
Fluent Bit is a data collector that supports this format and can help us collect helpful logs to analyze and identify potential threats.
Detecting Security Threats With Sysmon Events #
Besides the rich audit policies, most Security Engineers prefer using Sysmon to identify threats. Sysmon, developed by SysInternals (which is now part of Microsoft), delivers advanced kernel capabilities provided by a device driver and a running service. Once installed with a given configuration, it will start monitoring and logging system activities, such as process creation, network connections, registry manipulation, and more. Since it smoothly integrates as a Windows Event Log channel, we can easily transport these logs with Fluent Bit into ClickHouse.
The most recent version can be downloaded here. Just extract the ZIP file in a directory, such as ‘C:\Tools\Sysmon’.
After extraction, you can start the installation with default configuration settings.
sysmon.exe -accepteula -i
Communities bring Open Source together #
The default Sysmon configuration can be considered a foundation. Luckily for us, the community member and Security Expert ‘SwiftOnSecurity’ (Oh my god, not Taylor Swift ;) ) maintains a high-quality event tracing configuration that aligns with the MITRE ATT&CK® matrix techniques. Installation is easy - just download the latest release from github and apply the configuration.
sysmon.exe -c sysmonconfig-export.xml
Collect, process, and insert with Fluent Bit #
Awesome, we have everything set to collect, process, and distribute with Fluent Bit. Fluent Bit is a CNCF-Graduated project and a great lightweight tool based on a simple configuration file that easily helps us set up a data pipeline for processing all generated events. In this scenario, we will choose to set up Fluent Bit with a ZIP package, but we could also decide to use an installer or container image.
Start with downloading the correct installation package, such as the released ZIP package, and extract the archive.
Expand-Archive .\fluent-bit-2.0.6-win64.zip C:\Tools
After expanding the ZIP package, it’s time to extend the default pipeline configuration in conf/fluent-bit.conf, as shown below, to configure our input, filters, and output.
[INPUT]
    Name         winevtlog
    Channels     Microsoft-Windows-Sysmon/Operational,Security
    Interval_Sec 1
    DB           winevtlog.sqlite

[FILTER]
    Name nest
    Match *
    Operation nest
    Wildcard *
    Nest_under log

[OUTPUT]
    name http
    tls on
    match *
    host <>
    port 8443
    URI /?query=INSERT+INTO+<>.<>+FORMAT+JSONEachRow&async_insert=1
    format json_stream
    json_date_key timestamp
    json_date_format epoch
    http_user << For demo purposes you can use ‘default’ >>
    http_passwd <>
For details on the output configuration, specifically the URI parameter, we recommend reading our previous blogs on Fluent Bit here and here.
Note the usage of the async_insert=1 setting in the URI. This enables asynchronous inserts and is an important configuration setting when using Fluent Bit with ClickHouse. See here for further details.
Initiate the ClickHouse service and create a table #
Now that we have our Fluent Bit ready to collect and forward our logs, we need to deploy ClickHouse and create our database. With ClickHouse Cloud, this is easily done with a few clicks by creating a service.
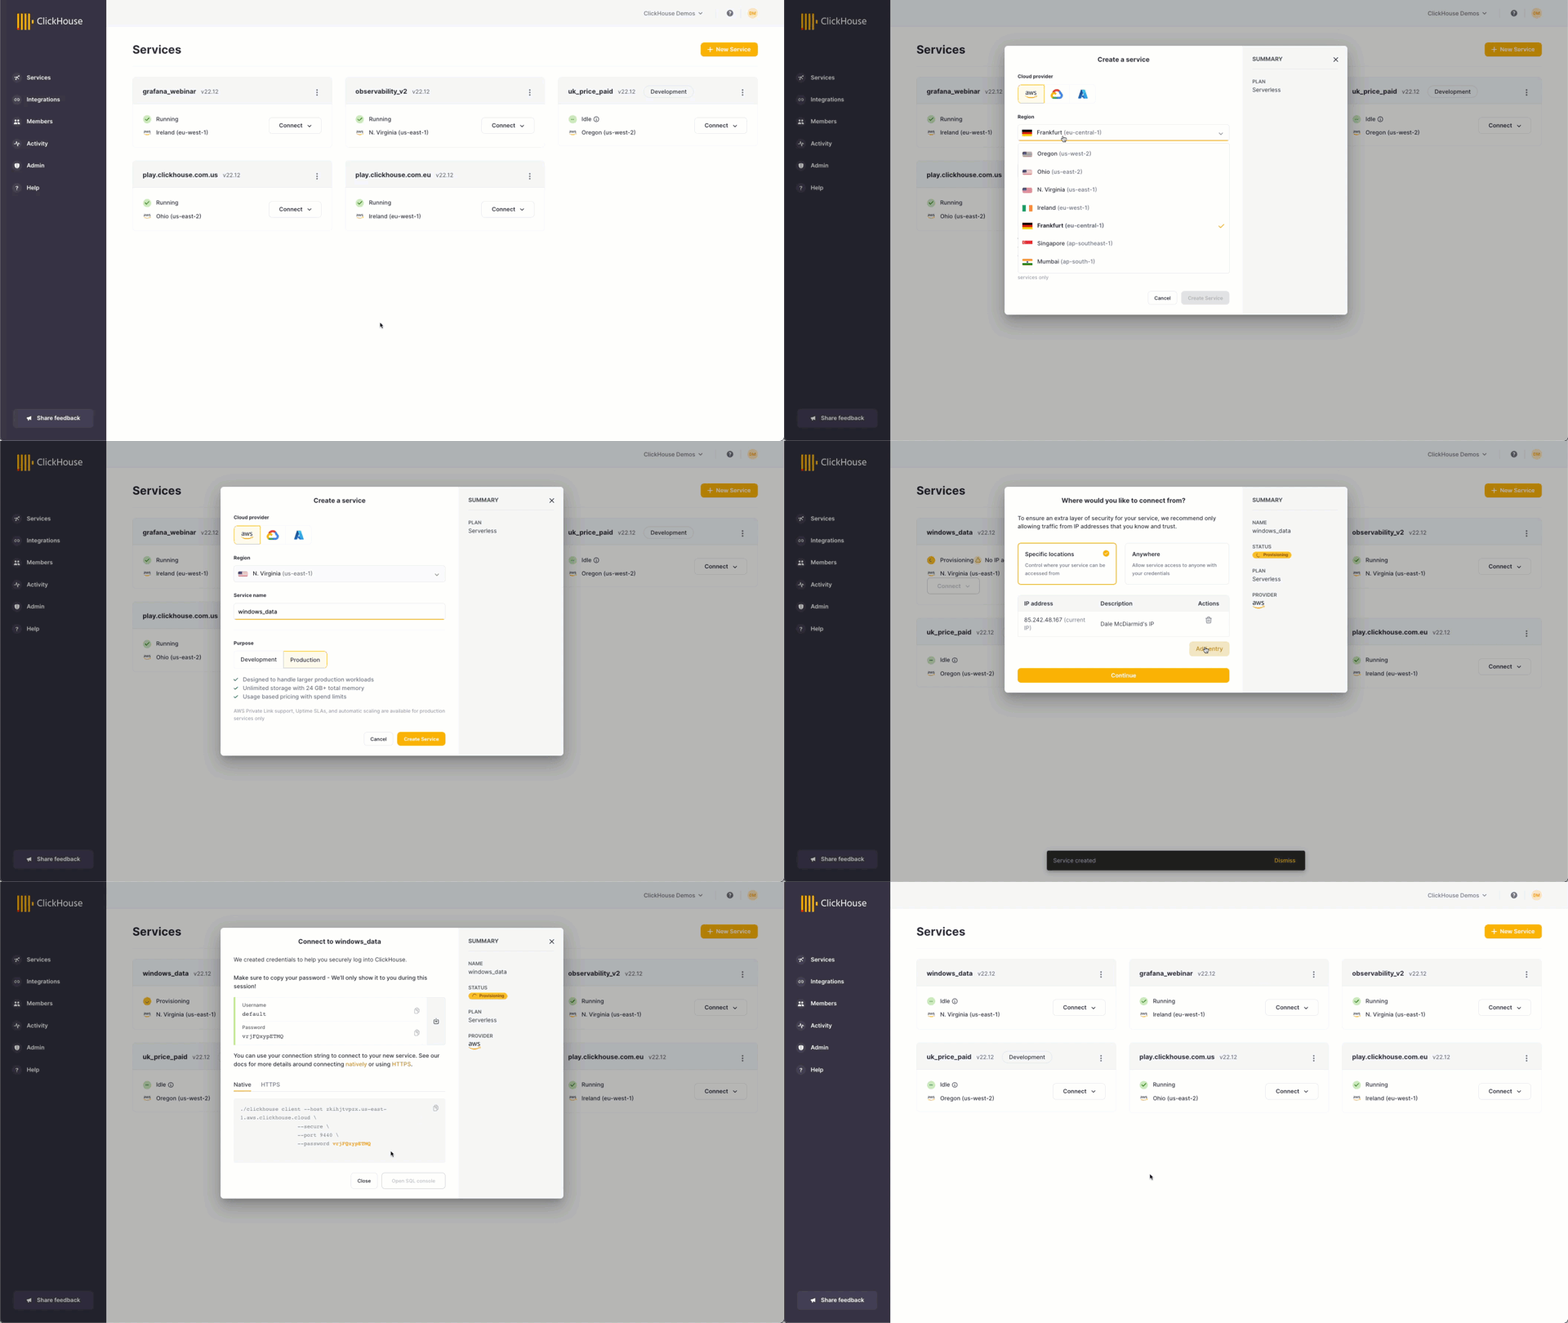
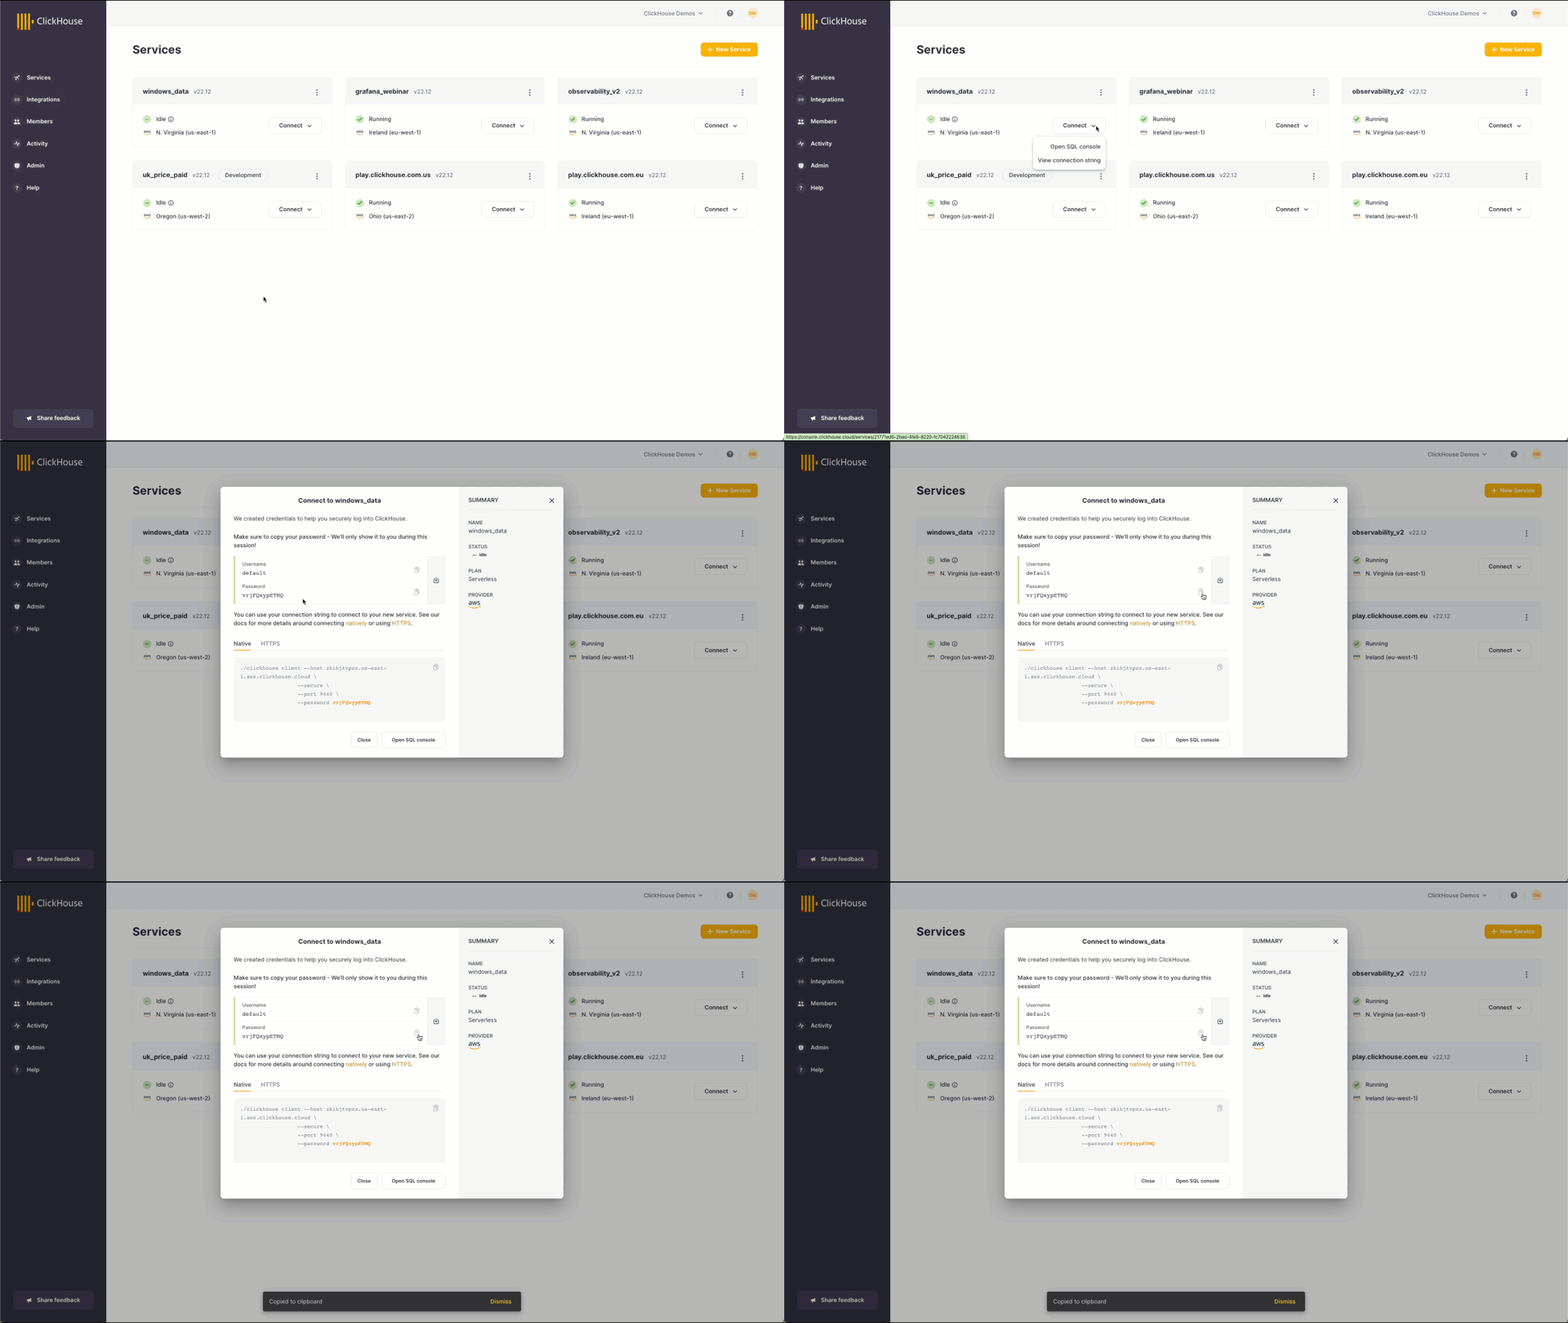
You can see the connection details when your service is created by clicking Connect, ‘View connection string’. Copy these details to a safe place since you will need them later to complete the Fluent Bit Output section.
After creation, we can create the database itself. This requires the ClickHouse Cloud team to enable the JSON object type since this is still experimental. This can be done by opening a support ticket.
If you are running your own self-managed instance, just set the following flag.
SET allow_experimental_object_type = 1
Now create the database.
CREATE DATABASE eventlogs;
When the JSON object type is enabled, you can start configuring the column used to store the Windows Event Log data. Optionally you can map specific fields like the Computername to explicit columns _and use more optimal ClickHouse types such as LowCardinality to improve compression and query performance through reduced I/O. These mapped columns can also be used in the ORDER BY key for the table, which is essential for delivering optimal query performance.
For evaluation purposes, the JSON type is helpful since fields are dynamically mapped. Remember that for production scenarios, you should limit the JSON object type to fewer fields. Keep the expected and frequently used columns well-defined and tuned in your schema to follow best practices. See here as well as our recent blog post on Building an Observability solution for more details.
For now, we will keep things simple by only adding the log column.
CREATE TABLE eventlogs.jsonlogs
(
    timestamp DateTime,
    log JSON
)
Engine = MergeTree ORDER BY tuple()
Note here that we don’t have any columns in the `ORDER BY` key and instead use `tuple()`. We would recommend explicitly declaring columns here that match your access patterns for production.
Now you are ready to fill in the blanks for the Fluent Bit Output section. Don’t forget the previously saved connection details.
[OUTPUT]
    name http
    tls on
    match *
    host <>
    port 8443
    URI /?query=INSERT+INTO+eventlogs.jsonlogs+FORMAT+JSONEachRow&async_insert=1
    format json_stream
    json_date_key timestamp
    json_date_format epoch
    http_user << For demo purposes you can use ‘default’ >>
    http_passwd <>
Visualizing Windows Event Log data #
At the moment, everything is well set to go. We now have to start our Fluent Bit agent. We will use the CLI, but you can also configure it as a service.
./bin/fluent-bit -c conf/fluent-bit.conf
You will notice Fluent Bit opening several connections towards the ClickHouse service. You can use the Cloud SQL Console to see if data is coming into your ClickHouse service.
SELECT * FROM eventlogs.jsonlogs;
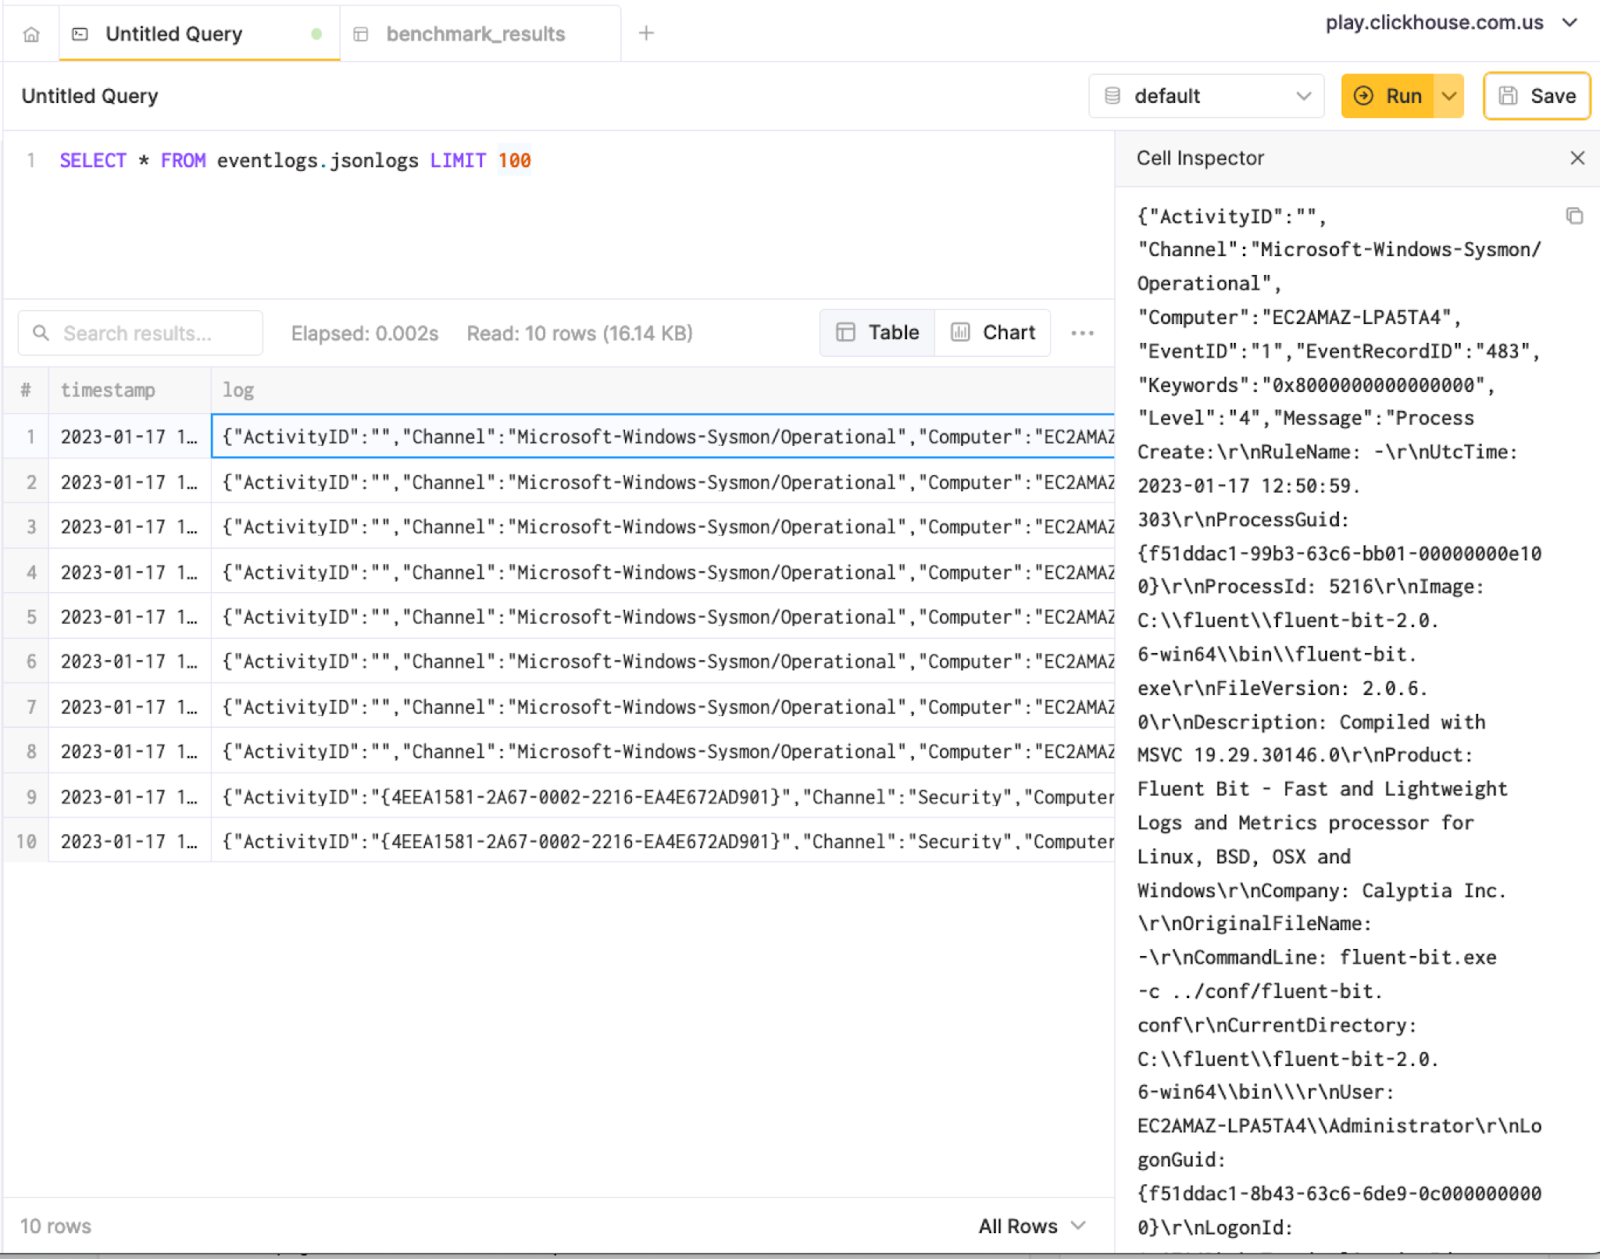
Another great way of querying your data is using the format JSONEachRow option, especially when you are using the ClickHouse client and want to use jq to prettify results from the terminal.
~/clickhouse client --host  --secure --password  --query "SELECT *
FROM eventlogs.jsonlogs
LIMIT 1
FORMAT JSONEachRow" | jq
{
  "timestamp": "2023-01-17 12:51:01",
  "log": {
    "ActivityID": "",
    "Channel": "Microsoft-Windows-Sysmon/Operational",
    "Computer": "EC2AMAZ-LPA5TA4",
    "EventID": 1,
    "EventRecordID": 483,
    "Keywords": "0x8000000000000000",
    "Level": 4,
    "Message": "Process Create:\r\nRuleName: -\r\nUtcTime: 2023-01-17 12:50:59.303\r\nProcessGuid: {f51ddac1-99b3-63c6-bb01-00000000e100}\r\nProcessId: 5216\r\nImage: C:\\fluent\\fluent-bit-2.0.6-win64\\bin\\fluent-bit.exe\r\nFileVersion: 2.0.6.0\r\nDescription: Compiled with MSVC 19.29.30146.0\r\nProduct: Fluent Bit - Fast and Lightweight Logs and Metrics processor for Linux, BSD, OSX and Windows\r\nCompany: Calyptia Inc.\r\nOriginalFileName: -\r\nCommandLine: fluent-bit.exe  -c ../conf/fluent-bit.conf\r\nCurrentDirectory: C:\\fluent\\fluent-bit-2.0.6-win64\\bin\\\r\nUser: EC2AMAZ-LPA5TA4\\Administrator\r\nLogonGuid: {f51ddac1-8b43-63c6-6de9-0c0000000000}\r\nLogonId: 0xCE96D\r\nTerminalSessionId: 2\r\nIntegrityLevel: High\r\nHashes: MD5=4A19C3D18B025F49AA157FD2D360283A,SHA256=7511D65D0FB9FF2590C37E0C7C6150250A78E0D0BAFAB1473A97667AA5ADCA16,IMPHASH=654B204441EFA0776C100878702194C3\r\nParentProcessGuid: {f51ddac1-8d06-63c6-4d01-00000000e100}\r\nParentProcessId: 7720\r\nParentImage: C:\\Windows\\System32\\cmd.exe\r\nParentCommandLine: \"C:\\Windows\\system32\\cmd.exe\" \r\nParentUser: EC2AMAZ-LPA5TA4\\Administrator",
    "Opcode": 0,
    "ProcessID": 7536,
    "ProviderGuid": "{5770385F-C22A-43E0-BF4C-06F5698FFBD9}",
    "ProviderName": "Microsoft-Windows-Sysmon",
    "Qualifiers": "",
    "RelatedActivityID": "",
    "StringInserts": [
      "-",
      "2023-01-17 12:50:59.303",
      "{F51DDAC1-99B3-63C6-BB01-00000000E100}",
      "5216",
      "C:\\fluent\\fluent-bit-2.0.6-win64\\bin\\fluent-bit.exe",
      "2.0.6.0",
      "Compiled with MSVC 19.29.30146.0",
      "Fluent Bit - Fast and Lightweight Logs and Metrics processor for Linux, BSD, OSX and Windows",
      "Calyptia Inc.",
      "-",
      "fluent-bit.exe  -c ../conf/fluent-bit.conf",
      "C:\\fluent\\fluent-bit-2.0.6-win64\\bin\\",
      "EC2AMAZ-LPA5TA4\\Administrator",
      "{F51DDAC1-8B43-63C6-6DE9-0C0000000000}",
      "0xce96d",
      "2",
      "High",
      "MD5=4A19C3D18B025F49AA157FD2D360283A,SHA256=7511D65D0FB9FF2590C37E0C7C6150250A78E0D0BAFAB1473A97667AA5ADCA16,IMPHASH=654B204441EFA0776C100878702194C3",
      "{F51DDAC1-8D06-63C6-4D01-00000000E100}",
      "7720",
      "C:\\Windows\\System32\\cmd.exe",
      "\"C:\\Windows\\system32\\cmd.exe\" ",
      "EC2AMAZ-LPA5TA4\\Administrator"
    ],
    "Task": 1,
    "ThreadID": 7456,
    "TimeCreated": "2023-01-17 12:50:59 +0000",
    "UserID": "S-1-5-18",
    "Version": 5
  }
}
Curious as to the inferred JSON schema? Just run the following SQL query below.
DESCRIBE TABLE eventlogs.jsonlogs
FORMAT Vertical
SETTINGS describe_extend_object_types = 1

Row 1:
──────
name:               timestamp
type:               DateTime
default_type:
default_expression:
comment:
codec_expression:
ttl_expression:

Row 2:
──────
name:               log
type:               Tuple(ActivityID String, Channel String, Computer String, EventID Int16, EventRecordID Int32, Keywords String, Level Int8, Message String, Opcode Int8, ProcessID Int16, ProviderGuid String, ProviderName String, Qualifiers String, RelatedActivityID String, StringInserts Array(String), Task Int16, ThreadID Int16, TimeCreated String, UserID String, Version Int8)
default_type:
default_expression:
comment:
codec_expression:
ttl_expression:

2 rows in set. Elapsed: 0.001 sec.
Grafana for Data Visualization #
We can now start to create data visualizations and dashboards on top of our ClickHouse data. For this, we will leverage the ClickHouse Plugin for Grafana. This plugin is available in Grafana Cloud free tier. You can add this plugin as a data source and use the previous connection details for the actual configuration. You have successfully configured the data source when the ‘Save & Test’ succeeds. This video provides a simple introduction to connecting Grafana to ClickHouse.
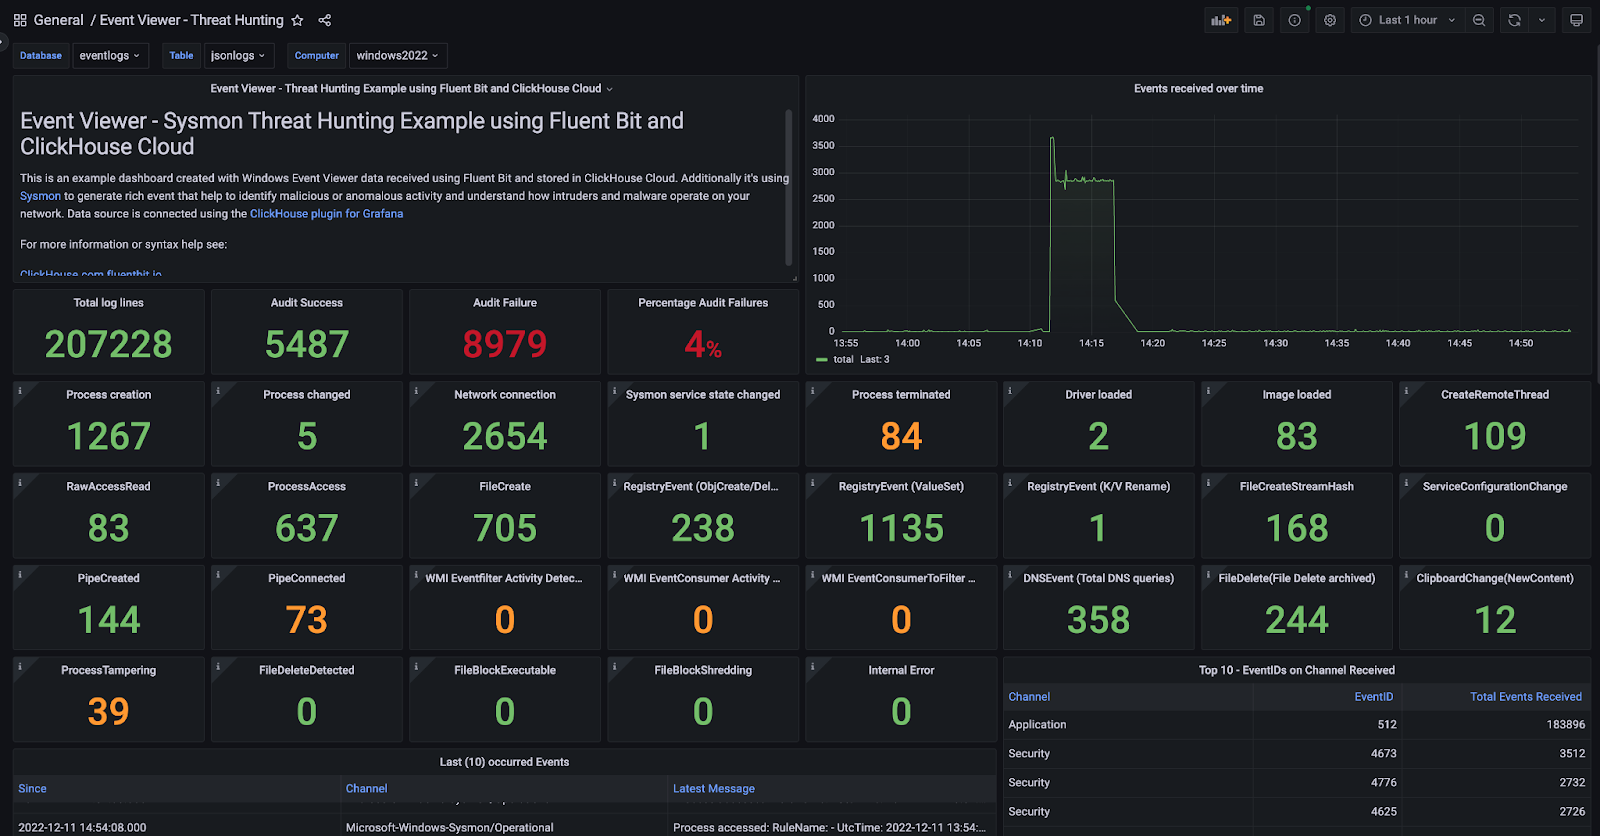
Interesting metrics we want to show include the various counts on Sysmon events that occur for each EventID, e.g., 22 for DNS Events. Another metric of interest can be the percentage of Audit Failures that are logged in the Security channel.
For convenience, I have already created an example dashboard available under my GitHub for download.
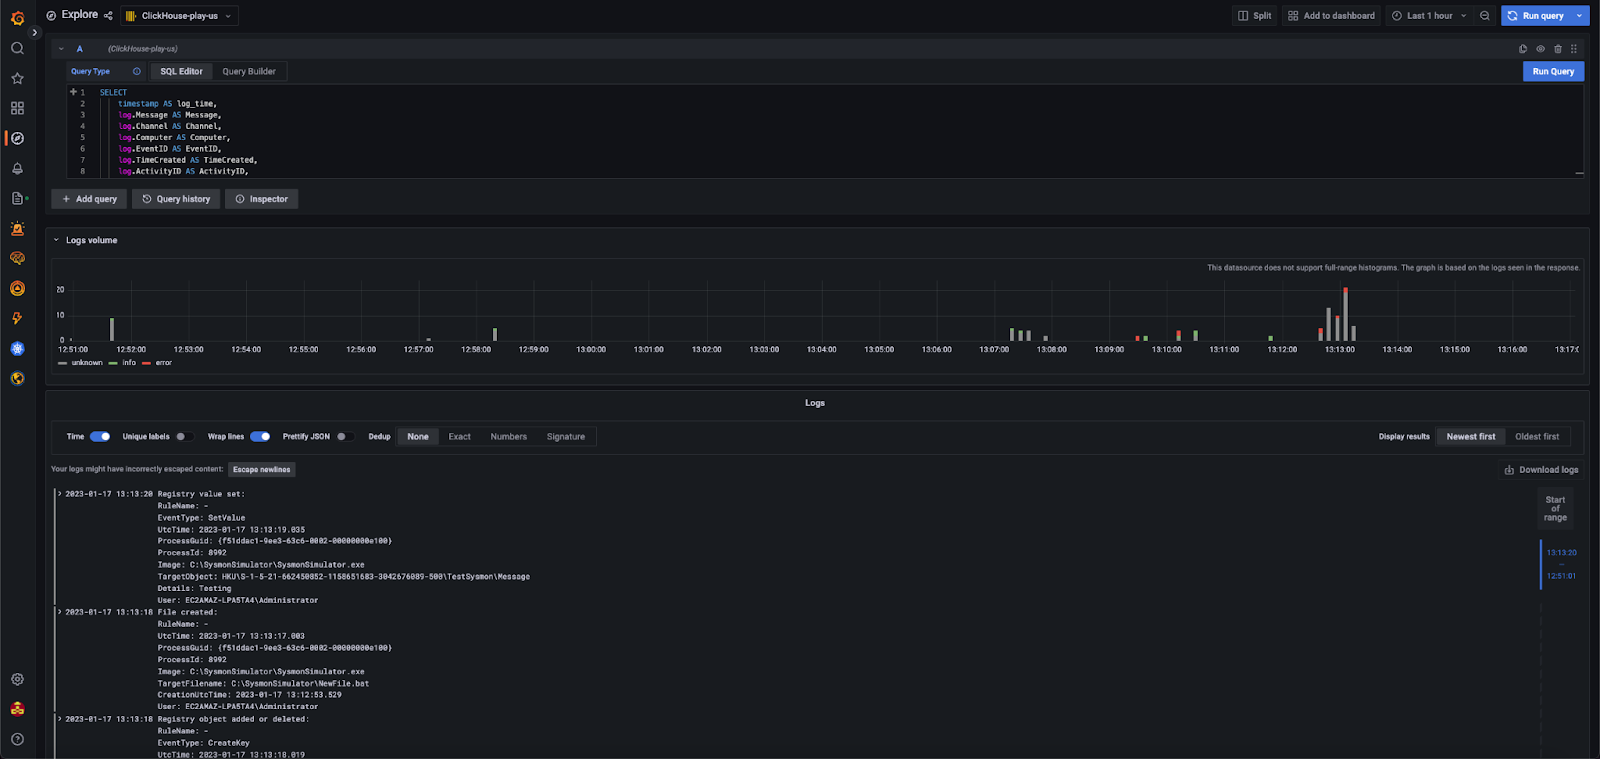
For reference, this is a full example SQL query executed within the Explorer view of Grafana:
SELECT
          timestamp AS log_time,
          log.Message AS Message,
          log.Channel AS Channel,
          log.Computer AS Computer,
          log.EventID AS EventID,
          log.TimeCreated AS TimeCreated,
          log.ActivityID AS ActivityID,
          log.EventRecordID AS EventRecordID,
          log.Keywords AS Keywords,
          log.Level AS SeverityLevel,
          log.Opcode AS OPcode,
          log.ProcessID AS ProcessID,
          log.ProviderGuid AS ProviderGuid,
          log.ProviderName AS ProviderName,
          log.Qualifiers AS Qualifiers,
          log.RelatedActivityID AS RelatedActivityID,
          log.StringInserts AS StringInserts,
          log.Task AS Task,
          log.ThreadID AS ThreadID,
          log.UserID AS UserID,
          log.Version AS Version
FROM eventlogs.jsonlogs LIMIT 100
Testing Stability and Performance #
Simulating threat hunting scenarios using SysmonSimulator #
Watching a dashboard isn’t exciting when no data or potential security threats appear. That’s why we will use SysmonSimulator, created by Scarred Monk. The binary for this tool can be downloaded from here.
This simulator works together with Sysmon to simulate several potential security threats. For optimal experience, you can use the configuration file provided in the SysmonSimulator repository.
Please take notice that Microsoft Defender can block this tool as a potential risk, so you may have to accept the risk; otherwise, download and execution is blocked.
sysmon.exe -c SysmonSimulatorconfig.xml
Starting the simulation is simple. Just execute with the flag ‘-all’. Again for convenience, you can use the following PowerShell one-liner.
While ($True -eq “True”) { ./SysmonSimulator -all}
After we have started the simulator process, our dashboard in Grafana will be populated with more interesting data.
Scaling #
To validate the performance of our solution, we have used another tool to ingest a high load of Windows Event Logs. When using Linux logs, we prefer simulation using lignator to generate logs, but in this case, we need direct ingestion into the Windows Event Log.
To automate this use case, we make use of a Github available tool called goeventgen, created by Andrew Krohu. As an input, you may want to use a large collection of log lines to process. This collection is around 28 GB and is perfect for performance testing purposes.
Just download the released executable and execute the following command once the Windows.log has been extracted.
.\goeventgen-amd64.exe -source TestSource -f .\Windows.log
After execution, you will get a summary of the duration and total events processed. On our test instance, we got around 3000 eps, which is great for just one small Windows 2022 VM. The biggest bottleneck here was the available CPU resources on the host VM. This represents a very small throughput for ClickHouse and Fluent Bit, which are both capable of scaling to millions of events per second.
Conclusion #
This blog shows how easy it can be to set up a Windows security stack with ClickHouse, Grafana, and tools such as Fluent Bit and Sysmon. We have introduced the dynamic field mapping capability of ClickHouse using the JSON type and have explained in which situations this can be helpful. Besides the setup, we have performed a simulation of potential security threats using SysmonSimulator and finally used Grafana to visualize and dig into the details. Additionally, we executed a large stream of events to validate the performance and stability. During this exercise, we didn’t even hit the limit of ClickHouse or Fluent Bit but rather the Windows instance resources.
Calculating the figures, we claim around an average of 14 bytes for each event, whereby storing a Windows Event Log claims 200 bytes. This is a compression of 1/14 and is consistent with other tests. This shows ClickHouse is really efficient in storing logs with potentially significant cost savings!
In short, we can conclude ClickHouse is very efficient in storage and performant column-orientated DB for storing logs and integrates well with other tools with minimal complexity.


