
This blog post is part of a series:
Introduction
ClickHouse has become a popular backend for receiving logs after users like Uber incorporated the blazing-fast database into their infrastructure. One common challenge with all data stores is how to ingest data from various sources. Thankfully this is a challenge that the Cloud Native Computing Foundation (CNCF) project Fluent Bit has solved for many backends, such as Amazon. Fluent Bit is a super fast, lightweight, and highly scalable logging and metrics processor and forwarder.
In this blog, we walk through how to set up Fluent Bit to route logs to Clickhouse in under 5 minutes. In our next post, we will showcase an everyday observability use case of collecting and enriching logs from Kubernetes.
Environment
- Ubuntu 20.04 LTS running both Clickhouse and Calypita Fluent Bit (LTS version of Fluent Bit provided by the creators)
- Fluent Bit v1.9.9
For ClickHouse, we recommend trying our serverless ClickHouse Cloud, which has a generous free trial that is more than sufficient to follow this blog post. Alternatively, all instructions should be compatible with self-managed versions greater than 22.6.
Creating the ClickHouse Database and Tables
Our first step is to create a database within ClickHouse where we will store the logs. We can run the following command via the clickhouse-client or via your ClickHouse Cloud console:
CREATE DATABASE fluentbit
Note that the JSON type is currently experimental in ClickHouse core database and not enabled by default in ClickHouse Cloud. Should users wish to use this capability in ClickHouse Cloud, they can open a support case once they’ve started a service.
After creating the database, we are required to enable the JSON object type via the experimental flag allow_experimental_object_type:
SET allow_experimental_object_type = 1
Once set, we can create the table with the provided structure. This creates a field log that contains all the JSON objects.
CREATE TABLE fluentbit.jsonlogs
(
    timestamp DateTime,
    log JSON
)
Engine = MergeTree ORDER BY tuple()
Once created, we can configure Fluent Bit to send data.
Configuring Fluent Bit on Ubuntu
The instructions below use the open source version of Fluent Bit. If you are interested in using an LTS version with additional premium features, you find more information on Calyptia’s offering here.
For example purposes, we send basic Nginx access logs and assume the user is using an Ubuntu system. For other systems, instructions are available here:
curl https://raw.githubusercontent.com/fluent/fluent-bit/master/install.sh | shThis will install Fluent Bit to /opt/fluent-bit. If you need some test Nginx Access Logs, you can download a series of mock access logs from here and place them under /var/log/access.log.
sudo wget -O /var/log/access.log https://gist.githubusercontent.com/agup006/b936d299c11b60283bdaf05a12e334eb/raw/b87905c7ea1e21745dba87233666135ee61d0087/apache-access.log
sudo chmod a+r /var/log/access.logAs a high-level intro to Fluent Bit configuration we designate a set of Inputs, Filters, and Outputs. On the Input side, we are going to specify the tail plugin which will read the access logs and parse in with a well-known format.
Once these logs are parsed, we will then use a Fluent Bit Nest Filter to nest all fields under a field “log”, allowing ClickHouse to recognize the field where the JSON object will be housed.
Last but not least, we will use Fluent Bit’s HTTP output plugin to route these logs to ClickHouse with a few parameters. You can see from the URI that we are using the database and table that we created earlier.
Fluent Bit configuration
Note: We also need to specify the default user’s password for Fluent Bit to make use of HTTP Basic Authentication. For ClickHouse Cloud we specify port 8443 and enable SSL via the tls on parameter. Users using self-managed ClickHouse may need to use the port 8143 if your cluster is not secure. You will also need to explicitly set the use of http, i.e. tls off parameter.
Append the following configuration file to /etc/fluent-bit/fluent-bit.conf.
[INPUT]
    name tail
    path /var/log/access.log
    read_from_head true
    parser nginx_access

[FILTER]
    Name nest
    Match *
    Operation nest
    Wildcard *
    Nest_under log

[OUTPUT]
    name http
    tls on
    match *
    host
    port 8443
    URI /?query=INSERT+INTO+fluentbit.jsonlogs+FORMAT+JSONEachRow
    format json_stream
    json_date_key timestamp
    json_date_format epoch
    http_user default
    http_passwd
If using ClickHouse Cloud, your credentials will be available when you create your cluster i.e.

Run Fluent Bit, and send the logs to ClickHouse, with the following command:
/opt/fluent-bit/bin/fluent-bit -c /etc/fluent-bit/fluent-bit.confSearching the logs in ClickHouse
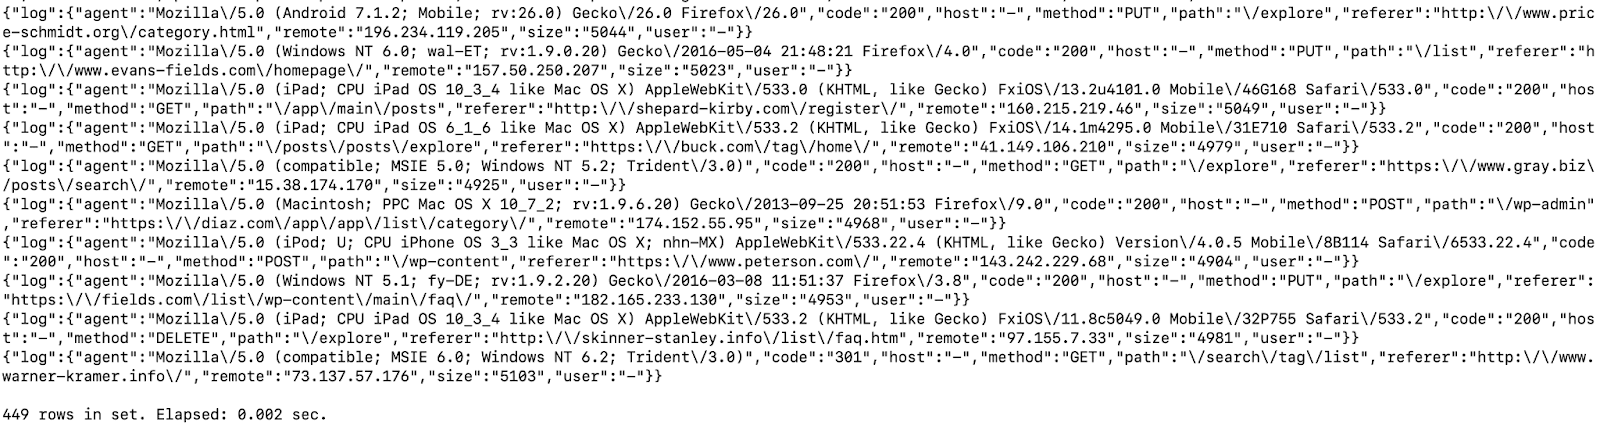
Within ClickHouse we can run the following to see our logs in action. Without the FORMAT option we only see the values of our JSON.
SET output_format_json_named_tuples_as_objects = 1

SELECT * FROM fluentbit.jsonlogs FORMAT JSONEachRow
A benefit with these logs now in ClickHouse is we can run adhoc queries for analysis without having to designate any schema. Using the DESCRIBE command, with the setting describe_extend_object_types, we can discover the available fields in our jsonlogs table.
DESCRIBE TABLE fluentbit.jsonlogs
FORMAT Vertical
SETTINGS describe_extend_object_types = 1

Row 1:
──────
name:               timestamp
type:               DateTime
default_type:
default_expression:
comment:
codec_expression:
ttl_expression:

Row 2:
──────
name:               log
type:               Tuple(agent String, code String, host String, method String, path String, referer String, remote String, size String, user String)
default_type:
default_expression:
comment:
codec_expression:
ttl_expression:

2 rows in set. Elapsed: 0.001 sec.
We can run the following command to understand how many error codes are returned - note how we access the code field via its dot delimited json path.
SELECT
    count(log.code) AS count,
    log.code AS code
FROM fluentbit.jsonlogs
GROUP BY log.code

┌─count─┬─code─┐
│    26 │ 301  │
│     9 │ 500  │
│   397 │ 200  │
│    17 │ 404  │
└───────┴──────┘

4 rows in set. Elapsed: 0.003 sec.
For users interested in visualizing these logs, we recommend Grafana and the officially supported ClickHouse plugin. Further details can be found here with an example of visualizing JSON logs at the end of this earlier post. Below we show the above data in the Logs view of Grafana.
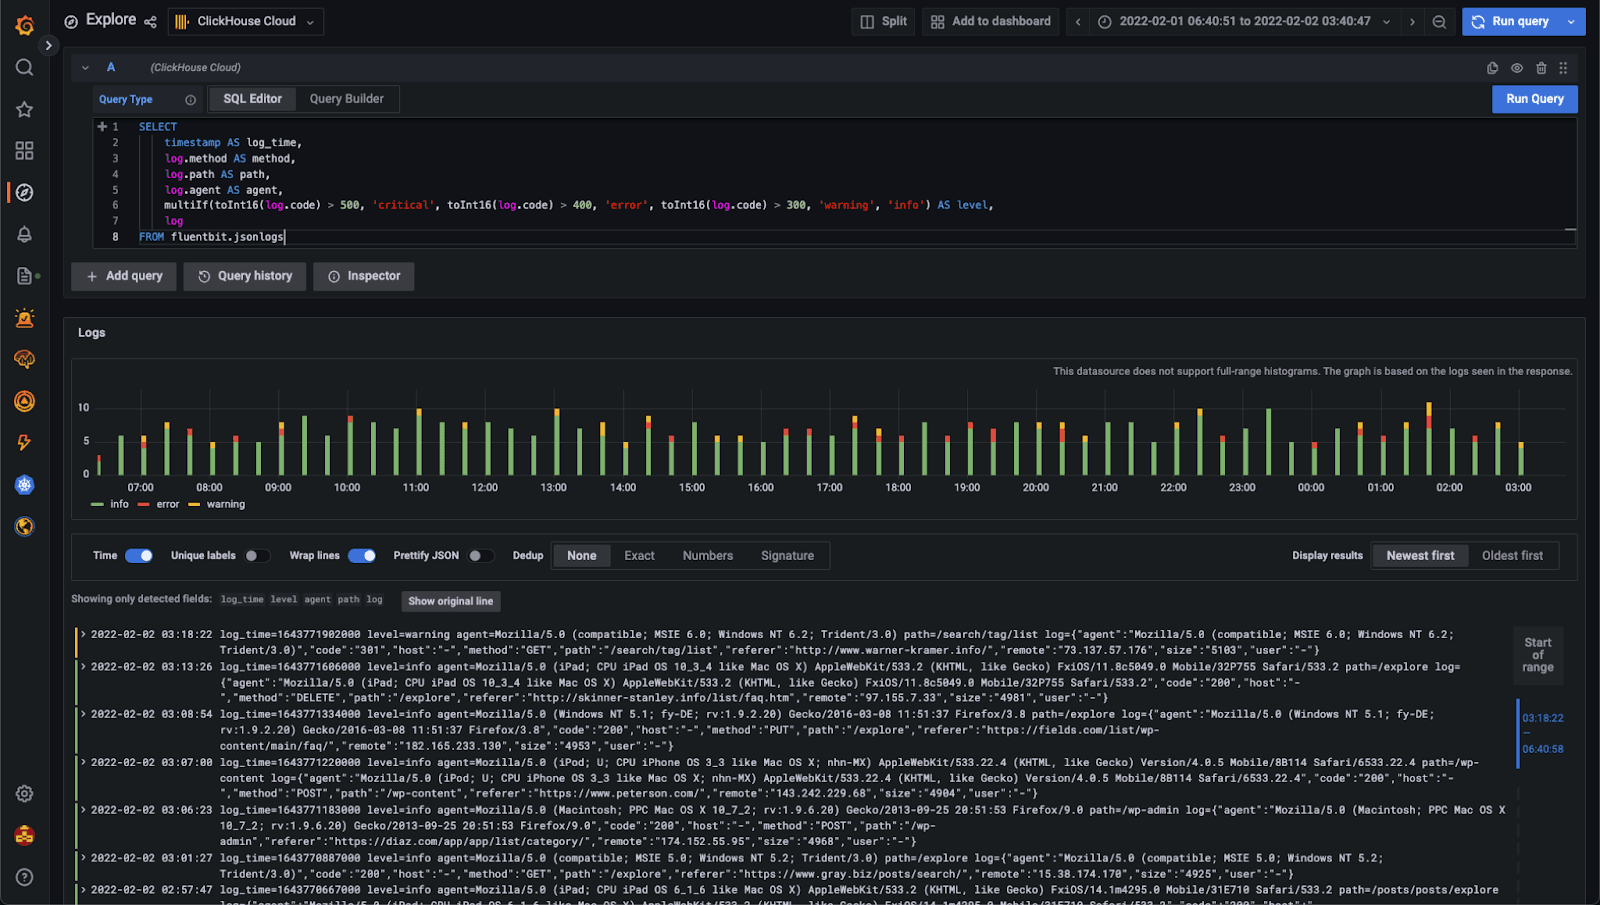
Note: ensure your Grafana instance has access to your ClickHouse Cloud service with appropriate IP Access List rules.
Summary
In this post we have loaded Nginx logs into ClickHouse using Fluent Bit and the JSON type. In the next post in this series, we will explore a common Observability use case of collecting Kubernetes Logs.
If you’re enthusiastic about the latest technologies and are passionate about Open Source, we’re currently hiring for our integrations team and would love to hear from you.


