TLDR
Observability at scale: Our internal system grew from 19 PiB to 100 PB of uncompressed logs and from ~40 trillion to 500 trillion rows.
Efficiency breakthrough: We absorbed a 20× surge in event volume using under 10% of the CPU previously needed.
OTel pitfalls: The required parsing and marshalling of events in OpenTelemetry proved a bottleneck and didn’t scale - our custom pipeline addressed this.
Introducing HyperDX: ClickHouse-native observability UI for seamless exploration, correlation, and root-cause analysis with Lucene-like syntax.
Introduction
About a year ago, we shared the story of LogHouse - our internal logging platform built to monitor ClickHouse Cloud. At the time, it managed what felt like a massive 19 PiB of data. More than just solving our observability challenges, LogHouse also saved us millions by replacing an increasingly unsustainable Datadog bill. The response to that post was overwhelming. It was clear our experience resonated with others facing similar struggles with traditional observability vendors and underscored just how critical effective data management is at scale.
A year later, LogHouse has grown beyond anything we anticipated and is now storing over 100 petabytes of uncompressed data across nearly 500 trillion rows. That kind of scale forced a series of architectural changes, new tools, and hard-earned lessons that we felt were worth sharing - not least that OpenTelemetry (OTel) isn’t always the panacea of Observability (though we still love it), and that sometimes custom pipelines are essential.
In our case, this shift enabled us to handle a 20x increase in event volume using less than 10% of the CPU for our most critical data source - a transformation with massive implications for cost and efficiency.
Other parts of our stack have also changed, not least due to the ClickHouse acquisition of HyperDX. Not only did this give us a first-party ClickHouse-native UI, but it also led to the creation of ClickStack - an opinionated, end-to-end observability stack built around ClickHouse. With HyperDX, we’ve started transitioning away from our Grafana-based custom UI, moving toward a more integrated experience for exploration, correlation, and root cause analysis.
As more teams adopt ClickHouse for observability and realize just how much they can store and query affordably, we hope these insights prove as useful as our first post. If you’re curious about this journey, when and where OTel is appropriate, and how we scaled a log pipeline to 100PB…read on.
Download ClickStack
No setup headaches - run the world’s fastest and most scalable open source observability stack, in seconds.
Try nowBeyond general purpose: evolving observability at scale
Over the past year, our approach to observability has undergone a significant transformation. We've continued to leverage OpenTelemetry to gather general-purpose logs, but as our systems have scaled, we began to reach its limits. While OTel remains a valuable part of our toolkit, it couldn't fully deliver the performance and precision we needed for our most demanding workloads. This prompted us to develop purpose-built tools tailored to our critical systems and rethink where generic solutions truly fit. Along the way, we've broadened the range of data we collect and revamped how we present insights to engineers.
A new frontier of scale
When we last wrote about LogHouse, we were proud to handle 19 PiB of uncompressed data across 37 trillion rows. Today, those numbers feel like a distant memory. LogHouse now stores over 100 petabytes of uncompressed data, representing nearly 500 trillion rows. Here's a quick look at the breakdown:
| System | Uncompressed Size | Stored rows |
|---|---|---|
| SysEx | 93.6 PB | 431 Trillion |
| OTel | 14.5 PB | 16.7 Trillion |
These numbers also tell a story. In our original post, 100% of our telemetry flowed through OpenTelemetry, with every log line collected via the same general-purpose pipeline. But as the scale and complexity of our data grew, so did the need for specialization. While our total volume has grown more than 5x, the breakdown reveals a deliberate shift in strategy: today, the vast majority of our data comes from “SysEx”, a new purpose-built exporter we developed to handle high-throughput, high-fidelity system logs from ClickHouse itself. This shift marks a turning point in how we think about observability pipelines - and brings us to our first key topic.
We hope the following helps comprehend the scale at which LogHouse operates.
OpenTelemetry's efficiency challenges at extreme scale
Initially, we used OpenTelemetry (OTel) for all log collection. It was a great starting point and an established industry standard which allowed us to quickly establish a baseline where every pod in our Kubernetes environment shipped logs to ClickHouse. However, as we scaled, we identified two key reasons to build a specialized tool for shipping our core ClickHouse server telemetry.
First, while OTel capably captured the ClickHouse text log via stdout, this represents only a narrow slice of the telemetry ClickHouse exposes. Any ClickHouse expert knows that the real gold lies in its system tables - a rich, structured collection of logs, metrics, and operational insights that go far beyond what’s printed to standard output. These tables capture everything from query execution details to disk I/O and background task states, and unlike ephemeral logs, they can be retained indefinitely within a cluster. For both real-time debugging and historical analysis, this data is invaluable. We wanted all of it in LogHouse.
Second, the inefficiency of the OTel pipeline for this specific task became obvious as we scaled.
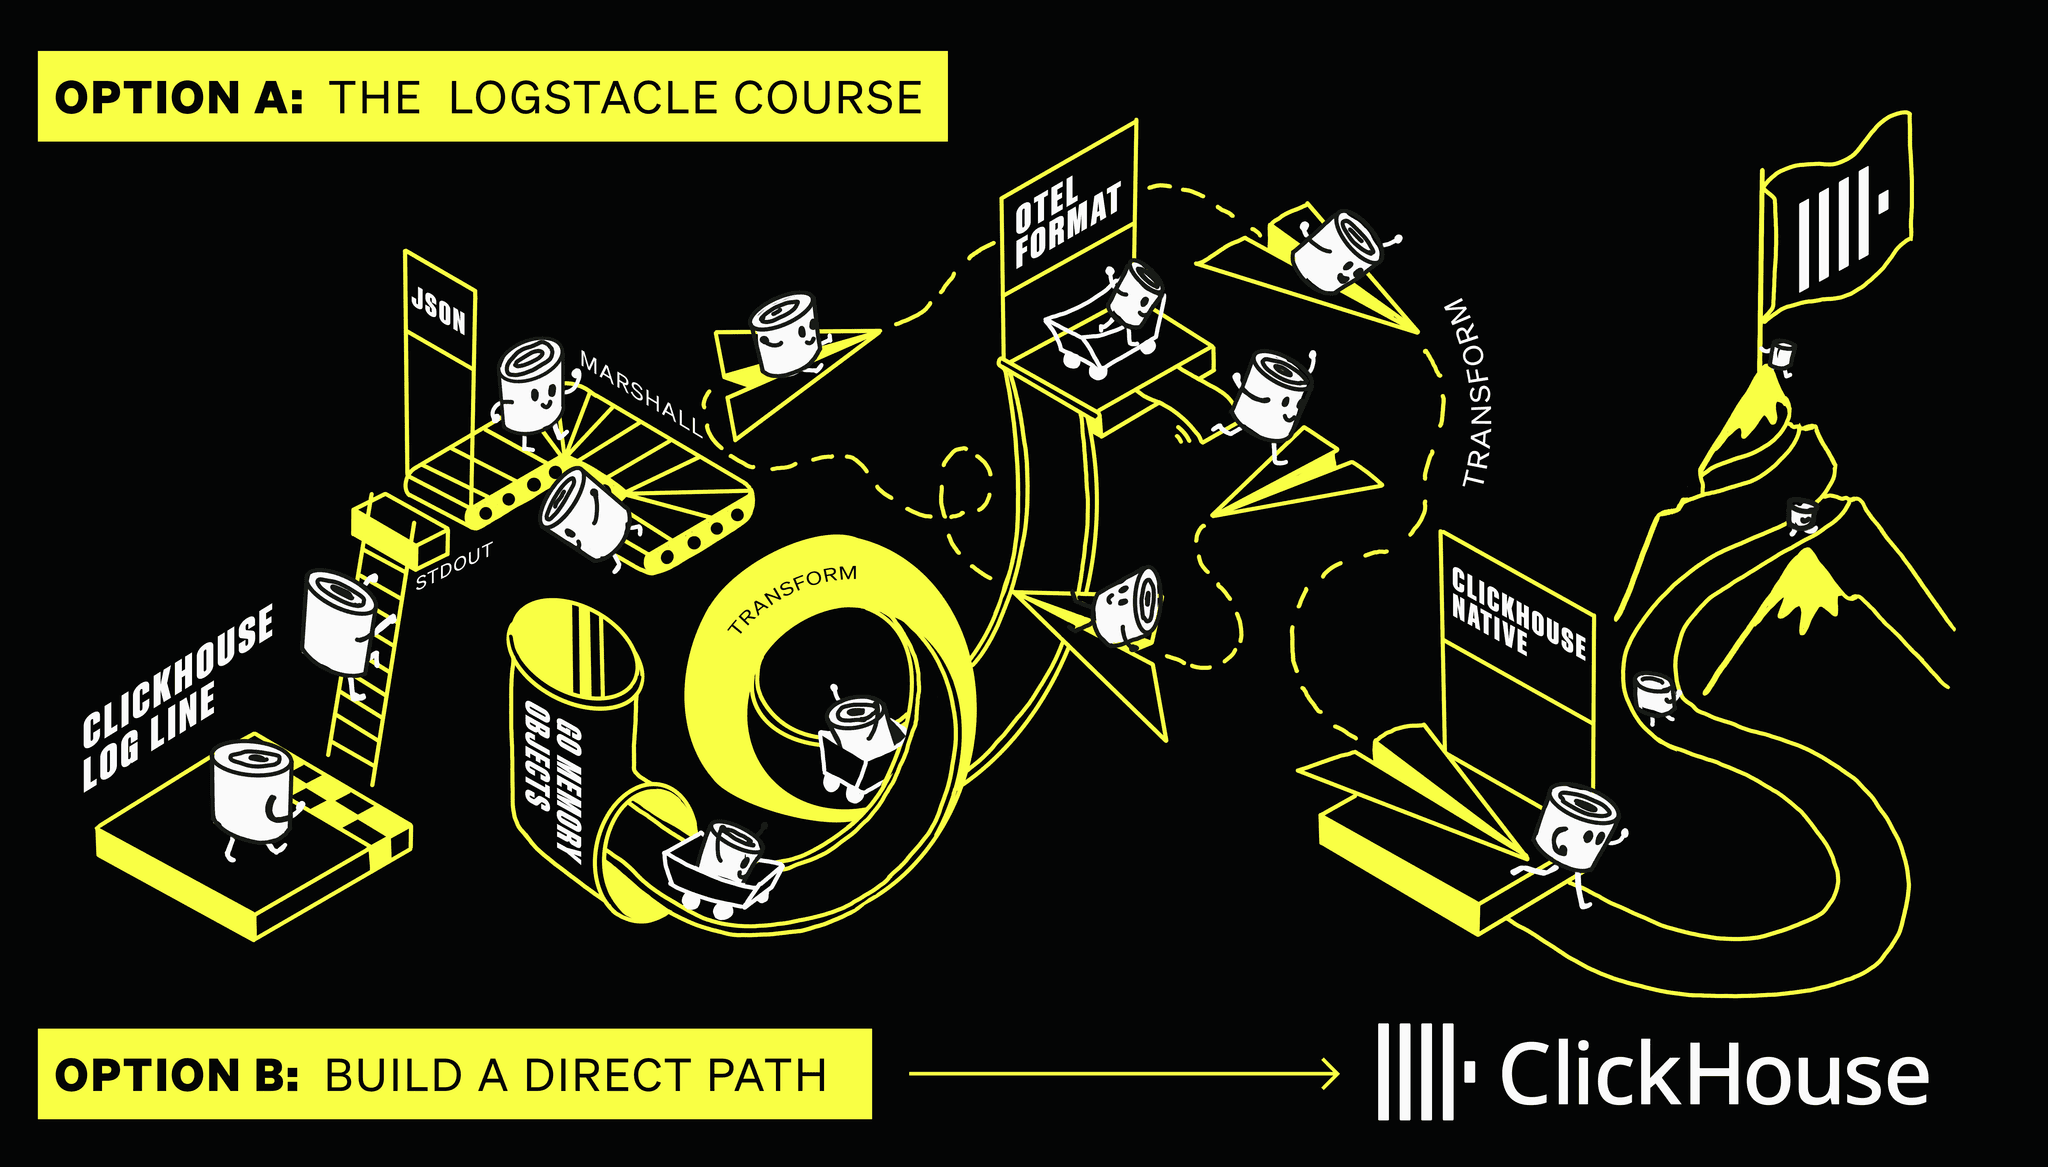
The data journey involved:
- A customer's ClickHouse instance writes logs as JSON to stdout.
- The kubelet persists these logs in
/var/log/… - An OTel collector collects these logs from the disk, parsing and marshalling the JSON into an in-memory representation.
- The collector transforms these into the OTel log format - again an in-memory representation.
- Finally, they are inserted back into another ClickHouse instance (LogHouse) over the native format (requiring another transformation within the ClickHouse Go client).
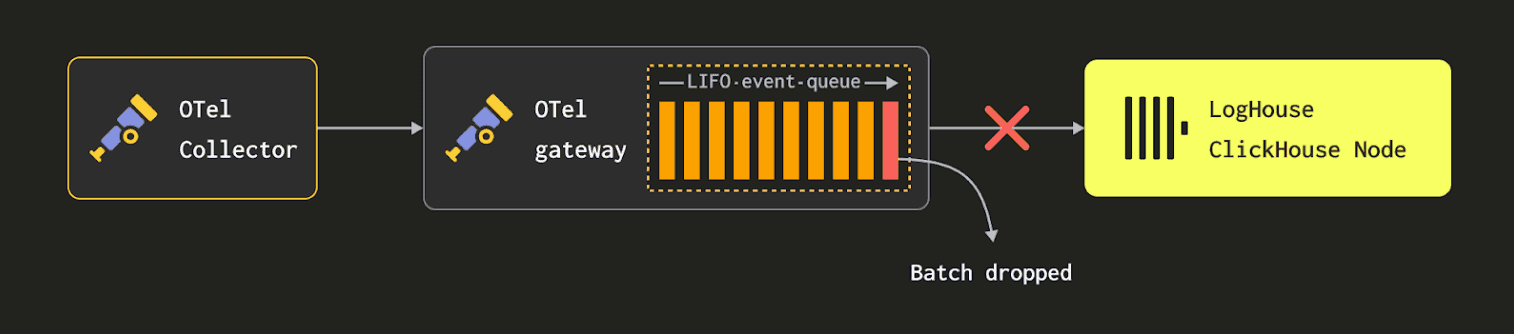
Note: The architecture described here is simplified. In reality, our OTel pipeline is more involved. Logs were first collected at the edge in JSON, converted into the OTel format, and sent over OTLP to a set of gateway instances. These gateways (also OTel collectors) performed additional processing before finally converting the data into ClickHouse’s native format for ingestion. Each step introduced overhead, latency, and further complexity.
At our scale, this pipeline introduced two critical problems: inefficiency and data loss. First, we were burning substantial compute on repeated data transformations. Native ClickHouse types were being flattened into JSON, mapped into the OTel log format, and then re-ingested - only to be reinterpreted by ClickHouse on the other end. This not only wasted CPU cycles but also degraded the fidelity of the data. Even more importantly, we were hitting hard resource limits on the collectors themselves. Deployed as agents on each Kubernetes node, they were subject to strict CPU and memory constraints via standard Kubernetes limits. As traffic spiked, many collectors ran so hot they began dropping log lines outright - unable to keep up with the volume emitted by ClickHouse. We were losing data at the edge before it ever had a chance to reach LogHouse. We found ourselves at a crossroads: either dramatically scale up the resource footprint of our OTel agents (and gateways) or rethink the entire ingestion model. We chose the latter.
Note: To put the cost in perspective - handling 20 million rows per second through the OpenTelemetry pipeline without dropping events would require an estimated 8,000 CPU cores across agents and collectors. That’s an enormous footprint dedicated solely to log collection, making it clear that the general-purpose approach was unsustainable at our scale.
Building SysEx: A specialized system for ClickHouse-to-ClickHouse transfers
Our solution was to develop the System Tables Exporter, or SysEx. This is a specialized tool designed to transfer data from one ClickHouse instance to another as efficiently as possible. We wanted to go directly from the system tables in a customer's pod to the tables in LogHouse, preserving native ClickHouse types and eliminating all intermediate conversions. This has the fantastic side benefit that any query our engineers use to troubleshoot a live instance can be trivially adapted to query historical data across our entire fleet in LogHouse, as the table schemas are identical, with the addition of some enrichment columns (such as the Pod Name, ClickHouse version, etc).
Firstly we should emphasize that SysEx performs a literal byte-for-byte copy of data from the source to the destination. This preserves full fidelity, eliminates unnecessary CPU overhead, and avoids the pitfalls of repeated marshalling.
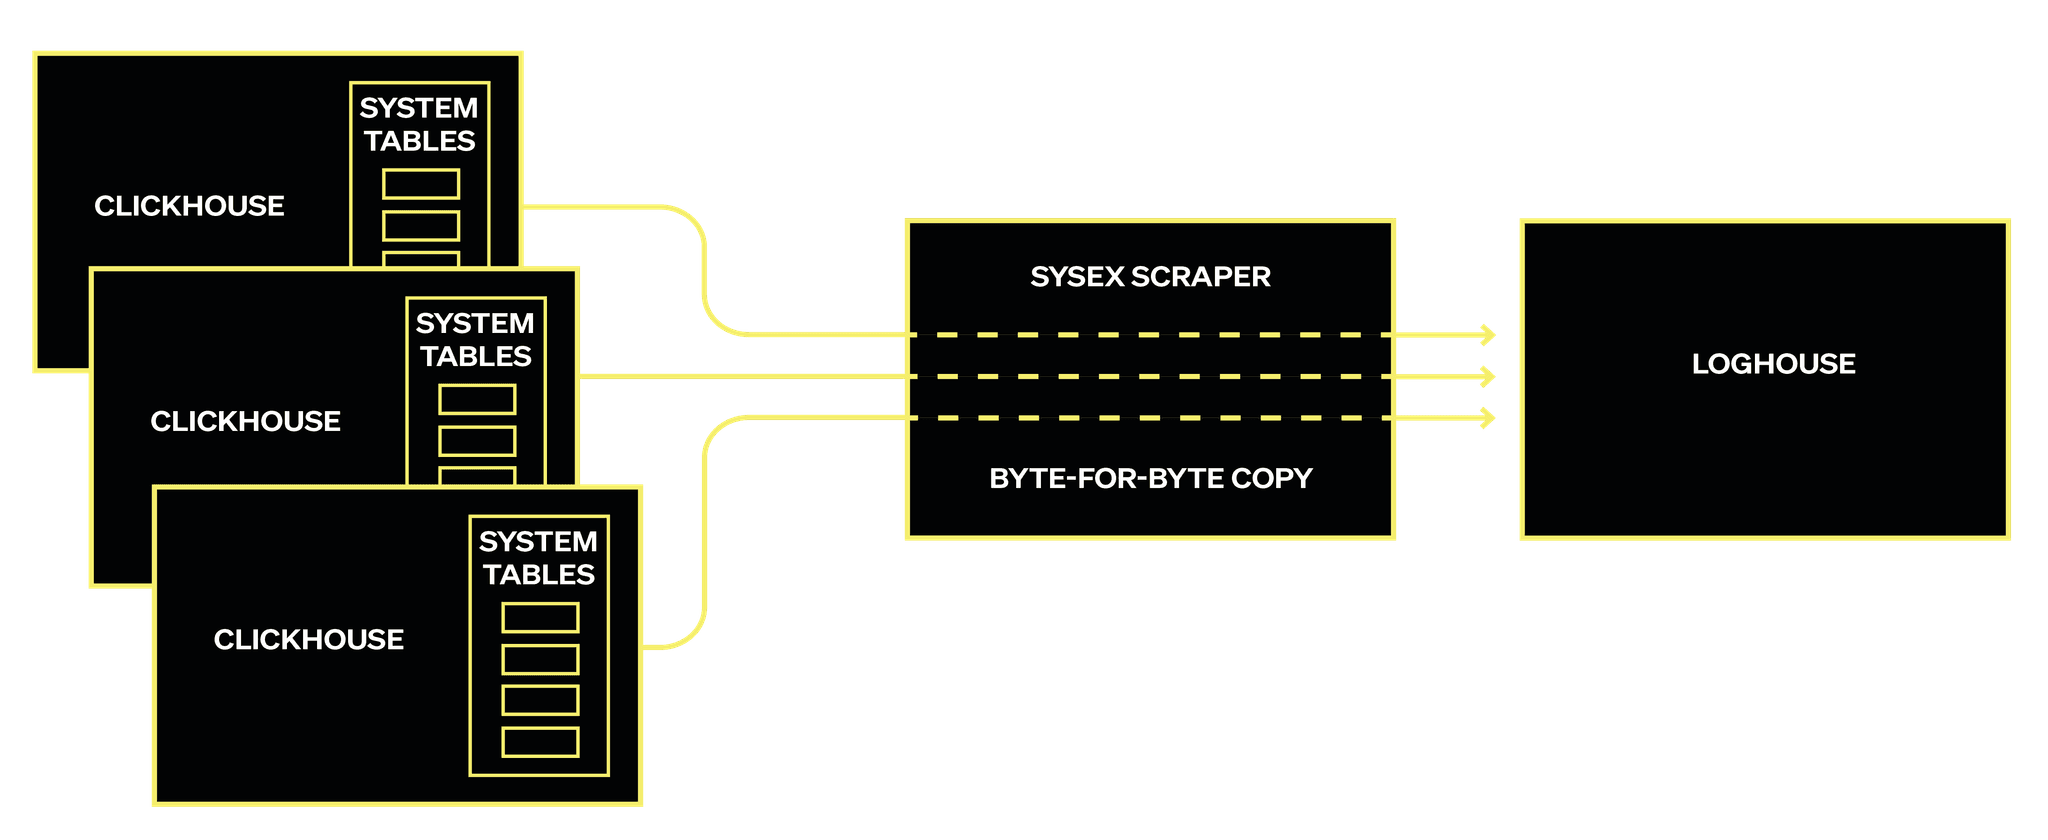
The architecture is simple and powerful. We run a pool of SysEx scrapers connecting to our customer's ClickHouse instances. A hash ring assigns each customer pod to a specific scraper replica to distribute the load. These scrapers then run SELECT queries against the source pod's system tables and stream the data directly into LogHouse, without any deserialization. The scrapers simply coordinate and forward bytes between the source and destination. Scraping system tables requires careful handling to ensure no data is missed due to buffer flushes. Fortunately, nearly all system table data is inherently time-series in nature. SysEx leverages this by querying within a sliding time window, deliberately trailing real time by a small buffer - typically five minutes. This delay allows for any internal buffers to flush, ensuring that when a scraper queries a node, all relevant rows for that time window are present and complete. This strategy has proven reliable and meets our internal SLAs for timely and complete event delivery to LogHouse.
SysEx is written in Go, like most of our infrastructure components for ClickHouse Cloud. Naturally, this raises a question for anyone familiar with the Go ClickHouse client: how do we avoid the built-in marshalling and unmarshalling of data when reading from and writing to ClickHouse? By default, the client converts data into Go-native types, which would defeat the purpose of a byte-for-byte copy. To solve this, we contributed improvements to the Go client that allow us to bypass internal marshalling entirely, enabling SysEx to stream data in its native format directly from the source cluster to LogHouse - without decoding, re-encoding, or allocating intermediary data structures.
This approach is broadly equivalent to a simple bash command:
curl -s -u 'default:<password>' "https://sql-clickhouse.clickhouse.com:8443/?query=SELECT+*+FROM+system.query_log+FORMAT+Native" | curl -s -X POST --data-binary @- 'http://localhost:8123/?query=INSERT+INTO+query_log+FORMAT+Native'An actual go implementation for the curious can be found here.
Most importantly, SysEx doesn’t require the heavy buffering that OTel does, thanks to its pull-based model. Because scrapers query data at a steady, controlled rate, we don’t risk dropping logs when LogHouse is temporarily unavailable or when the source experiences a spike in telemetry. Instead, SysEx naturally handles backfill by scraping historical windows, ensuring reliable delivery without overloading the system or requiring complex retry buffers.
Dynamic schema generation
One of the key challenges with the SysEx approach is that it assumes the source and target schemas match. But in reality, as any ClickHouse user knows, system table schemas change frequently. Engineers continuously add new metrics and columns to support emerging features and accelerate issue diagnosis, which means the schema is a moving target.
To handle this, we generate schemas dynamically. When SysEx encounters a system table, it inspects and hashes its schema to determine if a matching table already exists in LogHouse. If it does, the data is inserted there. If not, a new schema version is created for this system table e.g. text_log_6.
At query time, we use ClickHouse’s Merge table engine to unify all schema iterations into a single logical view. This allows us to query across multiple versions of a system table seamlessly. The engine automatically resolves schema differences by selecting only the columns that are compatible across tables, or by restricting the query to tables that contain the requested columns. This gives us forward compatibility as schemas evolve, without sacrificing query simplicity or requiring manual schema management.
State snapshotting
As we continued to scale and refine our observability capabilities, one of our primary focuses was capturing in-memory system tables, such as system.processes. Unlike the time-series data we’ve been capturing, these tables provide a snapshot of the server’s state at a specific point in time. To handle this, we implemented a periodic snapshot process, capturing these in-memory tables and storing them in LogHouse.
This approach not only allows us to capture the state of the cluster at any given moment, but also provides time-travel through critical details like table schemas and cluster settings. With this additional data, we are able to enhance our diagnostic capabilities by performing cluster-wide or ClickHouse Cloud-wide analyses. This we can join against service settings or query characteristics like used_functions to pinpoint anomalies, making it easier to identify the root causes of issues as they arise. By correlating queries with particular schemas, we further improved our ability to proactively identify and resolve performance or reliability problems for our customers.
Fleet-wide queries
One of the many powerful capabilities we've unlocked with SysEx is the ability to take the same Advanced Dashboard queries that customers use to monitor their individual ClickHouse instances and run them across our entire fleet of customer instances simultaneously.
For release analysis, we can now execute proven diagnostic queries before and after deployments to immediately identify behavioral changes across our entire fleet. This has been rolled into our comprehensive release analysis process. Queries that analyze query performance patterns, resource utilization trends, and error rates complete in real time, allowing us to quickly spot regressions or validate improvements at fleet scale.
Secondly, our support dashboards can now embed the same deep diagnostic queries that customers rely on, but with enriched context from our centralized telemetry. When investigating customer issues, support engineers can run familiar Advanced Dashboard queries while simultaneously correlating with network logs, Kubernetes events, data and control plane events - all within the same interface.

20x more data, 90% less CPU: The numbers behind our rewrite
The efficiency gains from this SysEx are staggering. Consider these stats from LogHouse:
- OTel Collectors: Use over 800 CPU cores to ship 2 million logs per second.
- LogHouse Scrapers (SysEx): Use just 70 CPU cores to ship 37 million logs per second.
This specialized approach has allowed us to handle a 20x increase in event volume with less than 10 percent of the CPU footprint for our most important data source. Most importantly, it means we no longer drop events at the edge. To achieve this same level of reliability with our previous OTel-based pipeline, we would have needed over 8,000 CPU cores. SysEx delivers it with a fraction of the resources, maintaining full fidelity and consistent delivery.
When OpenTelemetry is the right choice
If you’ve read this far, you might be wondering: when is OpenTelemetry still the right choice, and is it still useful? We firmly believe that it is. While our architecture has evolved to meet challenges at extreme scale, such as parsing and processing over 20 million log lines per second, OpenTelemetry remains a critical part of our stack. It offers a standardized, vendor-neutral format and provides an excellent onboarding experience for new users - and is hence the default choice for ClickStack. Unlike SysEx, which is tightly integrated with ClickHouse internals, OpenTelemetry decouples producers from consumers, which is a major architectural advantage, especially for users who want flexibility across observability platforms.
It is also well suited for scenarios where SysEx cannot operate. SysEx is pull-based and relies on querying live system tables, which means the service must be healthy and responsive. If a service is crash-looping or down, SysEx is unable to scrape data because the necessary system tables are unavailable. OpenTelemetry, by contrast, operates in a passive fashion. It captures logs emitted to stdout and stderr, even when the service is in a failed state. This allows us to collect logs during incidents and perform root cause analysis even if the service never became fully healthy.
For this reason, we continue to run OpenTelemetry across all ClickHouse services. The key difference is in what we collect. Previously, we ingested everything, including trace-level logs. Now, we collect only info-level and above. This significantly reduces the data volume and allows our OTel collectors and gateways to operate with far fewer resources. The result is a smaller, more focused pipeline that still accounts for the 2 million log lines per second referenced earlier.
HyperDX for better experience
Collecting all this data is just the beginning. Making it usable and accessible is what really matters. In the first iteration of LogHouse, we built a highly customized observability experience on top of Grafana. It served us well, but as our internal data sources grew and diversified, particularly with the introduction of SysEx and wide-column telemetry, it became clear we needed something more deeply integrated with ClickHouse.
This challenge was not unique to us. Many teams building observability solutions on ClickHouse have encountered the same issue. Getting data into ClickHouse was straightforward, but building a UI that fully unlocked its value required significant engineering effort. For smaller teams or companies without dedicated frontend resources, ClickHouse-powered observability was often out of reach.
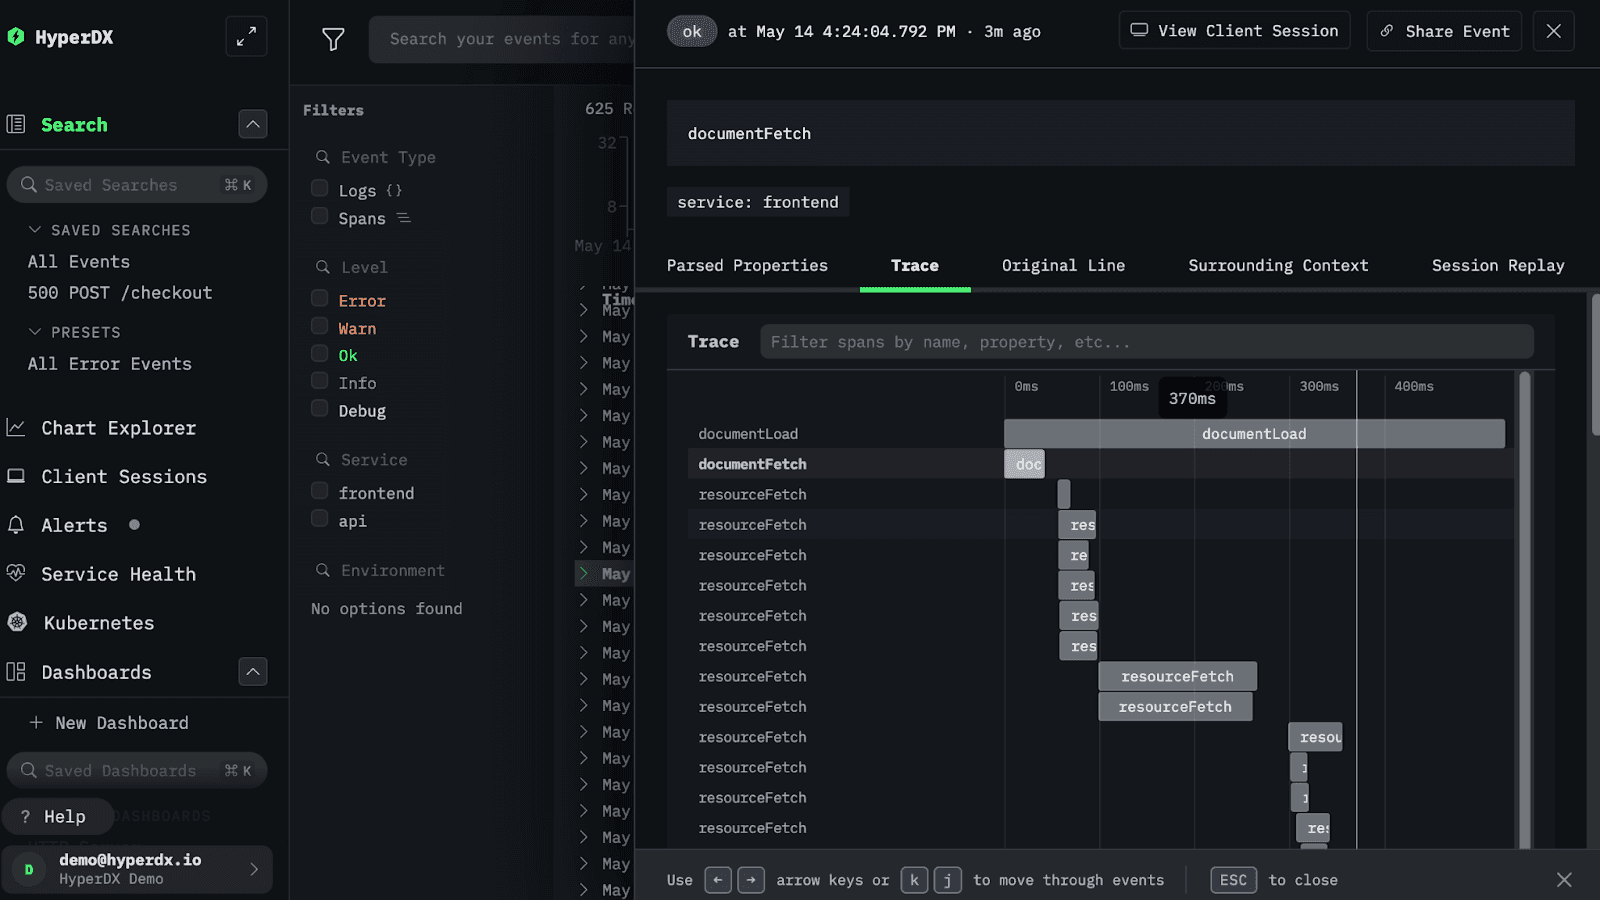
HyperDX changed that. It provided a first-party, ClickHouse-native UI that supports log and trace exploration, correlation, and analysis at scale. Its workflows are designed with ClickHouse in mind, optimizing queries and minimizing latency. When we evaluated HyperDX prior to the acquisition, it was already clear that it addressed many of the pain points we and others had experienced. The ability to query using Lucene syntax dramatically simplifies data exploration and is often sufficient. Importantly, it still allows us to query in SQL - something which we still find essential for more complex event analysis - see “SQL for more complex analysis”.
A key reason HyperDX was such a compelling fit was the schema-agnostic approach introduced in v2.0. It doesn't require log tables to conform to a single, rigid structure. This flexibility is critical for a system like LogHouse, which ingests data from numerous sources:
- It seamlessly handles the standardized, yet evolving, data format from our OpenTelemetry pipeline.
- More importantly, it works out-of-the-box with the highly specialized, wide-column tables produced by SysEx and our other custom exporters. It does this with no prior knowledge of the SysEx schemas, or complex grok pattern specializations. It simply inspects the schema behind-the-scenes and adapts to work with them.
This means our engineering teams can add new data sources with unique, optimal schemas to LogHouse without ever needing to worry about breaking or reconfiguring the user interface. By combining HyperDX's powerful UI and session replay capabilities with LogHouse's massive data repository, we have created a unified and adaptable observability experience for our engineers.

It is worth emphasizing that Grafana still has its place in our observability stack. Our internal Grafana-based application has some distinct advantages, particularly in how it handles routing and query scoping. Users are required to specify the namespace (effectively a customer service) they intend to query. Behind the scenes, the application knows exactly where data for each service resides and can route queries directly to the appropriate ClickHouse instance within LogHouse. This minimizes unnecessary query execution across unrelated services and helps keep resource usage efficient.
This is especially important in our environment, where we operate LogHouse databases across many regions. As our previous blog post described, efficiently querying across these distributed systems is critical for performance and reliability. We’re currently exploring how we might push this routing logic to ClickHouse itself, allowing HyperDX to benefit from the same optimization..so stay tuned.
In addition to its routing capabilities, Grafana remains the home for many of our long-standing dashboards and alerts, particularly those built on Prometheus metrics. These remain valuable, and migrating them is not currently a priority. For example, kube_state_metrics has almost become a de facto standard for cluster health monitoring. These high-level metrics are well suited for alerting, even if they are not ideal for deep investigation. For now, they continue to serve their purpose effectively.
For now, the two tools serve complementary purposes and coexist effectively within our observability stack.
Embracing high cardinality observability
Store everything, aggregate nothing
The development of SysEx has brought more than just technical gains. It has driven a cultural shift in how we think about observability. By unlocking access to system tables that were previously unavailable, where only standard output logs had been captured, we have embraced a model centered on wide events and high cardinality data.
Some refer to this as Observability 2.0. We simply call it LogHouse combined with ClickStack.
This approach replaces the traditional three-pillar model with something more powerful: a centralized warehouse that can store high-cardinality telemetry from many sources. Each row contains rich context - query identifiers, pod names, version metadata, network details - without needing to pre-aggregate or discard dimensions to fit within the limits of a metric store.
As engineers, we have adapted to this new model, leaving behind outdated concerns about cardinality explosions. Instead of summarizing at ingest time, we store everything as is and push aggregation to query time. This approach allows for in-depth inspection and flexible exploration without sacrificing fidelity.
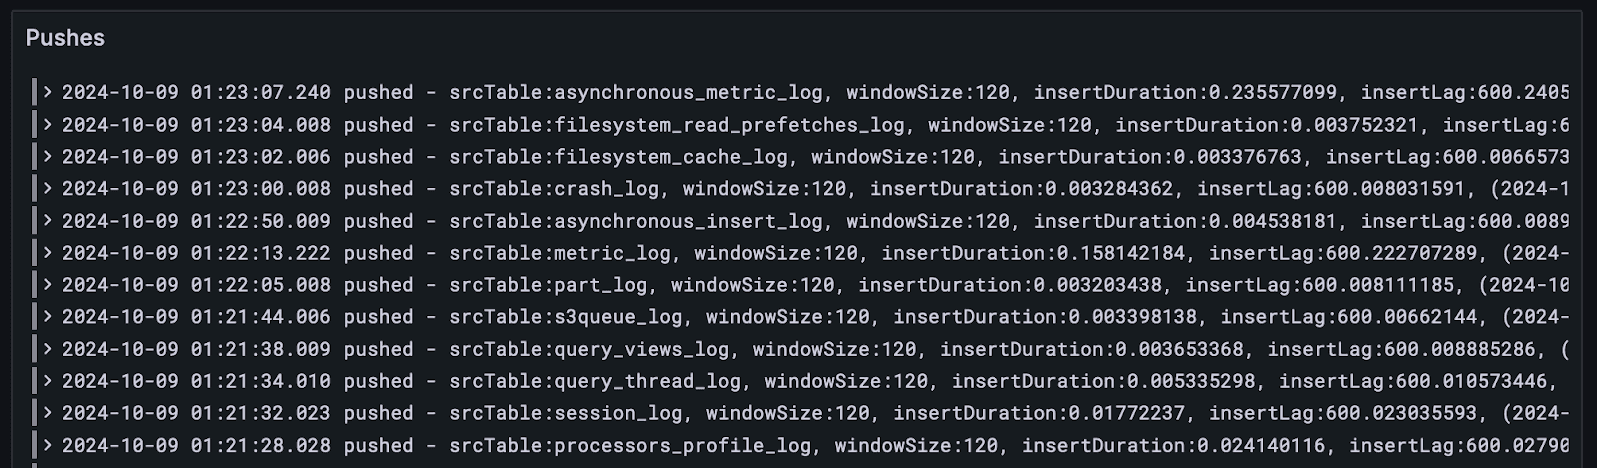
One pattern we have found particularly impactful is logging wide events that include timeseries attributes in place of traditional metrics. For example, here is a log line from SysEx that tracks data pushed from a source ClickHouse instance to the LogHouse cluster:
{
"level": "info",
"ts": 1728437333.011701,
"caller": "scrape/scrape.go:334",
"msg": "pushed",
"podName": "c-plum-qa-31-server-zkmrfei-0",
"podIP": "10.247.29.9",
"spokenName": "plum-qa-31",
"azTopoName": "us-east1-c",
"srcTable": "part_log",
"windowSize": 120,
"insertDuration": 0.00525254,
"insertLag": 300.011693981,
"startGTE": 1728436913,
"stopLT": 1728437033
}At this point, you may be asking: how is this different from a traditional metrics store like Prometheus?
The key difference is that we store every single data point. We do not pre-aggregate fields like insertDuration; instead, we capture and retain each value and store it together.
In contrast, a system like Prometheus typically stores either a gauge per series or, more commonly, pre-aggregates values into histograms to support efficient querying. This design introduces significant limitations. For example, storing time series for all label combinations in Prometheus would lead to a cardinality explosion. In our environment, with tens of thousands of unique pod names, each label combination would require its own timeseries just to preserve query-time flexibility. Pre-aggregating with histograms helps control resource usage but comes at the cost of fidelity. It makes certain questions impossible to answer, such as:
"Which exact insert is represented by this spike in insertDuration - down to the specific instance, table, and time window?"
With our approach, we avoid these trade-offs entirely. We log each event as a wide row that captures all relevant dimensions and metrics in full. This shifts aggregation and summarization to query time while preserving the ability to drill down into individual events when necessary.
This model isn’t entirely new. Systems like Elasticsearch have long encouraged the ingestion of wide events and flexible document structures. The difference is that ClickHouse makes this approach operationally viable at scale. Its columnar design allows us to store high-cardinality, high-volume event data efficiently - without the runaway storage costs or query latency that traditionally limited these kinds of approaches to storing events.
Leveraging data science tools for observability analysis
The power of this approach is in how we can use that single event to draw many different conclusions by visualising its various characteristics, and we can always jump back to the raw logs from any given point on a chart.
First, we can focus on a particular service and see its inserts line by line in series. This is the raw view upon the data.
We can visualize the insert lag for all tables for this individual instance trivially…
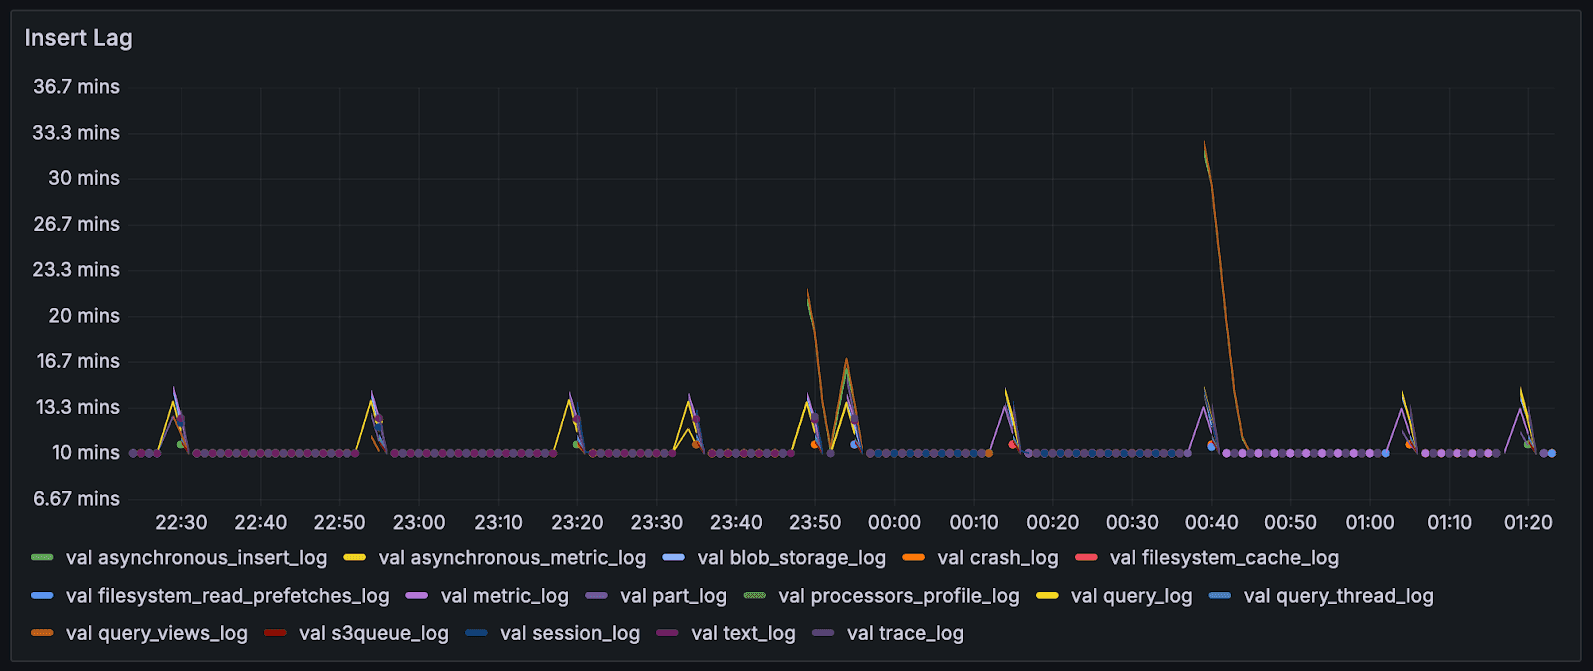
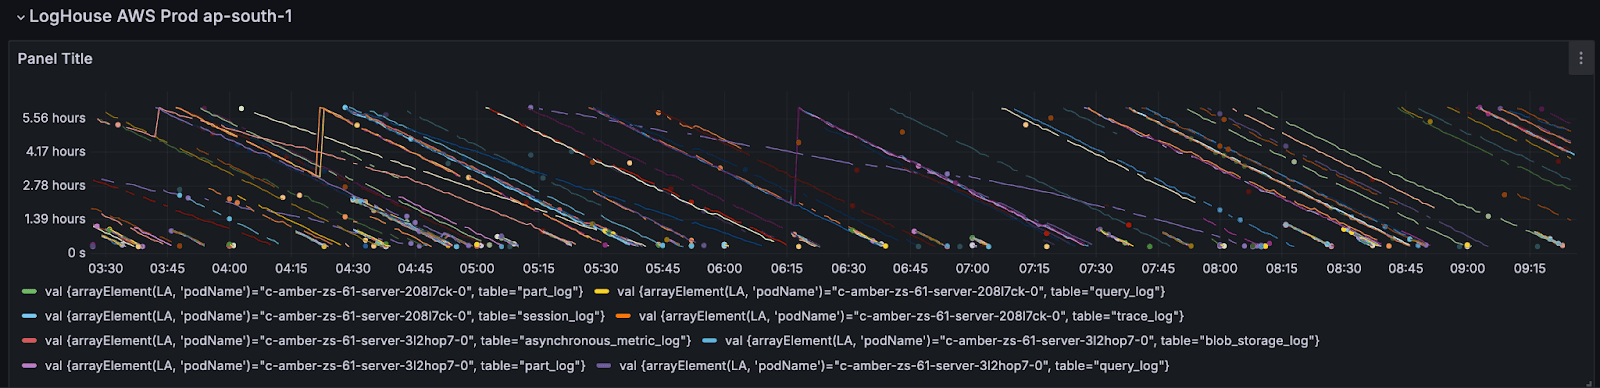
We may go a layer up and visualise the insert lag for all servers in a region, which have lag > desired.
And, because Observability is Just another Data Problem, we get to borrow all of the tooling in the data science space for our observability data, so we can visualise our logs in any tool of our choice for which ClickHouse either integrates directly or via a client library. For example, Plotly in a Jupyter notebook;
import plotly.express as px
import pandas as pd
import clickhouse_connect
client = clickhouse_connect.get_client(
…
)
query = """
SELECT
toInt64(toFloat64(LA['ts'])) AS ts,
toInt64(LA['startGTE']) AS start,
toInt64(LA['stopLT']) AS stop
FROM otel.generic_logs_0
WHERE (PodName LIKE 'loghouse-scraper-%'
AND Timestamp >= '2025-06-10 16:14:00'
AND Timestamp <= '2025-06-10 18:35:00'
AND EventDate = '2025-06-10'
AND Body = 'pushed'
AND LA['srcTable'] = 'text_log'
AND LA['podName'] = 'c-plum-qa-31-server-zzvuyka-0'
)
ORDER BY EventTime DESC
"""
df = client.query_df(query)
# Convert the 'start' and 'stop' columns from Unix timestamps to datetime objects
df['start'] = pd.to_datetime(df['start'], unit='s')
df['stop'] = pd.to_datetime(df['stop'], unit='s')
fig = px.timeline(df, x_start="start", x_end="stop", y="ts")
fig.update_traces(width=40)
fig.update_layout(bargap=0.1)
fig.show()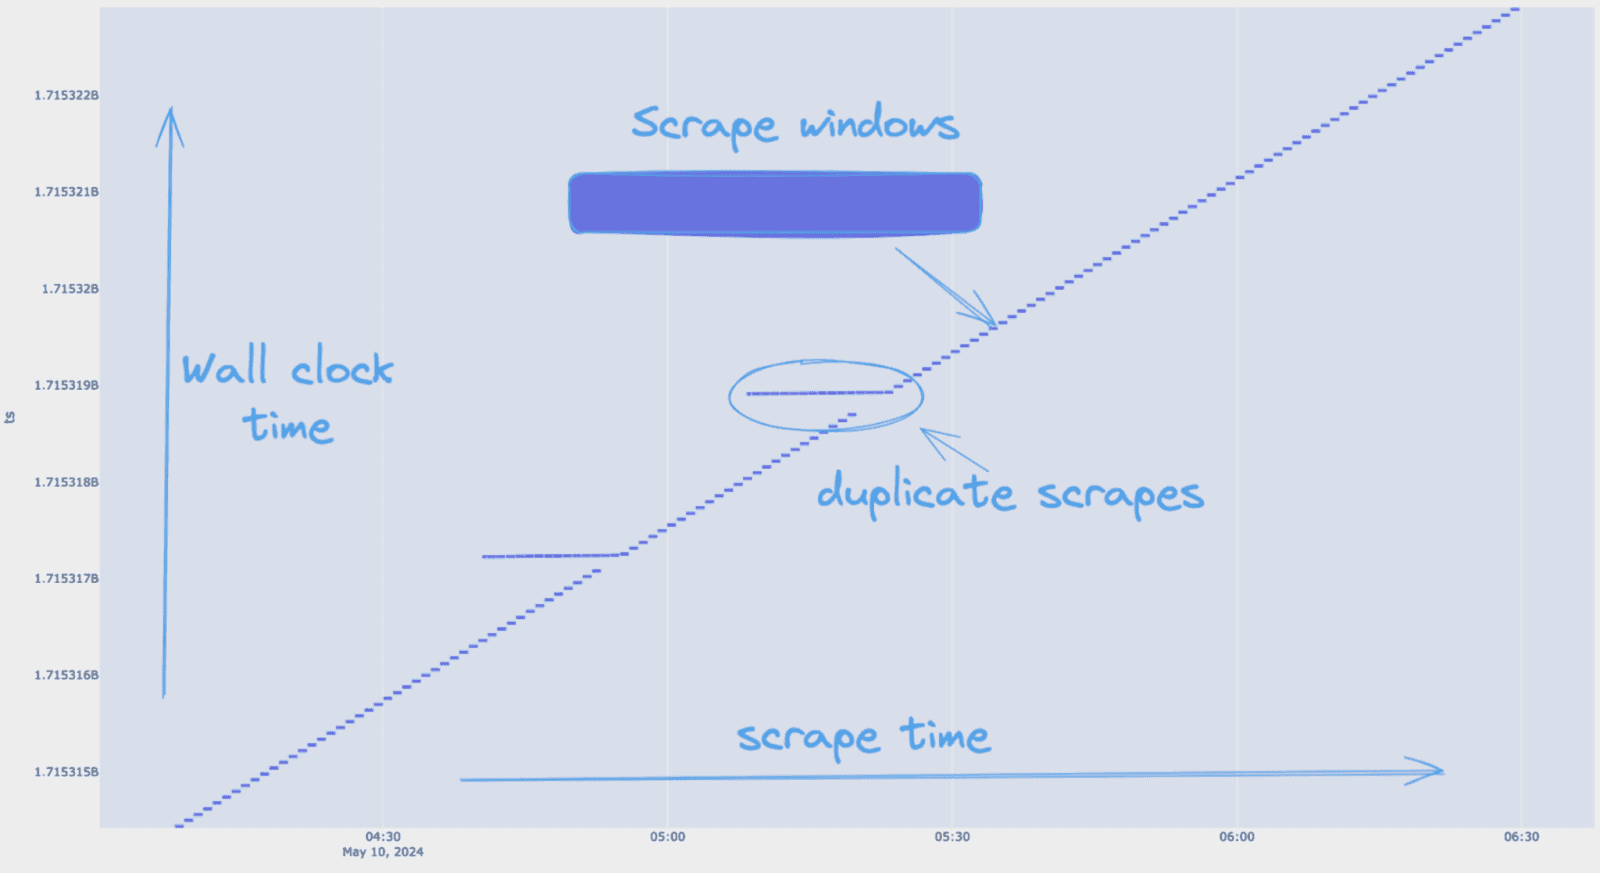
The plot shows scrape time versus wall time, allowing us to inspect each event for duplication. With Plotly, I could size the width of the rectangles as the exact start/end times. The annotations highlight a window where duplicate scrapes occurred, confirming the presence of overlapping data in that range.
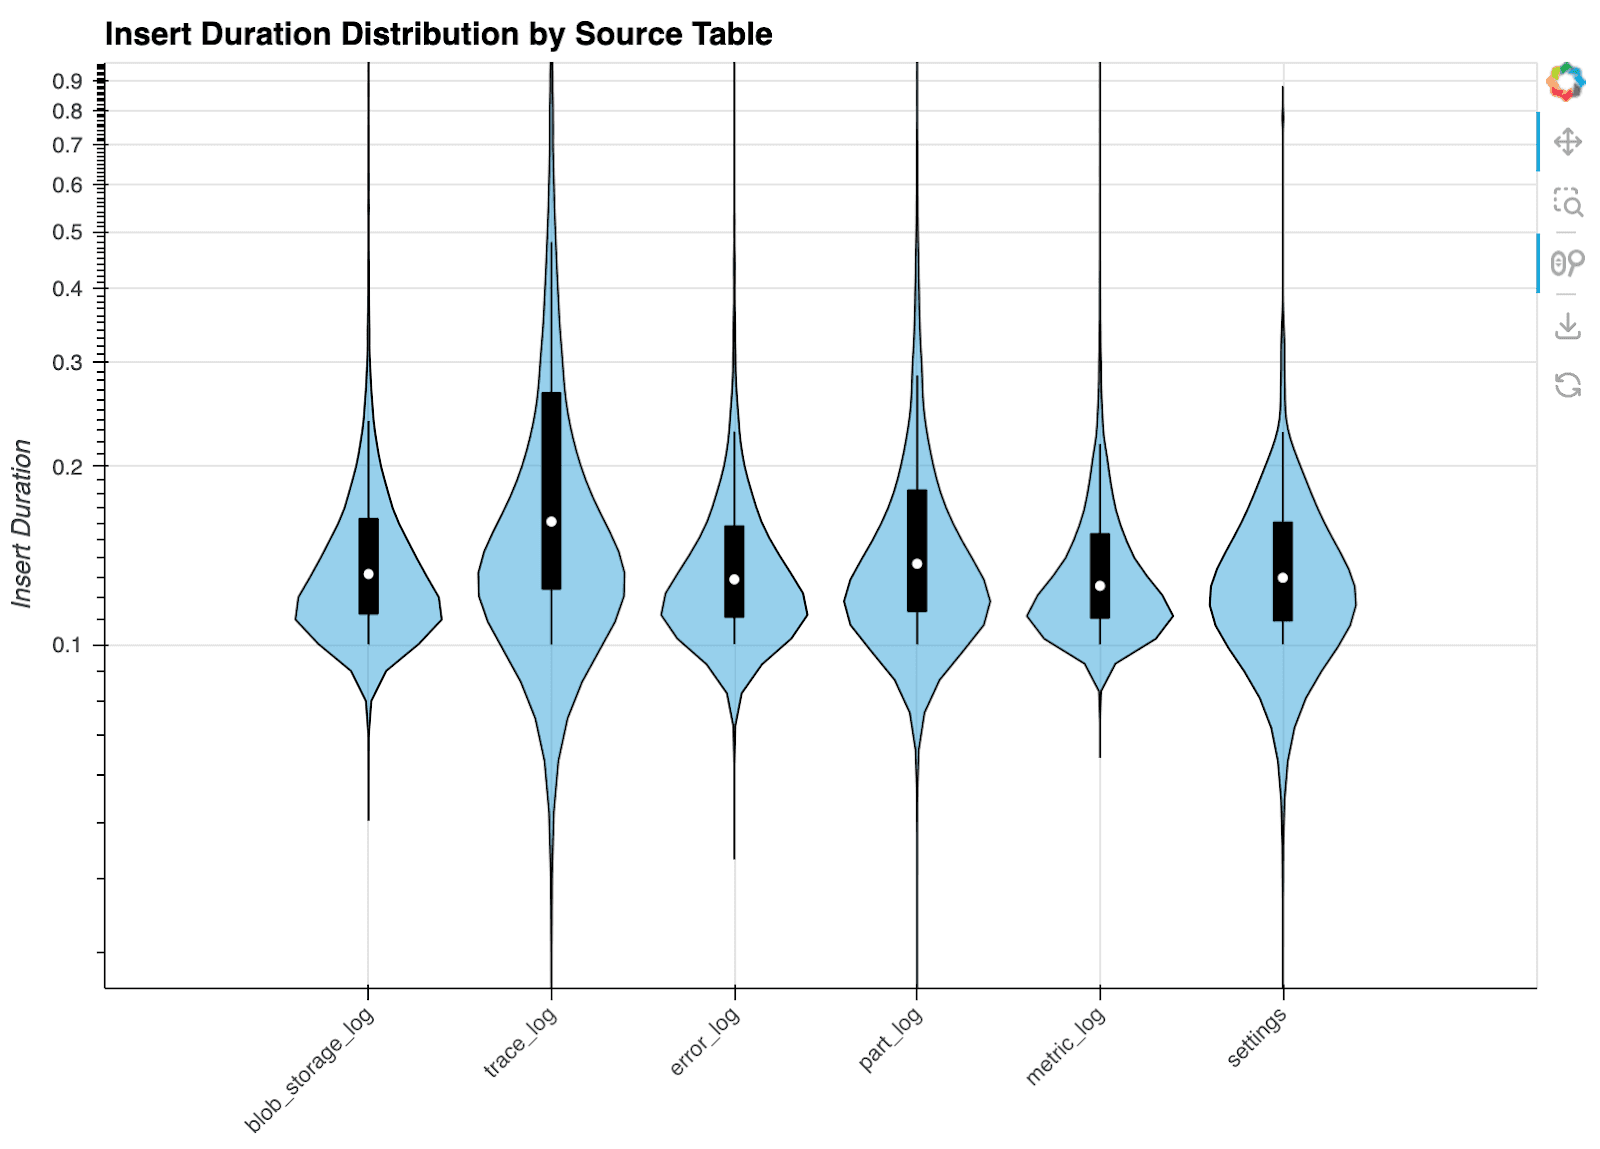
This plot illustrates the varying insert duration for some tables collected by the LogHouse Scraper.
While I tend to prefer Plotly, we recognize that others may favor more modern visualization libraries. Thanks to ClickHouse's broad integration support, our SREs can choose the best tools for their workflows. Whether it’s Hex, Bokeh, Evidence, or any other platform that supports SQL-driven analysis, they are free to work with the approach that suits them best.
Here, we saw five views of the same event - demonstrating the flexibility we have to choose how we render at query time, using different charting tools, always with the ability to drill down into the raw line-by-line events.
When log search isn't enough: complex queries with SQL
HyperDX offers a robust event search interface utilizing Lucene syntax, ideal for quick lookups and filtering. However, to answer more complex observability questions, a more expressive query language is needed. With ClickHouse as the engine behind LogHouse, we can always drop into full SQL
SQL allows us to express joins, time-based operations, and transformations that would be difficult or impossible to perform in typical log query tools. One example is identifying pod termination times by correlating Kubernetes event streams. The query below uses ASOF JOIN to align Killing and Created events for the same container, calculating the time between termination and restart:
WITH
KE AS
(
SELECT *
FROM loghouse.kube_events
WHERE (FirstTimestamp >= '2025-03-10 01:00:00') AND (FirstTimestamp <= '2025-03-11 01:00:00') AND (Reason IN ['Killing']) AND (FieldPath LIKE 'spec.containers{c-%-server}')
),
CE AS
(
SELECT *
FROM loghouse.kube_events
WHERE (FirstTimestamp >= '2025-03-10 01:00:00') AND (FirstTimestamp <= '2025-03-11 01:00:00') AND (Reason IN ['Created']) AND (FieldPath LIKE 'spec.containers{c-%-server}')
)
SELECT
Name,
KE.FirstTimestamp AS killTime,
CE.FirstTimestamp AS createTime,
createTime - killTime AS delta,
formatReadableTimeDelta(createTime - killTime) AS readableDelta
FROM KE
ASOF LEFT JOIN CE ON (CE.Name = KE.Name) AND (CE.FirstTimestamp >= KE.FirstTimestamp)
HAVING createTime > '1970-01-01 00:00:00'
ORDER BY delta DESC
LIMIT 5┌─Name─────────────────────────────┬────────────killTime─┬──────────createTime─┬─delta─┬─readableDelta─────────────────────┐
│ c-emerald-tu-48-server-p0jw87g-0 │ 2025-03-10 19:01:39 │ 2025-03-10 20:15:59 │ 4460 │ 1 hour, 14 minutes and 20 seconds │
│ c-azure-wb-13-server-648r93g-0 │ 2025-03-10 11:30:23 │ 2025-03-10 12:28:50 │ 3507 │ 58 minutes and 27 seconds │
│ c-azure-wb-13-server-3mjrr1g-0 │ 2025-03-10 11:30:23 │ 2025-03-10 12:28:47 │ 3504 │ 58 minutes and 24 seconds │
│ c-azure-wb-13-server-v31soea-0 │ 2025-03-10 11:30:23 │ 2025-03-10 12:28:46 │ 3503 │ 58 minutes and 23 seconds │
└──────────────────────────────────┴─────────────────────┴─────────────────────┴───────┴───────────────────────────────────┘
4 rows in set. Elapsed: 0.099 sec. Processed 17.78 million rows, 581.49 MB (180.05 million rows/s., 5.89 GB/s.)
Peak memory usage: 272.88 MiB.Sure, we could write a component to track this as a metric, but the power of ClickHouse is that we don’t need to do so. It’s sufficient to store a warehouse of wide events and derive the metric we need at query time from them. So, when a colleague asks, ‘what’s the p95 replacement time for Pods after termination is requested’, we can just find a relevant set of events instead of responding, 'let me ship a new metric ', and getting back to them with an answer after the next release goes out.
Expanding the data universe
Sold on the immense value of having deep, structured telemetry in a high-performance analytics engine, we've been busy adding more data sinks to LogHouse, mainly at the request of our engineering and support team, who love using LogHouse and want all critical data to live in the warehouse. This year, we've embraced a cultural shift towards high-cardinality, wide-event-based observability as shown above.
Some of our new data sources, which adhere to this wide event philosophy, include:
- kubenetmon: Our open-source tool for monitoring Kubernetes networking, giving us deep insights into cluster traffic.
kubenetmonuses Linux's conntrack system to capture L3/L4 connection data with byte/packet counts. This provides three key capabilities: forensics (time-series connection records with per-minute bandwidth), attribution (mapping connections to specific workloads and pods), and metering (cost tracking for expensive data transfer like cross-region egress). The system processes millions of connection observations per minute, helping us identify costly cross-regional downloads, track cross-AZ traffic patterns, and correlate network usage with actual costs. You can find the project at https://github.com/ClickHouse/kubenetmon. - Kubernetes Event Exporter: We forked the popular exporter and added a native ClickHouse sink, allowing us to analyze Kubernetes API events at scale. You can find our fork here. This is hugely useful for understanding why things changed in K8s over time. We’re not stopping there, however! We’re already working on a plan to ingest not just the events, but the entire k8s object model into LogHouse, with snapshots at every change. This would allow us to model the full state of all clusters at any moment in time over the past six months, and step through all of the changes. Instead of just knowing "Pod X was terminated at 15:47," we’ll see the full cluster state before and after, understand dependencies, resource constraints, and the cascading effects of changes.
- Control Plane Data: We collect all operational data from our Control Plane department, who had not yet onboarded into LogHouse.
- Real User Monitoring (RUM): In a project that is still a work in progress, we collect frontend performance metrics from our users' browsers, which are pushed via a public gateway into our OTel pipeline.
- Istio Access Log: We ingest HTTP-level traffic data from our Istio service mesh, capturing request/response patterns, latencies, and routing decisions. Combined with ClickHouse's system.query_log and kubenetmon's network flows, this creates a powerful tri-dimensional correlation capability. When network usage spikes occur, our support team can trace the complete story: which specific SQL queries were executing, what HTTP requests triggered them, and the exact packet flow patterns. This cross-layer visibility transforms debugging from guesswork into precise root cause analysis - if we see unusual egress traffic, we can immediately identify whether it's from expensive cross-region queries, backup operations, or unexpected replication, making troubleshooting incredibly efficient for the support team.
What’s next and the road ahead
It’s been an incredible year of growth for LogHouse. By moving beyond a one-size-fits-all approach and embracing specialized, highly efficient tooling, we’ve scaled our observability platform to remarkable new heights while significantly enhancing our cost performance. Integrating HyperDX is a key part of that evolution, providing a flexible and powerful user experience on top of our petabyte-scale data warehouse. We're excited to see what the next year brings as we continue to build on this strong foundation.
Toward zero-impact scraping
While SysEx is designed to be efficient and resource-conscious, customers occasionally notice our scrape queries in their logs and metrics. These queries are tightly constrained with strict memory limits, but when they error (as they sometimes do) it can create concern. Although the actual resource impact is minimal, we recognize that even lightweight queries can create noise or confusion in sensitive environments.
To address this, we’re exploring what we call zero-impact scraping - the next evolution of SysEx. The goal is to eliminate all in-cluster query execution by entirely decoupling scraping from the live system. One promising direction involves leveraging plain rewritable disks on S3, where ClickHouse already writes its service logs. In this model, a pool of SysEx workers would mount these disk-based log tables directly, bypassing the need to query the running ClickHouse instance. This design would deliver all the benefits of our current system - native format, high fidelity, minimal transformation - while removing even the perception of operational impact.
OpenTelemetry remains a critical component of our platform, particularly for early-stage data capture before service tables are available. This is especially useful during crash loops, where structured logs may be unavailable. However, if our zero-impact scraping approach proves successful, it could reduce our reliance on OTel even further by providing a high-fidelity, low-disruption path for log ingestion throughout the lifecycle of a cluster.
This effort is still in progress, and we’ll share more once we’ve validated the approach in production.
Migrating to JSON
The JSON type has been available in ClickHouse for some time and recently reached GA in version 25.3. It offers a flexible and efficient way to store semi-structured data, dynamically creating columns with appropriate types as new fields appear. It even supports fields with multiple types and gracefully handles schema explosion.
Despite these advantages, we’re still evaluating how well JSON fits common observability access patterns at scale. For example, querying a string across an entire JSON blob can effectively involve scanning thousands of columns. There are workarounds - such as also storing a raw string version of the JSON alongside the structured data - but we’re still developing best practices in this area.
Culturally, we have also come to recognize the practical limits of the Map type, which has served us well. Most of our log and resource attributes are small and stable enough that the Map continues to be the right fit. We have found that single-level JSON logs are often all you need, and for exceptions, tools like HyperDX automatically translate map access into JSONExtract functions. While we plan to adopt JSON more broadly, this is still a work in progress. Expect us to share more in a future update.
Conclusion
Over the past year, LogHouse has evolved from an ambitious logging system into a foundational observability platform powering everything from performance analysis to real-time debugging across ClickHouse Cloud. What began as a cost-saving measure has become a catalyst for both cultural and technical transformation, shifting us toward high-fidelity, wide-event telemetry at massive scale. By combining specialized tools like SysEx with general-purpose frameworks like OpenTelemetry, and layering on flexible interfaces like HyperDX, we have built a system that not only keeps up with our growth but also unlocks entirely new workflows. The journey is far from over, but the lessons from scaling to 100PB and 500 trillion rows continue to shape how we think about observability as a core data problem we are solving at warehouse scale.
Acknowledgments
The successful rollout of our internal observability solution was made possible by the dedicated effort of the Observability team: Rory Crispin, Xander Garbett, Tommy Li, and Vlad Seliverstov.


