Monitoring your database system in a production environment is not an option; it is mandatory to have an overview of your deployment health to prevent or solve outages.
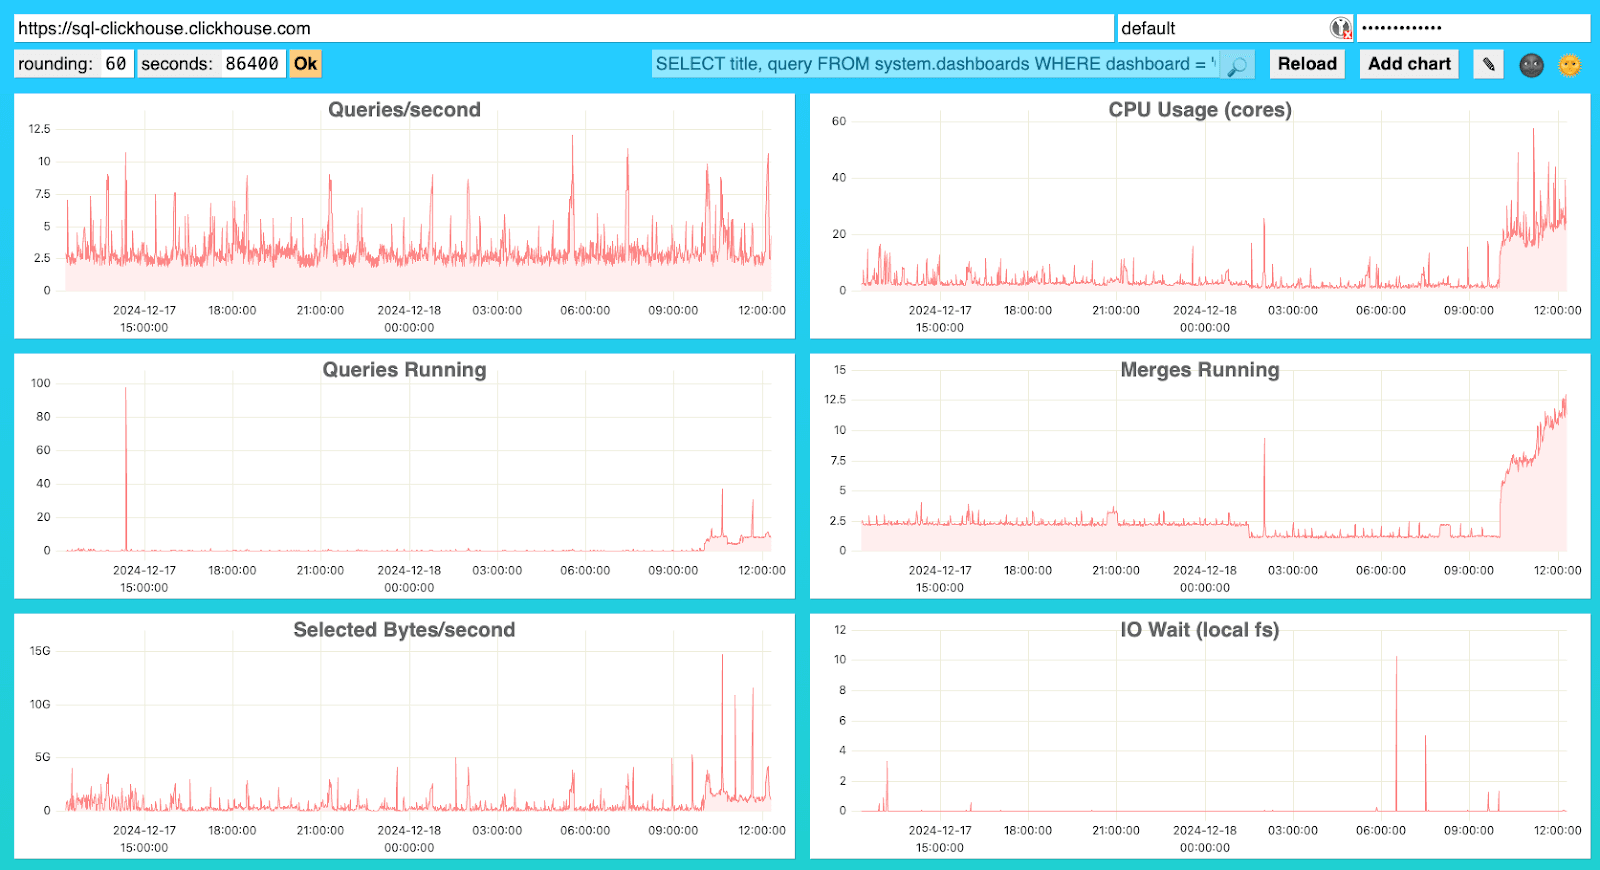
At ClickHouse, we understand this very well, and this is why ClickHouse comes by default with a set of predefined monitoring advanced dashboards. The Advanced Dashboard is a lightweight tool designed to give you deep insights into your ClickHouse system and its environment, helping you stay ahead of performance bottlenecks, system failures, and inefficiencies.
The Advanced Dashboard is available in ClickHouse OSS (Open Source Software) and Cloud. Whether you’re a data engineer managing high query loads or an SRE professional looking after ClickHouse uptime, the advanced dashboard allows you to monitor and troubleshoot issues effectively.
How to get started with the advanced dashboard #
The advanced dashboard is available out of the box. Depending on your environment, you may need to enable the metric log and asynchronous metric log to populate the default visualizations. If you’re running in ClickHouse Cloud, those are already enabled by default, so there is no additional setup.
To enable these, as described in the global settings documentation, edit the server configuration file /etc/clickhouse-server/config.d/metric_log.xml:
<clickhouse>
    <metric_log>
        <database>system</database>
        <table>metric_log</table>
        <flush_interval_milliseconds>7500</flush_interval_milliseconds>
        <collect_interval_milliseconds>1000</collect_interval_milliseconds>
        <max_size_rows>1048576</max_size_rows>
        <reserved_size_rows>8192</reserved_size_rows>
        <buffer_size_rows_flush_threshold>524288</buffer_size_rows_flush_threshold>
        <flush_on_crash>false</flush_on_crash>
    </metric_log>
    <asynchronous_metric_log>
        <database>system</database>
        <table>asynchronous_metric_log</table>
        <flush_interval_milliseconds>7500</flush_interval_milliseconds>
        <collect_interval_milliseconds>1000</collect_interval_milliseconds>
        <max_size_rows>1048576</max_size_rows>
        <reserved_size_rows>8192</reserved_size_rows>
        <buffer_size_rows_flush_threshold>524288</buffer_size_rows_flush_threshold>
        <flush_on_crash>false</flush_on_crash>
    </asynchronous_metric_log>
</clickhouse>
Once the ClickHouse server is running, the advanced dashboards are available at:
<your_clickhouse_url>/dashboard
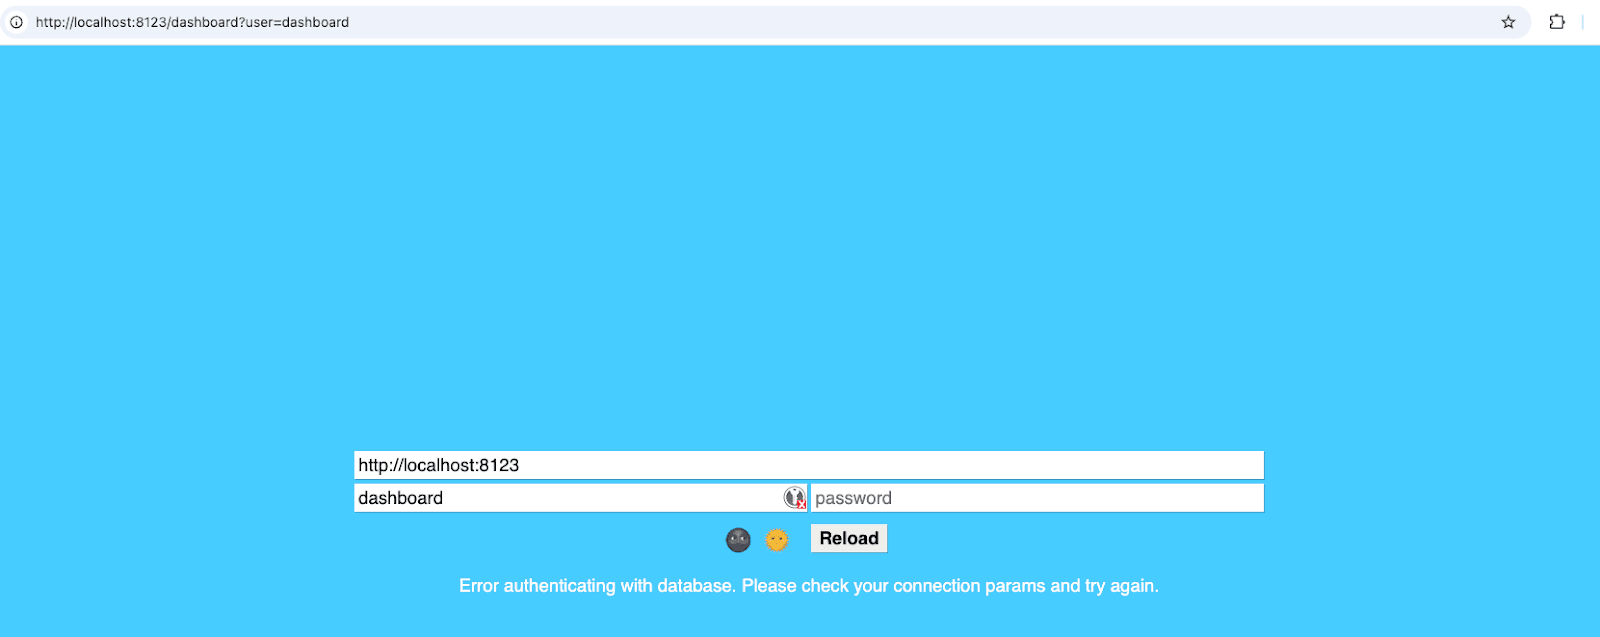
You can access the dashboard by default by logging in with the default user. However, it is recommended that you set up a specific user for this purpose.
To run the default visualization, the user needs read access to:
- The table system. dashboards: This is where the visualization definitions are stored.
- The table system.metric_log: This contains the history of metrics values from tables system.metrics and system.events.
- The table system.asynchronous_metric_log: This contains the historical values for system.asynchronous_metrics
The accessing user will also need two special grants: CREATE TEMPORARY TABLE ON *.* and REMOTE ON *.*
Let's create a dashboard user for our experiment:
  1-- Create dashboard user
2CREATE USER dashboard_user IDENTIFIED BY ;
3
4-- Create dashboard role and assign to dashboard_user
5CREATE ROLE dashboard;
6GRANT dashboard TO dashboard_user;
7
8-- Grant rights to access advanced dashboards
9GRANT REMOTE ON *.* to dashboard;
10GRANT CREATE TEMPORARY TABLE on *.* to dashboard;
11GRANT SELECT ON system.metric_log to dashboard;
12GRANT SELECT ON system.asynchronous_metric_log to dashboard;
13GRANT SELECT ON system.dashboards to dashboard;
The username can be provided as a URL param: <your_clickhouse_url>/dashboard?user=dashboard.
Enter the password you used when creating the dashboard user to log in.
You can see the SQL query used by the application to load the dashboard definition on the top bar.
  1-- Load dashboard definition
2SELECT title, query FROM system.dashboards WHERE dashboard = 'Overview'
The query filter in the dashboard field is set to "Overview". Different sets of dashboards are designed for specific purposes. By default, one set of dashboards is for local deployments ("Overview") and another for Cloud deployments ("Cloud Overview").
Out-of-box visualizations #
The default charts in the Advanced Dashboard are designed to provide real-time visibility into your ClickHouse system. Below is a list with descriptions for each chart. They are grouped into three categories to help you navigate them.
ClickHouse specific:
These metrics are tailored to monitor the health and performance of your ClickHouse instance.
- Queries Per Second: Tracks the rate of queries being processed.
- Selected Rows/Sec: Indicates the number of rows being read by queries.
- Inserted Rows/Sec: Measures the data ingestion rate.
- Total MergeTree Parts: Shows the number of active parts in MergeTree tables, helping identify unbatched inserts.
- Max Parts for Partition: Highlights the maximum number of parts in any partition.
- Queries Running: Displays the number of queries currently executing.
- Selected Bytes Per Second: Indicates the volume of data being read by queries.
System health specific:
Monitoring the underlying system is just as important as watching ClickHouse itself.
- IO Wait: Tracks I/O wait times.
- CPU Wait: Measures delays caused by CPU resource contention
- Read From Disk: Tracks the number of bytes read from disks or block devices
- Read From Filesystem: Tracks the number of bytes read from the filesystem, including page cache.
- Memory (tracked, bytes): Shows memory usage for processes tracked by ClickHouse.
- Load Average (15 minutes): Report the current load average 15 from the system
- OS CPU Usage (Userspace): CPU Usage running userspace code
- OS CPU Usage (Kernel): CPU Usage running kernel code
ClickHouse Cloud specific:
ClickHouse Cloud stores data using object storage (S3 type). Monitoring this interface can help detect issues.
- S3 Read wait: Measures the latency of read requests to S3.
- S3 read errors per second: Tracks the read errors rate.
- Read From S3 (bytes/sec): Tracks the rate data is read from S3 storage.
- Disk S3 write req/sec: Monitors the frequency of write operations to S3 storage.
- Disk S3 read req/sec: Monitors the frequency of read operations to S3 storage.
- Page cache hit rate: The hit rate of the page cache
- Filesystem cache hit rate: Hit rate of the filesystem cache
- Filesystem cache size: The current size of the filesystem cache
- Network send bytes/sec: Tracks the current speed of incoming network traffic
- Network receive bytes/sec: Tracks the current speed of outbound network traffic
- Concurrent network connections: Tracks the number of current concurrent network connections
Customize default charts #
Each visualization has a SQL query associated with it that populates it. You can edit this query by clicking on the pen icon.
There you can edit the query to fit your needs. You can also add your own charts. Click on "Add chart" and edit the query in the newly added chart. For example, let’s add a chart to track the memory used by primary keys. Below is the SQL query that powers the visualization.
1SELECT toStartOfInterval(event_time, INTERVAL {rounding:UInt32} SECOND)::INT AS t, avg(value) FROM merge('system', '^asynchronous_metric_log') WHERE event_date >= toDate(now() - {seconds:UInt32}) AND event_time >= now() - {seconds:UInt32} AND metric = 'TotalPrimaryKeyBytesInMemory' GROUP BY t ORDER BY t WITH FILL STEP {rounding:UInt32}
Note that charts added through the web application are only encoded as query parameters, making them easy to bookmark.
You can directly store the new visualization in ClickHouse if you want a more robust approach.
First, create a new table with the same schema as the default system.dashboards table.
  1-- Create a separate database
2CREATE DATABASE custom;
3
4-- Create the custom dashboard table
5CREATE TABLE custom.dashboards
6(
7    `dashboard` String,
8    `title` String,
9    `query` String
10) ORDER BY ()
Then insert your custom visualization in the table.
  1-- Total size primary keys visualization query
2INSERT INTO custom.dashboards (dashboard, title, query)
3VALUES (
4    'Overview',
5    'Total primary keys size',
6    'SELECT toStartOfInterval(event_time, INTERVAL {rounding:UInt32} SECOND)::INT AS t, avg(value) FROM merge(\'system\', \'^asynchronous_metric_log\') WHERE event_date >= toDate(now() - {seconds:UInt32}) AND event_time >= now() - {seconds:UInt32} AND metric = \'TotalPrimaryKeyBytesInMemory\' GROUP BY t  ORDER BY t WITH FILL STEP  {rounding:UInt32}'
7);
Using this query, you can merge the dashboard definition from your custom database with the default one in the web application.
1SELECT title, query FROM merge(REGEXP('custom|system'),'dashboards') WHERE dashboard = 'Overview'
Ensure the dashboard user has the correct grants to access the custom database.
Identifying issues with the Advanced dashboard #
Having this real-time view of the health of your ClickHouse service greatly helps mitigate issues before they impact your business or help solve them. Below are a few issues you can spot using the advanced dashboard.
Unbatched inserts #
As described in the best practices documentation, it is recommended to always bulk insert data into ClickHouse.
A bulk insert with a reasonable batch size reduces the number of parts created during ingestion, resulting in more efficient write-on disks and fewer merge operations.
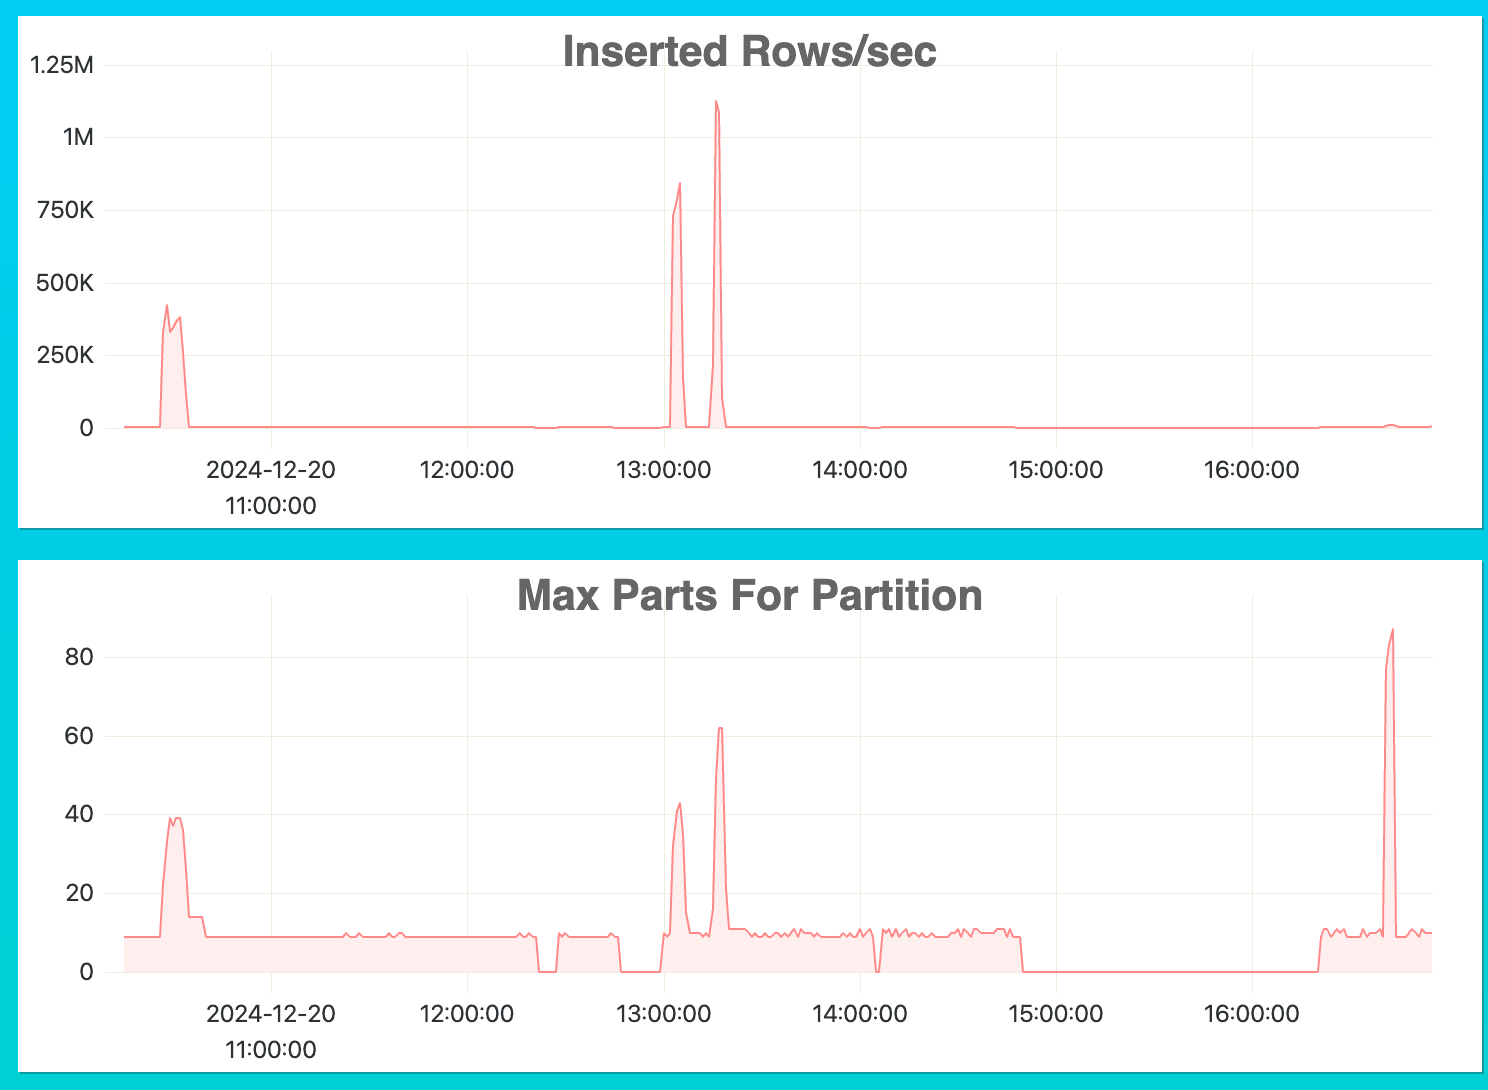
The key metrics to spot sub-optimized insert are Inserted Rows/sec and Max Parts for Partition.
The example above shows two spikes in Inserted Rows/sec and Max Parts for Partition between 13h and 14h. This indicates that we ingest data at a reasonable speed.
Then we see another big spike on Max Parts for Partition after 16h but a very slow Inserted Rows/sec speed. A lot of parts are being created with very little data generated, which indicates that the size of the parts is sub-optimal.
Resource intensive query #
It is common to run SQL queries that consume a large amount of resources, such as CPU or memory. However, it is important to monitor these queries and understand their impact on your deployment's overall performance.
A sudden change in resource consumption without a change in query throughput can indicate more expensive queries being executed. Depending on the type of queries you are running, this can be expected, but spotting them from the advanced dashboard is good.
Below is an example of CPU usage peaking without significantly changing the number of queries per second executed.
Bad Primary Key Design #
Another issue you can spot using an advanced dashboard is bad primary key design. As described in the documentation, choosing the primary key to fit best your use case will greatly improve performance by reducing the number of rows ClickHouse needs to read to execute your query.
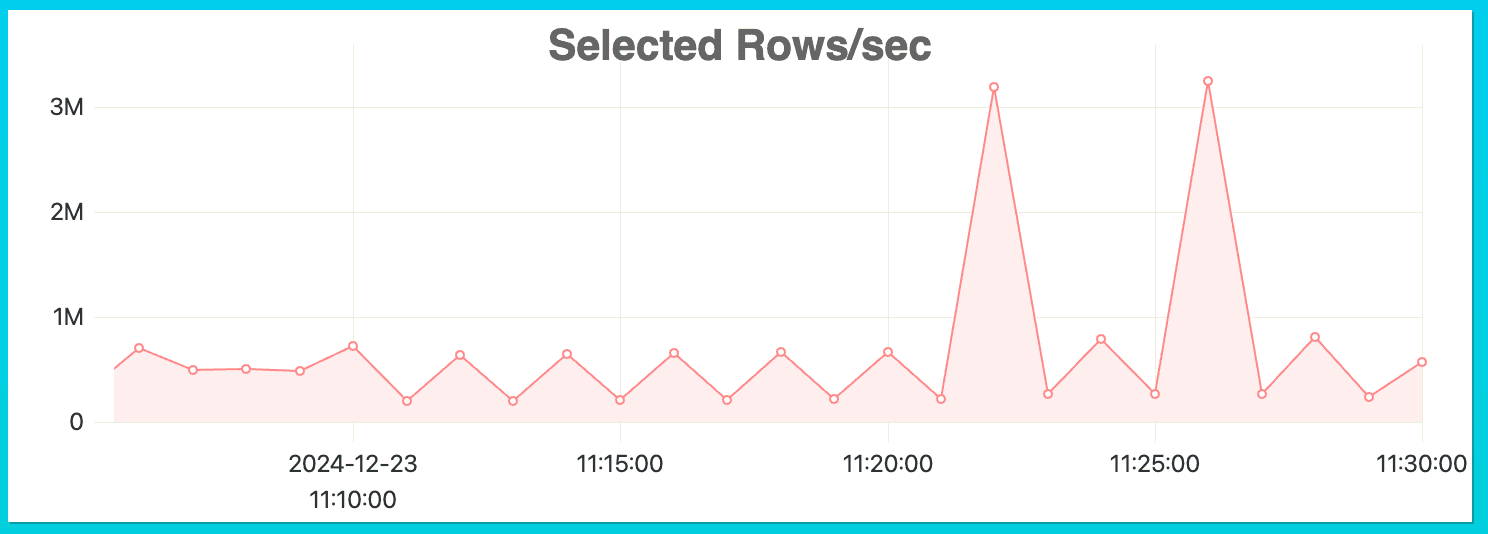
One of the metrics you can follow to spot potential improvements in primary keys is Selected Rows per second. A sudden peak of number of selected rows can indicate both a general increase in overall query throughput as well as queries that select a very large number of rows to execute their query.
Using the timestamp as a filter, you can find the queries executed at the time of the peak in the table system.query_log.
Let’s run a query that shows all the queries executed between 11 am and 11 am to understand what queries are reading too many rows.
  1SELECT
2    type,
3    event_time,
4    query_duration_ms,
5    query,
6    read_rows,
7    tables
8FROM system.query_log
9WHERE has(databases, 'default') AND (event_time >= '2024-12-23 11:20:00') AND (event_time <= '2024-12-23 11:30:00') AND (type = 'QueryFinish')
10ORDER BY query_duration_ms DESC
11LIMIT 5
12FORMAT VERTICAL
13
14Row 1:
15──────
16type:              QueryFinish
17event_time:        2024-12-23 11:22:55
18query_duration_ms: 37407
19query:             SELECT
20    toStartOfMonth(review_date) AS month,
21    any(product_title),
22    avg(star_rating) AS avg_stars
23FROM amazon_reviews_no_pk
24WHERE
25    product_category = 'Home'
26GROUP BY
27    month,
28    product_id
29ORDER BY
30    month DESC,
31    product_id ASC
32LIMIT 20
33read_rows:         150957260
34tables:            ['default.amazon_reviews_no_pk']
35
36Row 2:
37──────
38type:              QueryFinish
39event_time:        2024-12-23 11:26:50
40query_duration_ms: 7325
41query:             SELECT
42    toStartOfMonth(review_date) AS month,
43    any(product_title),
44    avg(star_rating) AS avg_stars
45FROM amazon_reviews_no_pk
46WHERE
47    product_category = 'Home'
48GROUP BY
49    month,
50    product_id
51ORDER BY
52    month DESC,
53    product_id ASC
54LIMIT 20
55read_rows:         150957260
56tables:            ['default.amazon_reviews_no_pk']
57
58Row 3:
59──────
60type:              QueryFinish
61event_time:        2024-12-23 11:24:10
62query_duration_ms: 3270
63query:             SELECT
64    toStartOfMonth(review_date) AS month,
65    any(product_title),
66    avg(star_rating) AS avg_stars
67FROM amazon_reviews_pk
68WHERE
69    product_category = 'Home'
70GROUP BY
71    month,
72    product_id
73ORDER BY
74    month DESC,
75    product_id ASC
76LIMIT 20
77read_rows:         6242304
78tables:            ['default.amazon_reviews_pk']
79
80Row 4:
81──────
82type:              QueryFinish
83event_time:        2024-12-23 11:28:10
84query_duration_ms: 2786
85query:             SELECT
86    toStartOfMonth(review_date) AS month,
87    any(product_title),
88    avg(star_rating) AS avg_stars
89FROM amazon_reviews_pk
90WHERE
91    product_category = 'Home'
92GROUP BY
93    month,
94    product_id
95ORDER BY
96    month DESC,
97    product_id ASC
98LIMIT 20
99read_rows:         6242304
100tables:            ['default.amazon_reviews_pk']
In our little example, we can see the same query being executed against two tables amazon_reviews_no_pk and amazon_reviews_pk. We can assume that someone was testing a primary key option for the table amazon_reviews.
Conclusion #
In this blog post we learnt about the advanced dashboard feature in ClickHouse, how to get started with it and some common issues we can solve or detect using it.
This lightweight monitoring tool is available out-of-box with ClickHouse regardless of your deployment option.
That being said, if you’re looking to monitor ClickHouse with your preferred monitoring tool, we encourage you to do so with documentation examples including Promotheus.
Finally, you can also explore the new ClickHouse Cloud only dashboard feature that allows you to create more rich visualizations.


