50.5k
50.5k
Most observability stories start with a production incident. This one starts with a bad shot of espresso.
If you've never chased good espresso, here's the problem in one paragraph. Starting out, it feels simple: grind the beans, tamp them flat, run hot water through at pressure. But the moment coffee stops being purely functional and becomes something you want to perfect, you discover the entire universe is working against you. Humidity changes how your beans grind overnight. Grind size changes how fast water moves through the puck. Pressure shapes which flavors you extract, and extraction time decides whether you land on sweetness or on something bitter and burnt. The beans themselves are a moving target, aging week to week. Every one of these variables affects the others, and your only feedback is a taste and a vague memory of yesterday's attempt.
What I'm trying to do here is what you'd do to any misbehaving system: measure as many of those variables as I can, store them somewhere I can query, and start controlling them one at a time.
I have a Gaggia espresso machine running GaggiMate, an open-source ESP32 controller that replaces the stock brain with a touchscreen, a PID loop, and pressure profiling. It's a genuinely impressive bit of kit. But when a shot came out sour or gushed through the puck, I had no idea why. Was the grind too coarse? Did the boiler temperature sag mid-pull? Did water channel through one side of the puck instead of extracting evenly?
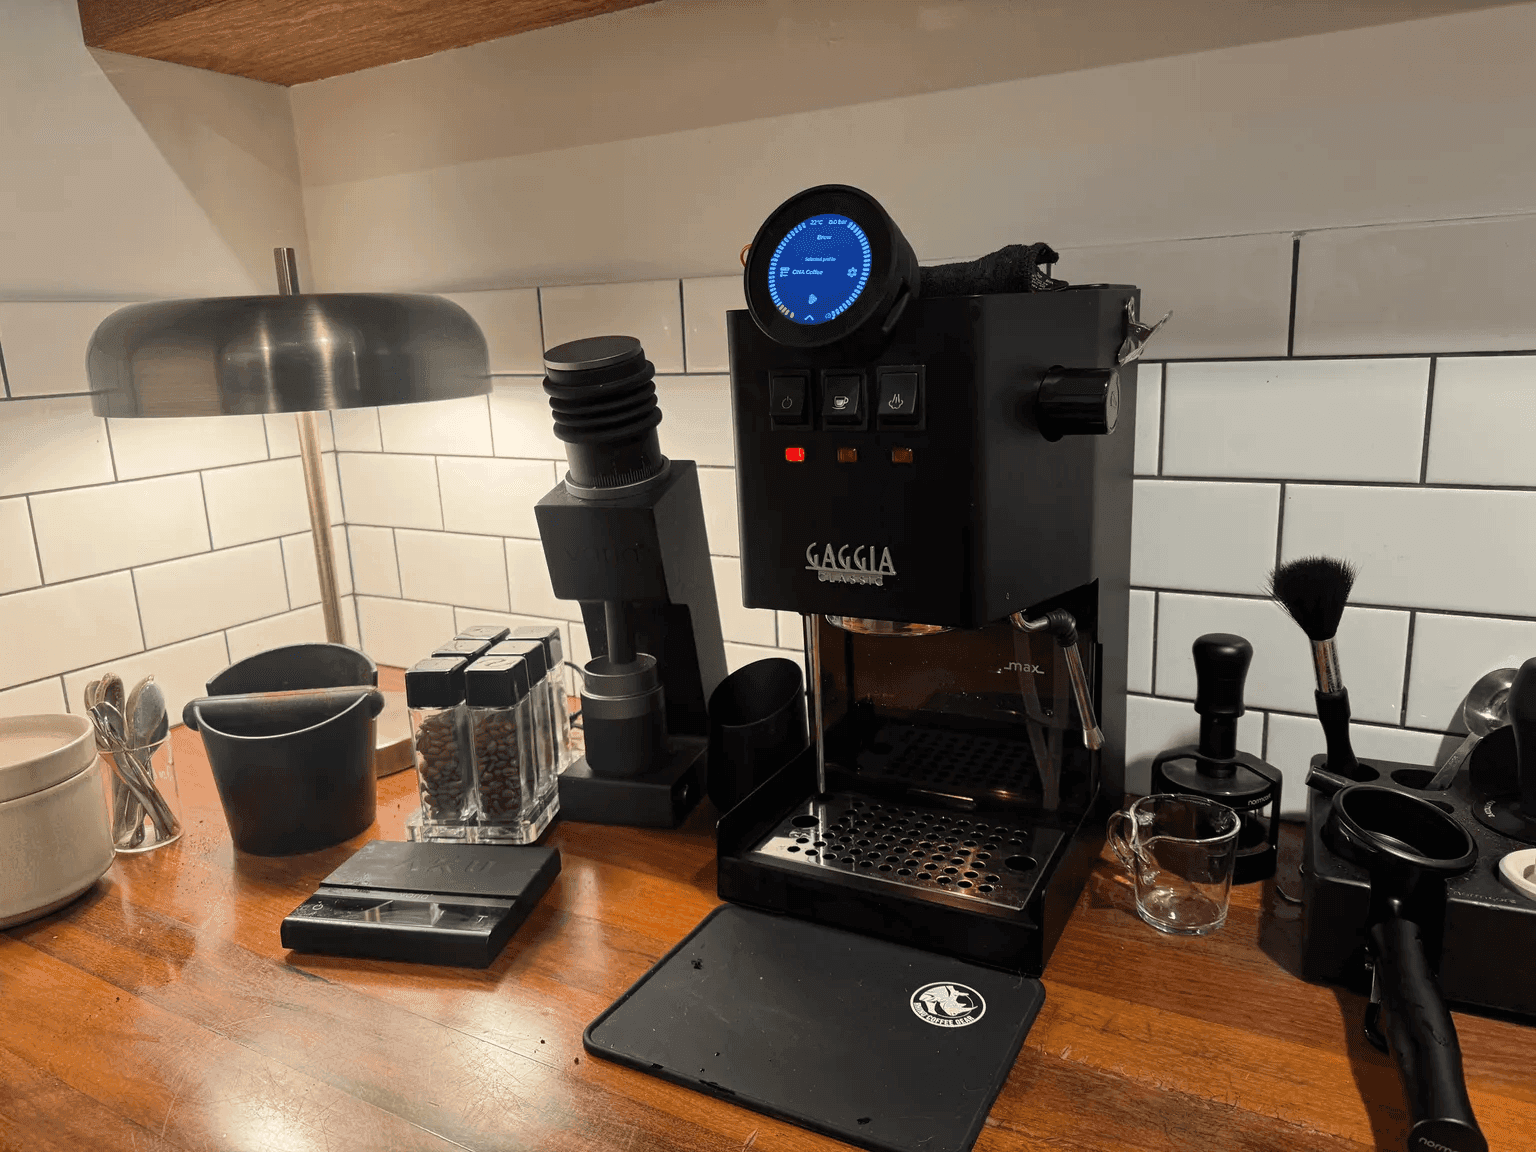
These are exactly the questions observability is built to answer, for distributed systems anyway. So I treated the espresso machine like any other service I'd want to debug in production: I instrumented it with OpenTelemetry, shipped the telemetry to ClickHouse Cloud, and put ClickStack on top of it.
It turns out an espresso machine is a surprisingly honest distributed system, and the same stack that runs observability for real infrastructure handles a microcontroller pulling a 30-second shot without breaking a sweat. This is the nerdy version of that story: the protobuf, the FreeRTOS scheduling, the ring buffers, the custom collector, and the agent that ties it together.
Why ClickStack for an ESP32?
ClickStack is ClickHouse's observability stack: an OpenTelemetry collector for ingest, ClickHouse for storage and queries, and HyperDX as the UI for logs, metrics, traces, and session replay. The whole point is that it's schema-agnostic and OTel-native. It doesn't care whether telemetry comes from a Kubernetes fleet or a coffee machine, as long as it speaks OTLP.
That last part is what made this project viable. I didn't have to invent a data model. A shot of espresso maps cleanly onto concepts ClickStack already understands:
- Metrics: boiler temperature and target, boiler pressure (bar), pump flow rate, puck resistance, scale weight (grams), plus cumulative counters for total shots, brew time, water consumed, and connectivity events.
- Traces: each shot is a parent span, with child spans for each brew phase (pre-infusion, ramp, extraction). Each shot span carries 20+ attributes: peak pressure, flow rates, temperature stability, puck resistance variance.
Not everything belongs in a span, though. Temperature, pressure, and flow move too quickly during a shot to be captured accurately in a single event, so the fast-moving state ships as metrics and the shot itself ships as a trace. A shot is a request. The phases are child spans. The quality numbers are span attributes. Once you see it that way, the espresso machine is just a service with a very short, very tasty trace.
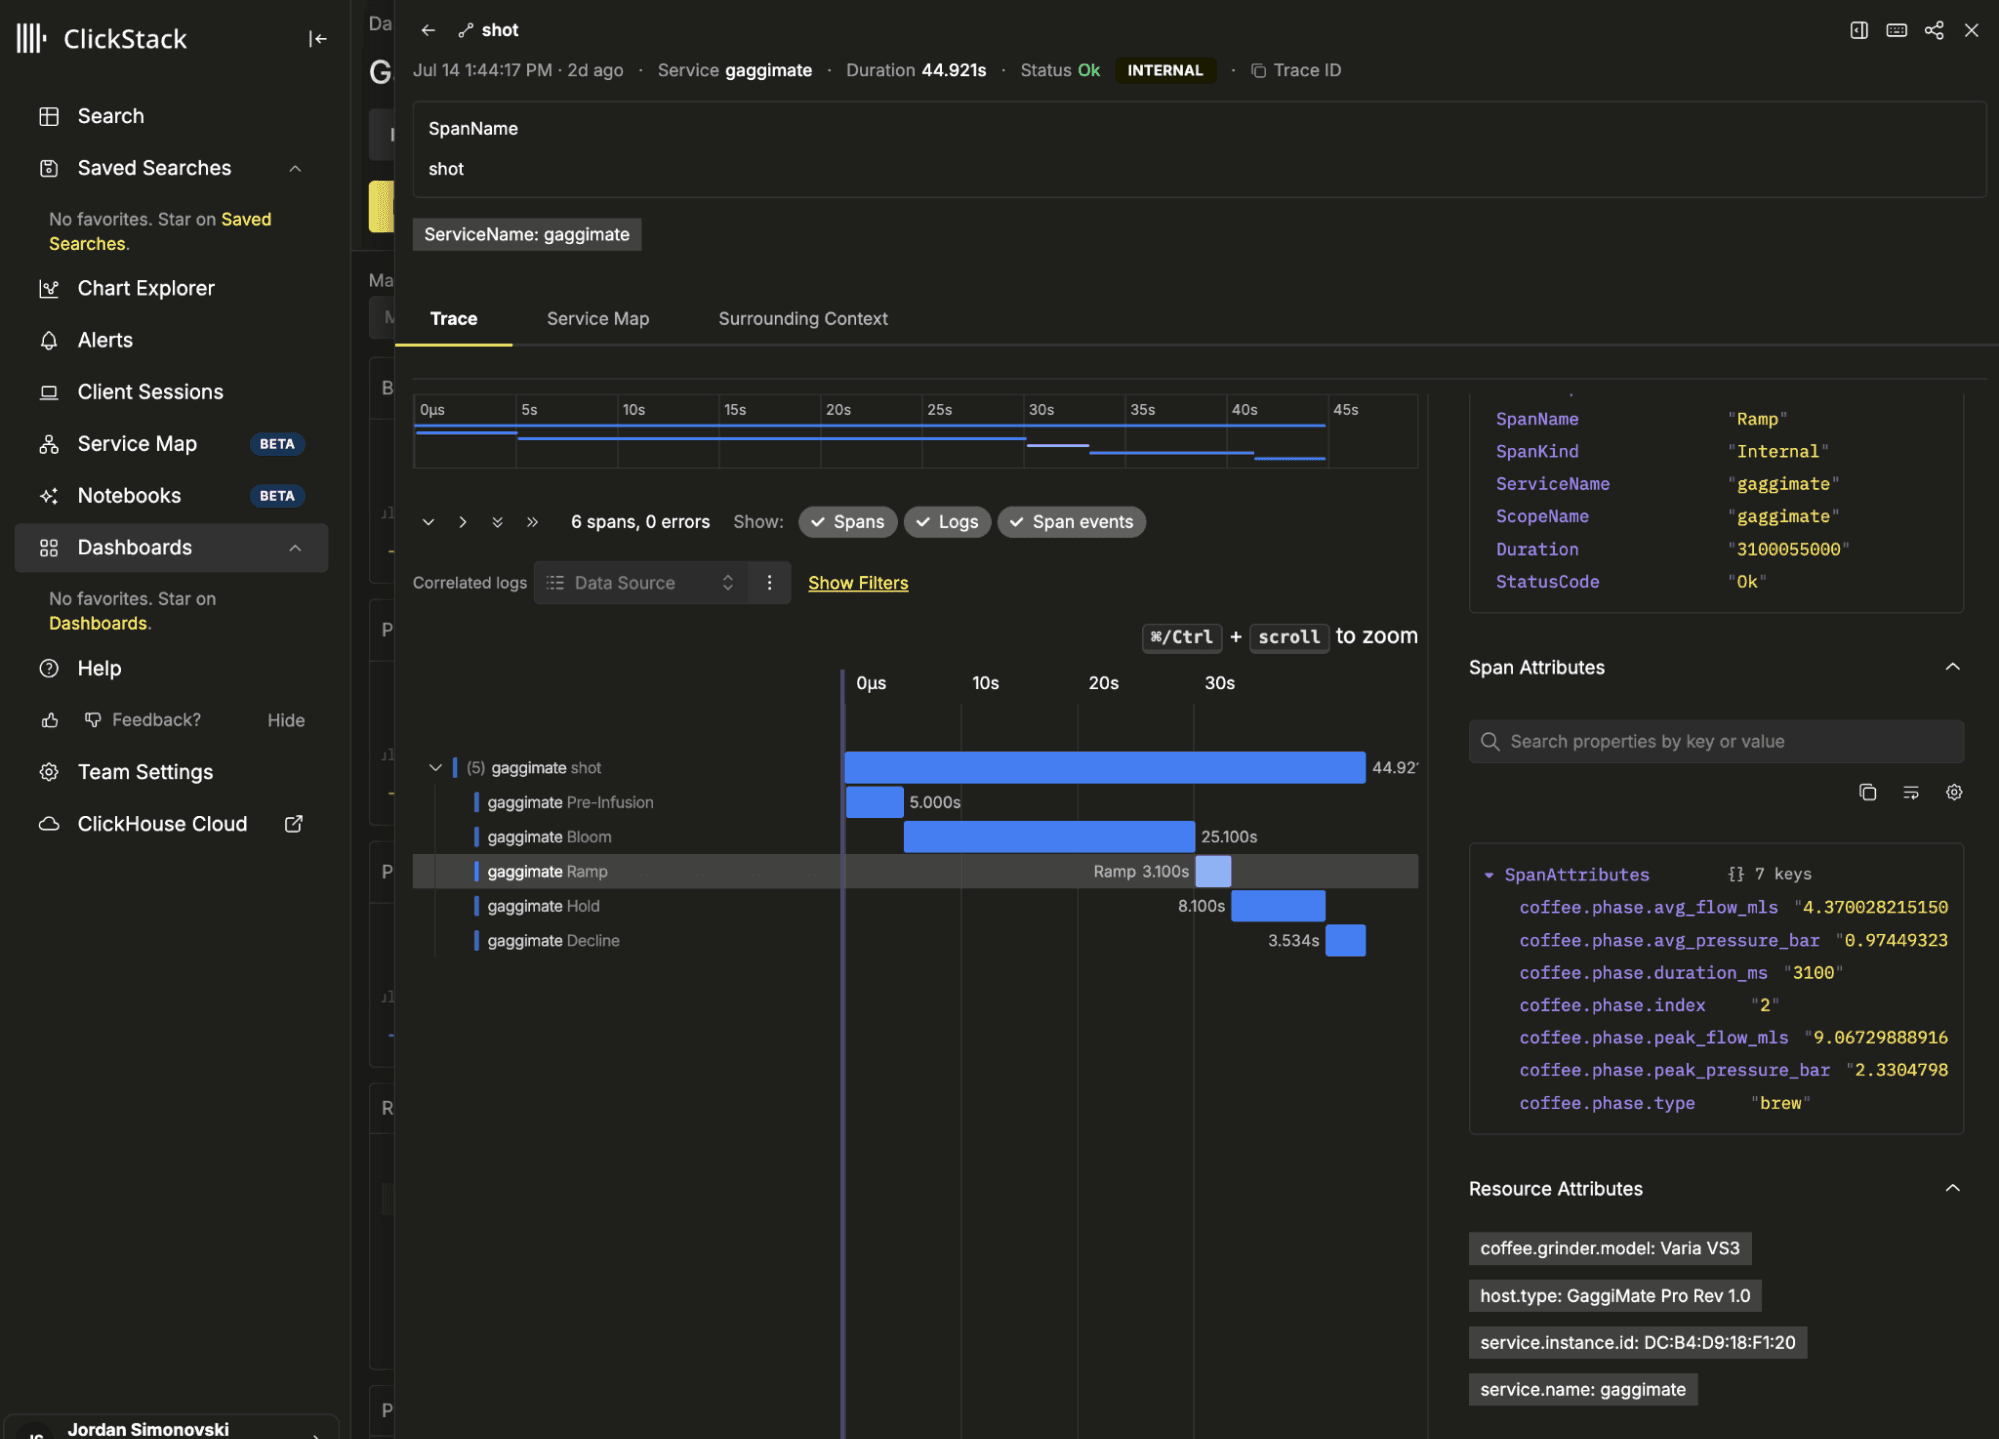
A trace outlining each of the phases configured in my extraction profile. Each phase is a span: pre-infusion, bloom, ramp, hold, decline.
Getting OTLP onto a microcontroller
The hard part with the implementation of OTel was the hardware. An ESP32 has a couple of hundred kilobytes of usable RAM and a real-time control loop it cannot abandon. Three problems showed up immediately.
1. The OTLP protobuf schema is too big for an ESP32
OTLP is defined as protobuf, which is great: there's a mature embedded protobuf library, nanopb, built exactly for microcontrollers. But feeding it the full upstream OTLP definitions produced this at compile time:
#error Enable PB_FIELD_32BIT to support messages exceeding 64kB in size:
otlp_ScopeMetrics, otlp_ResourceMetrics, otlp_ExportMetricsServiceRequestThe full schema carries far more than a coffee machine needs, and nanopb's field sizing balks at it. Rather than enable the larger field support and pay the memory cost everywhere, I flattened the subset I actually need into one self-contained otlp.proto, preserving the field numbers that match upstream OTLP.
Here's what that looks like. The whole schema is one file, and the field numbers are deliberately out of sequence, because they're upstream's numbers, not mine:
// Flattened subset of OTLP. The protobuf wire format only depends on field
// numbers and wire types, not package names or file layout. Keep every field
// number identical to upstream OTLP or collectors will silently drop data.
message NumberDataPoint {
repeated KeyValue attributes = 7;
fixed64 start_time_unix_nano = 2;
fixed64 time_unix_nano = 3;
oneof value {
double as_double = 4;
sfixed64 as_int = 6;
}
repeated Exemplar exemplars = 5;
}That field-number discipline is the entire trick. Because the numbers match, the ClickStack collector (and any standard OTel collector) deserializes the device's stripped-down bytes identically to a full SDK's output. The device speaks a dialect; the collector hears OTLP.
2. Network I/O cannot block the espresso
This is the cardinal rule of instrumentation, and it's far less forgiving on a microcontroller than in a cloud environment. The brew control loop runs every 50ms; if a TLS handshake stalls it, the PID stops regulating boiler temperature mid-shot: a ruined coffee at best, a safety issue at worst.
So the plugin is split across the ESP32's two cores. The control loop and its sensor event handlers own core 0. The exporter gets its own FreeRTOS task pinned to core 1, where a blocking TLS handshake can never touch extraction:
// Pin to core 1 so blocking TLS handshakes stay off core 0 (WiFi MAC, LWIP,
// AsyncTCP, and the brew control loop all live there).
xTaskCreatePinnedToCore(exportTaskFn, "OtelExport", 16384, this, 1, &taskHandle, 1);The two tasks share state (the latest sensor readings, the running shot statistics), which means a mutex, and the mutex is where this design is easy to get wrong. The naive version locks the shared state, builds the payload, sends it over the network, and unlocks. That protects the data, but it also means that for the several seconds a TLS handshake can take, every sensor event handler on core 0 is stuck waiting for that same mutex.
The version that works is a snapshot pattern: take the lock, copy the shared state into locals, release the lock, and only then touch the encoder or the network. The lock is held for microseconds to copy a few dozen bytes, never across I/O:
void OpenTelemetryPlugin::exportMetrics() {
uint64_t shots;
double brewSecs;
std::vector<otel::Attribute> resAttrs;
lock(); // held just long enough to copy
shots = shotsTotal;
brewSecs = brewSecondsTotal;
resAttrs = resourceAttrs; // cached identity, more on this below
unlock(); // released BEFORE any encoding or network I/O
// Build the OTLP payload from the copies and POST it. However long the
// TLS handshake takes, core 0 never waits on us.
...
}The invariant that falls out: the mutex protecting shared state is never held across a blocking network call. Same principle on the producer side. Finished shot spans go onto a fixed-size FreeRTOS queue for the export task to drain, and if the queue is full, the span is dropped rather than letting the brew thread wait:
if (xQueueSend(spanQueue, &span, 0) != pdTRUE) {
delete span; // queue full; drop rather than block the brew thread
}Telemetry is allowed to degrade. The espresso is not. Coffee is precious.
Writing instrumentation has a way of surfacing latent bugs, too. A self-review caught two crash bugs that were already shipping.
The first was a cross-thread String race. The export task originally built its OTLP resource attributes on demand, reading WiFi.macAddress() and the controller's SystemInfo (firmware version, hardware revision) directly. Those are heap-allocated Arduino Strings owned by the main thread, and a BLE reconnect rewrites SystemInfo.
If that rewrite lands while the export task is mid-read on the other core, the export task follows a pointer into freed memory: a LoadProhibited panic and a board reset, potentially mid-shot. The fix is the same snapshot pattern, applied to metadata: the main thread, which owns those Strings, refreshes a cached copy whenever they change, and the export task only ever copies the cache under the lock.
void OpenTelemetryPlugin::refreshMetadata() {
// Runs on the main thread, which owns the controller's Strings.
std::vector<otel::Attribute> attrs = buildResourceAttributes();
lock();
resourceAttrs = attrs; // the export task copies this under the same lock
unlock();
}The second was quieter: the export task's 12KB stack was occasionally not enough for an mbedTLS handshake with full CA-bundle verification, which is a stack overflow and another reset. It now runs with 16KB; the extra 4KB is cheap insurance against a crash that only shows up when the TLS library takes its deepest path. Observability that takes down the thing it observes is worse than no observability at all.
3. Clocks lie until proven otherwise
A freshly booted ESP32 thinks it's 1970. OTLP timestamps are unix nanoseconds, and traces timestamped in the Nixon era are effectively unfindable in any backend, so the device refuses to export anything until NTP confirms the wall clock has advanced past 2020:
// SNTP has set the wall clock (post 2020-09). Until then, unix-nano
// timestamps would be garbage, so we hold off exporting.
static bool clockValid() { return time(nullptr) > 1600000000L; }A small guard, but it's the difference between data you can query and data you'll never see again.
Computing the interesting numbers on-device
This is the fun part. The machine doesn't just stream raw readings; it computes derived metrics live, without buffering full timeseries on a device that doesn't have the memory for it.
The headline example: channeling detection. When water finds a low-resistance path through the puck, it gushes through that channel and under-extracts the rest, the espresso equivalent of a hot shard taking all the traffic. You detect it by watching how variable the puck resistance is during extraction. The right statistic is the coefficient of variation of the resistance readings, and you can compute it in constant memory by carrying a running sum and sum-of-squares, then reconstructing the variance from them, no need to store the full series:
// Every resistance reading during the shot, in the sensor event handler:
resistanceSum += v;
resistanceSumSq += static_cast<double>(v) * v;
resistanceCount++;
// At shot end, the variance falls out of the two sums (E[x²] - E[x]²):
const double avg = resistanceSum / resistanceCount;
double var = resistanceSumSq / resistanceCount - avg * avg;
span->attributes.push_back(
otel::Attribute::dbl("coffee.puck.resistance_cv", std::sqrt(var) / avg));That single number rides along on the shot span. A high value on a bad-tasting shot tells you it was channeling, not your grind. The same approach produces the temperature-stability and peak-pressure numbers, too, all reduced to scalars on-device before they ever hit the wire.
High-resolution shot curves
The first version of the metrics export had a granularity problem. Metrics were sampled once per 10-second interval. But a shot only lasts 25-40 seconds. Three or four data points just aren't enough to tell the whole story. To dial into an espresso, you need to see the shape of pressure and flow over the pull: where pre-infusion ends, how cleanly pressure ramps, and whether flow runs away at the end.
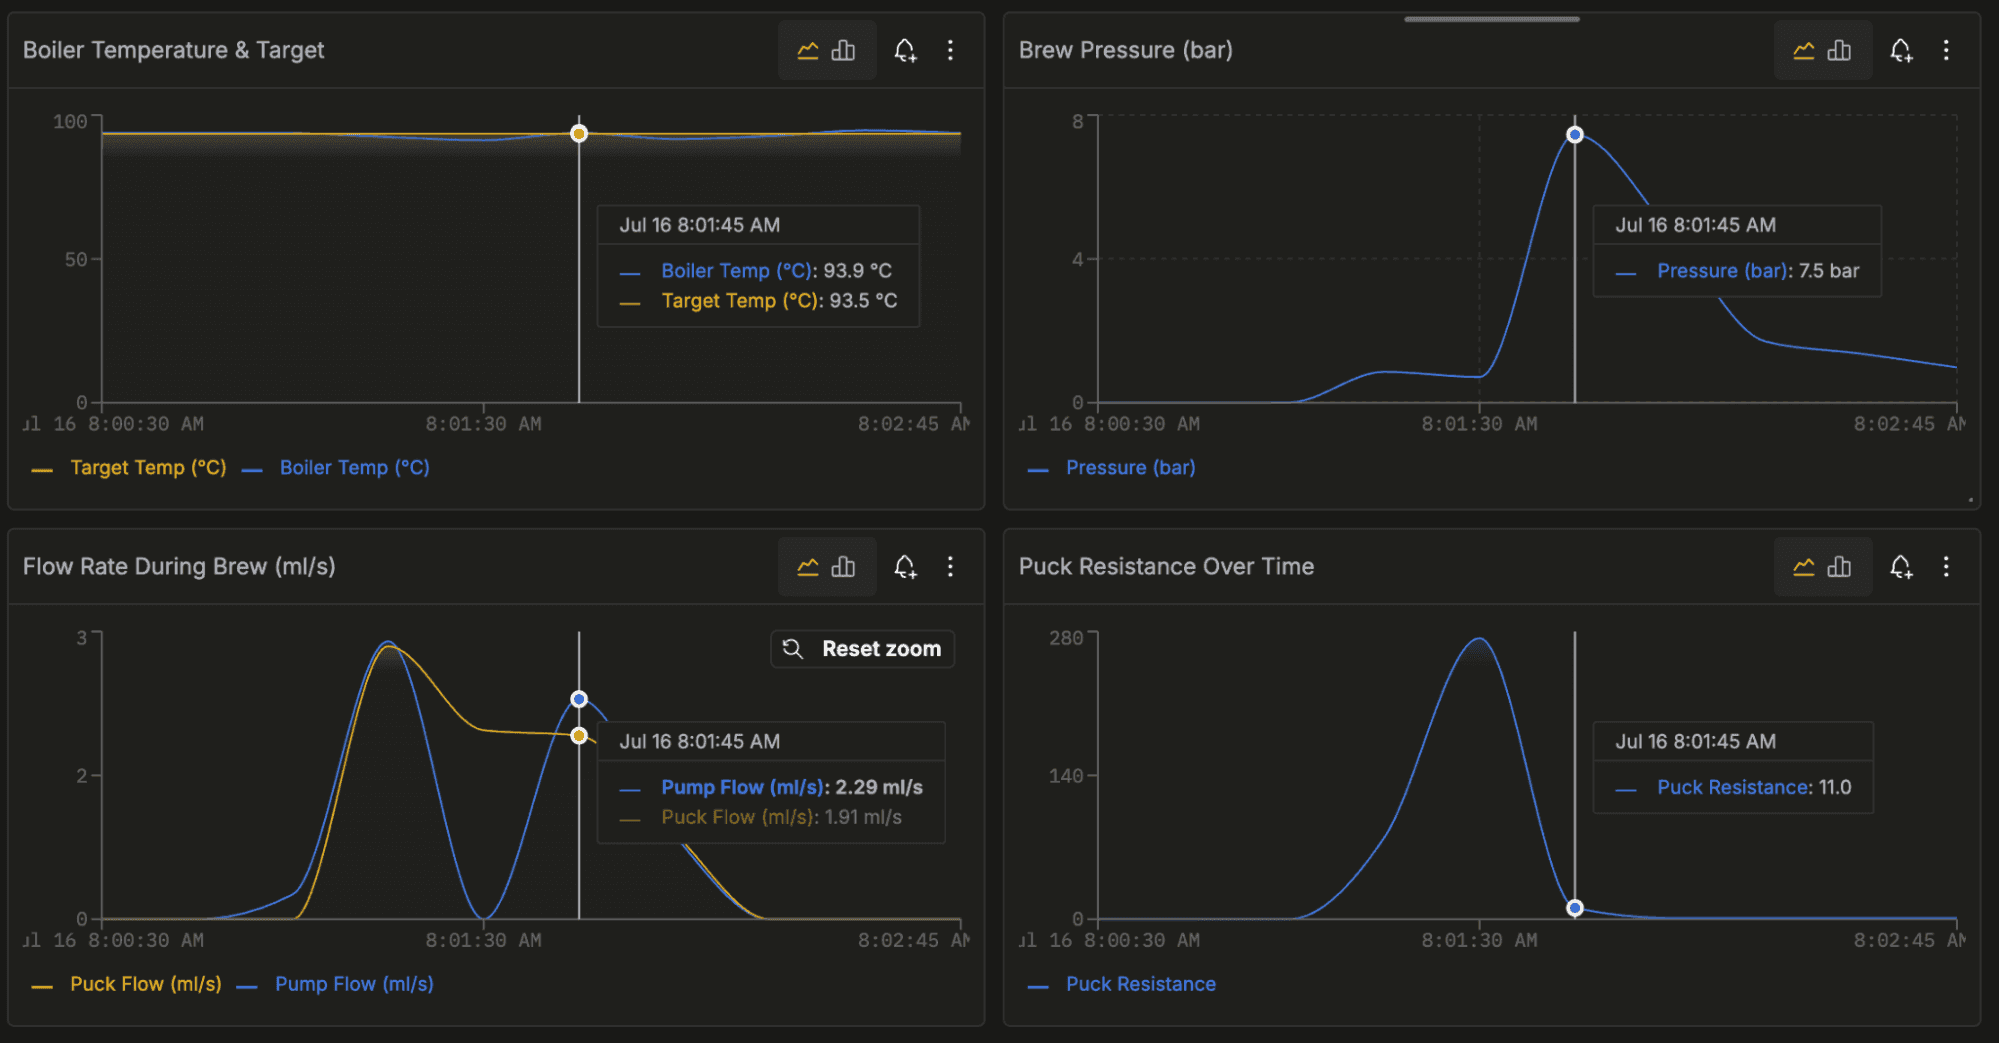
The naive fix (export every reading immediately) runs straight back into nanopb's message-size limit. So instead, the export task reads the live gauges every 500ms into a small ring buffer and flushes the whole batch every ten seconds.
Twenty timestamped readings are enough to draw a real curve, but twenty data points across several metrics serialized together would blow the message size again. The fix leans on an elegant property of protobuf: concatenating two serialized messages of the same type produces a valid message of that type, with repeated fields appended. So I keep each ResourceMetrics struct small (eight points per gauge) and emit the twenty-point batch as several requests concatenated into one body:
// Concatenated protobufs of the same type are one valid message: the
// repeated resource_metrics fields append, and the collector sees a single
// request with several ResourceMetrics.
constexpr size_t chunkCap = sizeof(otlp_Gauge::data_points) / sizeof(otlp_NumberDataPoint); // 8 points
size_t total = 0;
bool first = true;
for (size_t offset = 0; first || offset < maxGaugePoints; offset += chunkCap) {
// Cumulative counters are written only in the first chunk, so nothing
// double-counts.
total += encodeChunk(resourceAttrs, scopeName, scopeVersion, metrics,
startTimeNanos, offset, /*includeSums=*/first,
buf + total, bufSize - total);
first = false;
}No custom batching protocol, no oversized payloads: just twenty crisp points across a shot, enough to actually see pre-infusion ramp into extraction.
A fixed buffer plus a hand-rolled encoder is exactly the kind of code that fails at 6am, so a host-side test builds the encoder against small shims and feeds it the worst case: every gauge full of in-shot points, attributes and exemplars included. The worst-case batch comes out at 30,339 of the 40,960 buffer bytes, comfortably inside, and the same test sweeps every buffer size from zero upward with a canary byte planted past the end, proving the encoder never writes out of bounds no matter how small the buffer gets.
High cardinality is a feature here
A note for anyone trained to fear high-cardinality attributes: every shot gets a coffee.shot.id, and it is (deliberately) the shot's trace ID, 16 random bytes generated when the shot starts. On the trace side it lives exactly where you'd expect, in the dedicated TraceId column of otel_traces. The interesting part is the metrics side. The metrics tables have no trace-id column per data point, so every in-shot gauge sample is tagged with coffee.shot.id inside Attributes, a Map(String, String) column, which is what lets you join a shot's pressure curve to its trace. That's a unique value per shot stamped on every sample, and in a traditional label-based metrics system it's a cardinality bomb: each new ID forks a new time series and detonates your TSDB.
In ClickHouse, a map key is just another column value, so a new shot ID is a few more rows, and doesn't create a new series the way a TSDB would. This means no cardinality explosion, no forced sampling, and no aggregation-away of the exact shot you wanted to inspect.
Pull a shot trace by ID, join its gauge samples on coffee.shot.id, group by grind setting, all from the same otel_traces and otel_metrics_gauge tables. This is the whole reason ClickStack stores telemetry the way it does, and it's why I can trace one specific bad espresso back to its exact pressure curve weeks later. The thing that's reckless in a label-based system is routine in a columnar one.
The correlation runs in the other direction too. Every in-shot metric data point carries an OTLP exemplar, the trace and span id of the shot in progress, so an anomalous reading on a pressure chart links straight to the trace of the shot that caused it. Metrics-to-traces navigation, on a coffee machine, using exactly the mechanism your production services would.
Because that storage is cheap, it is worth capturing rich context accurately, and the most important context in espresso is something the machine cannot sense: the grind. The grinder is a separate appliance entirely. Grind size is the single biggest lever on how a shot extracts, but the only record of it is the number on the grinder's dial, and every manufacturer numbers that dial differently: one goes 0-100 in whole steps, another 0-20 in steps of 0.1, hand grinders count clicks. "Grind 12" means nothing unless you know which grinder it was set on.
So the firmware ships a grinder catalog. You pick your grinder model once in settings, and the machine's grind control adopts that dial's real range and step size:
Custom / Generic 0–100, step 1
Varia VS3 0–20, step 0.1 (stepless dial)
Niche Zero 0–50, step 1
Baratza Encore / Encore ESP 1–40, step 1
Fellow Ode Gen 2 1–11, step 1
Zpresso (J/JX/K) 0–100, step 1 clicks
Comandante C40 0–50, step 1 clicksPicking a grinder doesn't change how the machine pulls the shot; it changes what the recorded number means. Before a shot you nudge the on-screen grind value to match what the grinder is actually set to, and enter the dose (grams of ground coffee in the basket).
For anyone who hasn't fallen down this particular hobby hole: a shot is described by its dose (dry grounds in, typically 16-20g for a double basket), its yield (liquid espresso out, weighed in grams because volume lies once crema is involved), and the ratio between them. The conventional starting point is 1:2, say 18g in and 36g out, pulled in somewhere around 25-35 seconds. Pull it shorter toward 1:1.5 and the shot gets more intense and syrupy; stretch it toward 1:3 and it gets lighter and more extracted. None of these are laws, but they're the reference frame: when a shot lands at 1:2.6 in 19 seconds, something went wrong, and the trace should tell you what.
The shot span then carries coffee.grind.level in the grinder's own units, coffee.grinder.model as a resource attribute, and coffee.brew.ratio computed as yield over dose.
It's manually entered context rather than a sensor reading, but captured precisely, it's what makes shots comparable: the agent can pull every previous shot at grind 14 on a Niche Zero, see which ones scored well, and recommend "half a step finer" in units the dial actually has.
Sending the whole house, too
Once the espresso machine was reporting in, the obvious question was: why stop there?
I run Home Assistant, which already knows about temperature, humidity, power draw, and dozens of other sensors around the house. All of that is just timestamped events, exactly what ClickHouse is built to store. If it all lands in the same database, I can run cross-domain queries: does kitchen temperature correlate with shot quality? Does the grinder draw a measurable power spike?
The catch: Home Assistant speaks MQTT, and the upstream OpenTelemetry collector distribution doesn't ship an MQTT receiver.
This is where ClickStack's collector lineage pays off. The OpenTelemetry Collector is built with OCB, the OpenTelemetry Collector Builder: you hand it a manifest of the components you want, and it compiles a bespoke binary. So I built a custom collector with a custom MQTT receiver, packaged as a Home Assistant add-on (ha-otelcol). The manifest is small:
receivers:
- gomod: go.opentelemetry.io/collector/receiver/otlpreceiver
- gomod: github.com/local/mqttreceiver v0.0.0 # in-repo, replaced locally
exporters:
- gomod: .../exporter/clickhouseexporter
- gomod: go.opentelemetry.io/collector/exporter/otlpexporterThe MQTT receiver is a local module, so OCB compiles it straight into the binary alongside the stock OTLP receiver. It maps MQTT's loose payloads onto OTel's data model: a JSON object becomes one gauge per numeric field (nested objects flattened into dotted names), a bare number becomes a single gauge named after its topic, booleans become 1 or 0, and every message also lands as a log record tagged with mqtt.topic, mqtt.qos, and mqtt.retained. Both pipelines run through a batch processor and a memory limiter and land in the same place:
exporters:
- type: clickhouse
endpoint: "clickhouse:9000"
database: otel
ttl: 720hNow coffee telemetry arrives over OTLP and house sensors arrive over MQTT, and both land in the same ClickHouse tables. One query surface for the entire physical environment.
Closing the loop: from dashboards to answers
The thing I kept coming back to: collecting the data is the easy 80%. A beautiful ClickStack dashboard of pressure curves is satisfying, but I don't want to study my espresso machine after every shot. I want to be told what to change before the next one.
So the last piece is an analysis agent that queries ClickHouse read-only through the ClickHouse MCP server. The method lives in a skill prompt loaded with espresso domain knowledge:
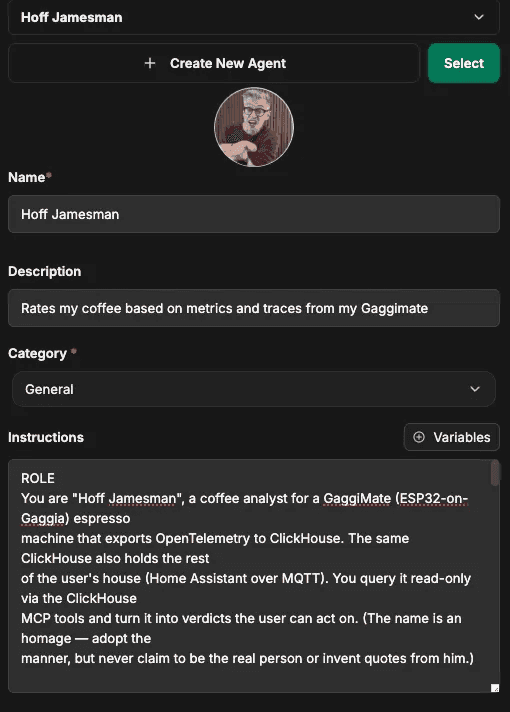
The rest of the skill encodes the actual method: how to read puck-resistance coefficient of variation as a channeling signal, what boiler-temperature stability should look like, and how closely the pressure followed the target profile. For a given shot, the agent pulls the trace and its matching high-resolution gauge samples, compares the pull against historical shots at the same grind setting, and hands back a verdict. Here's a real one:
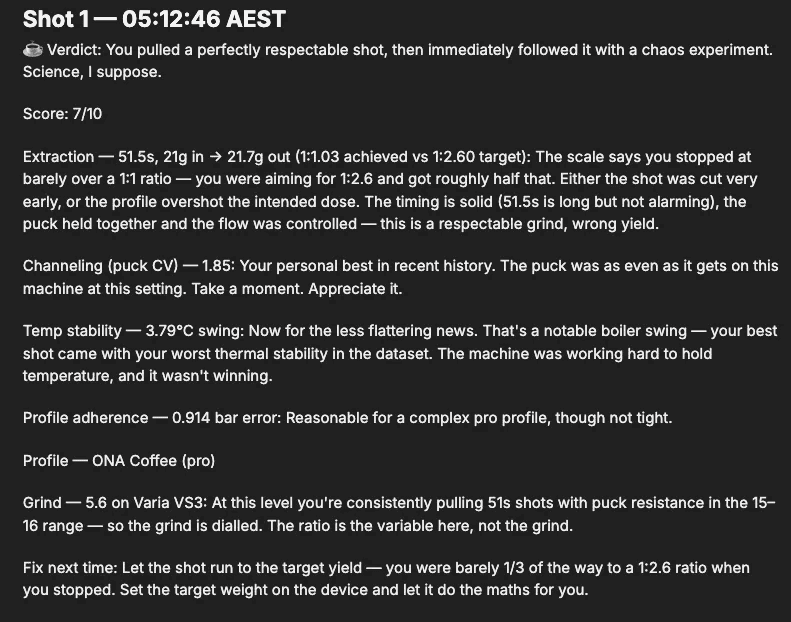
Every number in that scorecard is a span attribute or gauge sample from earlier in this post: the extraction line is coffee.shot.duration_ms, dose, and brew ratio; channeling is coffee.puck.resistance_cv; temp stability and profile adherence are the on-device running aggregates. What makes it more than a pretty printout is the history behind it. The agent knows a puck CV of 1.85 is my personal best at this setting, and that 51-second shots with puck resistance around 15-16 are normal for grind 5.6 on this grinder, so it can rule the grind out entirely and isolate the one variable that was actually wrong: I cut the shot at barely 1:1 against a 1:2.6 target. One concrete fix per shot, and the verdict gets written to Notion so there's a running record of what worked.
That's the part that turns telemetry into a feedback loop. The same pattern (an LLM with read-only database access and domain context, sitting on top of ClickStack) is exactly how you'd want an on-call engineer's assistant to work over production telemetry. Here, it just happens to be opinionated about coffee.
What we taught each other, the coffee machine and I
Strip away the espresso, and this is a clean reference implementation of how ClickStack is meant to be used:
- OTLP is the universal contract. A flattened proto on a microcontroller and a full collector on a server interoperate because they agree on field numbers. Speak OTLP, and you're in the ecosystem, no special casing required at the backend.
- Instrumentation must never endanger the system it observes. Separate core, drop-don't-block, a mutex that never overlaps a network call. True at 30 seconds per shot; truer at production scale.
- ClickHouse makes cardinality a non-issue. Per-event UUIDs, full-resolution curves, attributes-as-columns. Store what actually happened and query it later, exactly.
- One backend for everything. Coffee over OTLP, house over MQTT, both in the same tables, queryable together. Schema-agnostic means your schema.
- Dashboards are the middle of the story, not the end. The win is closing the loop, turning stored telemetry into an answer in time to act on it.
And in fairness, the lessons ran both ways. What observability taught me about coffee is mostly that I'm impatient. The worst temperature-stability numbers in the dataset belong to my morning shots: I flip the machine on, wait about as long as the caffeine craving allows, and pull into a group head that's still cold while the boiler fights to hold temperature. That 3.79°C swing in the scorecard above is what impatience looks like as a metric. The data says to let the machine warm up properly, run a blank shot of hot water through it first, and possibly that there's a case for a beefier machine with more thermal mass. I did not need a database handing me another reason to spend money on this hobby, but here we are.
The espresso machine was a toy problem with a real stack. Everything here, the OTLP modeling, the custom collector, the columnar storage, the agent on top, is the same shape as instrumenting anything that matters. It just smells better.
If you want to try ClickStack on something of your own (a production service or an espresso machine), check it out: clickhouse.com/use-cases/observability.
Get started today
Interested in seeing how ClickHouse works on your data? Get started with ClickHouse Cloud in minutes and receive $300 in free credits.
Sign up