Why ClickHouse and Aspire
If you spend most of your time in ASP.NET Core, two pieces of this demo may be new: ClickHouse and Aspire. A quick intro before we dive in:
Aspire is Microsoft's .NET stack for coordinating distributed services. You write an AppHost project, a small C# program that describes your services, databases, containers, and how they connect, and dotnet run brings the whole graph up locally. Aspire also includes a web UI that shows every resource, streams logs, and renders OpenTelemetry traces and metrics emitted by your services. Once you have used it, going back to juggling launch profiles and a docker-compose.yml feels archaic.
ClickHouse is an extremely fast, open-source, columnar database built for analytical queries over large volumes of data. It is the database you reach for when you want to ask questions like "what was p95 latency by route over the last hour?" across very large request histories and get an answer quickly. Unlike transactional databases like SQL Server or Postgres, ClickHouse is tuned for aggregates over append-mostly data. The mental model worth carrying into the rest of this post: ClickHouse is to analytical SQL what Redis is to caching: purpose-built for one job and very fast at it.
We ship two ClickHouse integrations for Aspire which let you set up a database and a client that talks to it with just a few lines of code. That is the foundation the rest of this sample builds on.
The Demo
In this post we will build an application that uses Aspire to orchestrate:
- A ClickHouse container
- A YARP API gateway
- Two backend APIs for
ProductsandOrders - A background load generator that calls our backend APIs
- An analytics API
- A Blazor dashboard
The gateway is the center of the demo. It does two things:
- Routes traffic to backend services with YARP.
- Records each proxied request into ClickHouse.
At the same time, the gateway emits custom OpenTelemetry metrics that show up in Aspire:
- Request count
- Duration histogram
- Backend failure count
That gives us a useful split:
- Aspire shows live operational telemetry.
- ClickHouse stores the full request history for aggregate analytics.
Try It Yourself
The full source is in the companion repository. You need the .NET 10 SDK and Docker, then:
dotnet run --project src/AppHost/AppHost.csproj --launch-profile httpThe AppHost console will print a login URL for the Aspire dashboard at http://localhost:15000. Open it and watch all the services launch.
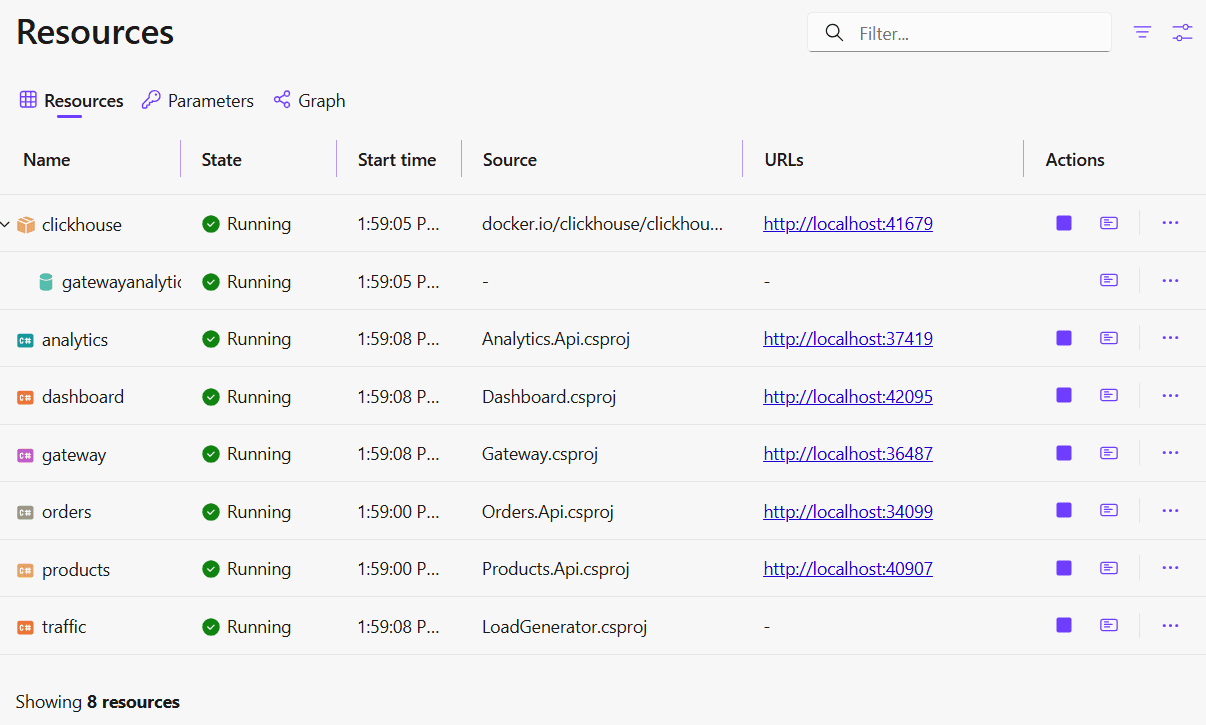
Aspire also generates a service map that shows how the services relate to each other.
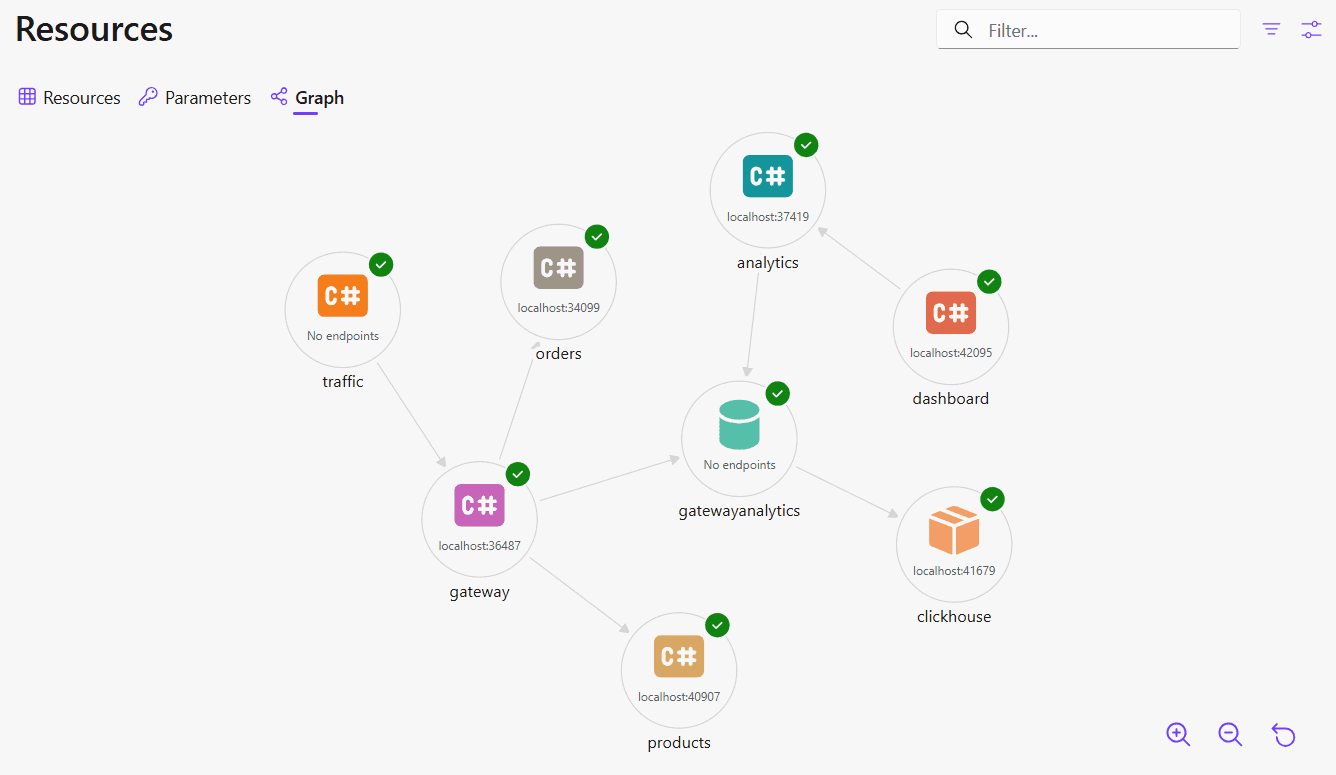
You can also explore structured logs, traces, and metrics through the Aspire dashboard. We will examine those in more detail later.
A background load generator starts automatically once the gateway is ready. It sends a mix of product and order requests, including a small percentage of intentionally degraded checkout calls. Give it a minute to run, then open the analytics dashboard at http://localhost:5100.
Now let's look at the code behind the services and how Aspire orchestrates them.
Adding ClickHouse to AppHost
The AppHost wiring is intentionally small:
var clickhouse = builder.AddClickHouse("clickhouse")
.WithDataVolume();
var analyticsDb = clickhouse.AddDatabase("gatewayanalytics");
builder.AddProject("gateway")
.WithReference(analyticsDb);Here's what this does:
AddClickHouse("clickhouse")runs the officialclickhouse/clickhouse-servercontainer and registers it as a resource. Aspire allocates the port and builds the connection string..WithDataVolume()attaches a named Docker volume so data survives after the application is shut down.AddDatabase("gatewayanalytics")creates a logical database inside the server and exposes it as its own resource, separately injectable and health-checkable.WithReference(analyticsDb)injects that database's connection string into the gateway process. The gateway picks it up later withAddClickHouseDataSource("gatewayanalytics"), noappsettings.jsonplumbing needed.
Projects.Gateway is a strongly typed handle generated by the Aspire AppHost SDK from the <ProjectReference> entries in AppHost.csproj, so the wiring stays compile-time-checked.
In a real production deployment you would usually point at an existing ClickHouse instance rather than run one directly in a local container. The same AppHost can declare an existing instance, whether ClickHouse Cloud, a self-hosted cluster, or anything reachable by a connection string, with builder.AddConnectionString("gatewayanalytics"). The rest stays the same.
Wiring the Rest of the Graph
The full AppHost/Program.cs follows a similar pattern for the rest of the services:
var products = builder.AddProject("products");
var orders = builder.AddProject("orders");
var analytics = builder.AddProject("analytics")
.WithReference(analyticsDb)
.WaitFor(analyticsDb);
var gateway = builder.AddProject("gateway")
.WithExternalHttpEndpoints()
.WithReference(analyticsDb)
.WithEnvironment("Services__ProductsUrl", products.GetEndpoint("http"))
.WithEnvironment("Services__OrdersUrl", orders.GetEndpoint("http"))
.WaitFor(analyticsDb)
.WaitFor(products)
.WaitFor(orders);
var dashboard = builder.AddProject("dashboard")
.WithHttpEndpoint(port: 5100, name: "http")
.WithExternalHttpEndpoints()
.WithEnvironment("Analytics__BaseUrl", analytics.GetEndpoint("http"))
.WaitFor(analytics);
builder.AddProject("traffic")
.WithEnvironment("Gateway__BaseUrl", gateway.GetEndpoint("http"))
.WaitFor(gateway);
builder.Build().Run();It's worth taking a deeper look into some of the calls to understand what is happening under the hood:
WaitFor(...)gates each service's startup on its dependencies. Analytics doesn't start until the ClickHouse database resource reports healthy; the gateway doesn't start until the database, products, and orders are all up. This ensures an orderly boot process for all our services.GetEndpoint("http")is Aspire's service discovery. It returns a handle to the named endpoint on another resource, and at runtime Aspire resolves it to whatever address that resource ended up on. There is no hard-coded URL anywhere.WithEnvironment(key, endpoint)plumbs that resolved URL into the consuming process as a configuration entry, which the service then reads through the normalIConfigurationpipeline.WithExternalHttpEndpoints()makes a resource reachable from outside Aspire's internal network, which is what lets you open the gateway or the Blazor dashboard in a browser. Backend APIs likeproductsandordersdeliberately do not get this, so they are only reachable via the gateway.WithHttpEndpoint(port: 5100, name: "http")on the dashboard pins a stable port. Aspire normally allocates a fresh port every run, which is fine for backend services but inconvenient if you want to bookmark the analytics dashboard URL. The named endpoint also gives the other services a stable handle to call.
In the services themselves, everything is read from configuration. No service contains a hard-coded URL for a peer, and no service has to know whether ClickHouse is a local container, a cloud instance, or a managed cluster.
Using the Driver Client in Services
On the client side, we use the Aspire.ClickHouse.Driver package:
builder.AddClickHouseDataSource("gatewayanalytics");The name matches the database resource declared back in the AppHost. At service startup the integration reads the injected connection string, registers an IClickHouseClient singleton in DI, and adds a health check and OpenTelemetry tracing for queries, all from this one line.
The Gateway Logging Layer
The core middleware pattern is straightforward:
- Start a stopwatch
- Call the next delegate
- Normalize the route
- Capture the current trace id
- Emit gateway metrics
- Enqueue a row for background ingestion
That last step is worth dwelling on. The proxied request must not wait on ClickHouse; if the database is slow or briefly unavailable, we want the gateway to keep serving traffic. So the middleware does not insert anything itself, it simply hands off the row to a bounded in-memory queue:
if (!requestLogQueue.TryEnqueue(logEntry))
{
GatewayMetrics.LogDrops.Add(1, tags);
}The queue uses a bounded System.Threading.Channels channel with FullMode = DropWrite:
Channel.CreateBounded(new BoundedChannelOptions(Capacity)
{
FullMode = BoundedChannelFullMode.DropWrite,
SingleReader = true,
SingleWriter = false,
});DropWrite is the part that keeps the request path safe. If the queue fills up, TryEnqueue returns false immediately. The middleware increments a gateway.log_drops counter (tagged the same way as the rest of the gateway metrics) and moves on. The proxied request never waits on the database, and the dropped-row counter becomes a first-class signal you can alert on.
A background IHostedService drains the channel. Its loop is small: wait for one row, drain whatever else is immediately available into a capped batch, bulk-insert, repeat:
while (!stoppingToken.IsCancellationRequested)
{
batch.Add(await queue.Reader.ReadAsync(stoppingToken));
while (batch.Count < MaxBatchSize && queue.Reader.TryRead(out var more))
{
batch.Add(more);
}
try
{
await client.InsertBinaryAsync("request_logs", batch, InsertOptions, stoppingToken);
}
catch (Exception ex)
{
logger.LogError(ex, "Failed to write {Count} request log rows to ClickHouse.", batch.Count);
}
finally
{
batch.Clear();
}
}Each InsertBinaryAsync call takes a list of POCOs and the driver streams them in ClickHouse's native RowBinary format. Values like Guid, DateTime, and uint round-trip in their native binary representation with no string conversions.
The mapping from .NET property names to snake_case column names is declared on the record itself:
internal sealed record RequestLogRow(
[property: ClickHouseColumn(Name = "request_id")] Guid RequestId,
[property: ClickHouseColumn(Name = "trace_id")] string TraceId,
[property: ClickHouseColumn(Name = "timestamp")] DateTime Timestamp,
// ... remaining columns
[property: ClickHouseColumn(Name = "error_message")] string? ErrorMessage);The POCO has to be registered with the client once so the driver can build its column writer for the type. The pump does it at startup, right after creating the schema:
client.RegisterBinaryInsertType();The insert runs with two ClickHouse-side settings:
private static readonly InsertOptions InsertOptions = new()
{
CustomSettings = new Dictionary<string, object>
{
["async_insert"] = 1,
["wait_for_async_insert"] = 1,
},
};async_insert = 1 tells ClickHouse to batch incoming inserts instead of creating a part per insert call. ClickHouse works best with small numbers of large inserts; async inserts let the server batch incoming data to avoid creating too many new parts.
wait_for_async_insert = 1 means the background writer waits until the insert has been flushed to disk. Without it, ClickHouse would acknowledge the insert before the data is durable, and any crash or restart between acknowledgement and flush could lose rows silently. In a production gateway you might flip wait_for_async_insert to 0 if you can tolerate that small data-loss window, but this sample keeps the safer default.
Schema
The raw table is focused on request analytics:
CREATE TABLE IF NOT EXISTS request_logs (
request_id UUID,
trace_id String,
timestamp DateTime64(6, 'UTC'),
method LowCardinality(String),
route_pattern LowCardinality(String),
path String,
upstream_service LowCardinality(String),
status_code UInt16,
duration_ms Float64,
request_size UInt32,
response_size UInt32,
error_message Nullable(String)
)
ENGINE = MergeTree()
PARTITION BY toYYYYMMDD(timestamp)
ORDER BY (upstream_service, route_pattern, timestamp)
TTL timestamp + INTERVAL 30 DAY;A few of the type choices are worth calling out because they have no direct equivalent in SQL Server or Postgres:
LowCardinality(String)onmethod,route_pattern, andupstream_servicedictionary-encodes the column. ClickHouse stores a small dictionary of unique values plus integer indexes per row, which collapses storage and speeds upGROUP BY/WHEREfilters dramatically for low-cardinality columns.DateTime64(6, 'UTC')is microsecond-precision and bakes the timezone into the column metadata, eliminating the usual UTC-vs-local confusion at query time.UInt16forstatus_codehalves the column footprint vs. a 32-bit default. ClickHouse rewards picking the tightest integer type that fits.Nullable(String)is opt-in: columns are NOT NULL by default andNullablecarries a per-row null bitmap, so it is reserved for fields where null is genuinely meaningful.
The engine clauses carry most of the query performance and retention story:
PARTITION BY toYYYYMMDD(timestamp)splits the table into daily partitions. Time-range queries skip every partition outside the window.ORDER BY (upstream_service, route_pattern, timestamp)is the sorting key. It controls on-disk layout and the sparse primary index. Filters on the leading key columns are fast; filters onpathare not.TTL timestamp + INTERVAL 30 DAYdrops old partitions automatically during background merges. No cleanup job required.
The sample also creates a materialized view called request_stats_mv. If you have not used ClickHouse materialized views before, this is where the schema gets interesting.
A materialized view in ClickHouse is not a cached query. It is a separate table that ClickHouse populates automatically as rows land in the source table. Every insert into request_logs triggers the view's SELECT statement and the result is written into the view's own storage. The view uses AggregatingMergeTree, which means the stored rows are partial aggregation states, not final values.
The key to reading the DDL is the -State / -Merge suffix convention. In the view definition:
countState() AS request_count,
avgState(duration_ms) AS avg_duration,
quantilesTDigestState(0.5, 0.95, 0.99)(duration_ms) AS duration_quantilescountState() does not store a finished count. It stores an intermediate aggregation state that ClickHouse can merge with other states later. When the dashboard queries the view, it uses the corresponding -Merge combinators:
countMerge(request_count) AS request_count,
avgMerge(avg_duration) AS avg_latency_ms,
quantilesTDigestMerge(0.5, 0.95, 0.99)(duration_quantiles) AS percentilesThis is what makes the pattern efficient. The raw request_logs table may have millions of rows, but the materialized view has already reduced them to one partial-aggregate row per service, route, status code, and minute. The dashboard query merges those small intermediate states instead of scanning the full log. The result is that percentile and error-rate panels stay fast regardless of how much traffic the gateway has handled.
The Observability Story
The Aspire dashboard renders traces, metrics, and structured logs from the OTLP feed that every service publishes. Wiring this up through builder.AddServiceDefaults() in each service's Program.cs is straightforward:
builder.Logging.AddOpenTelemetry(logging =>
{
logging.IncludeFormattedMessage = true;
logging.IncludeScopes = true;
logging.AddOtlpExporter();
});
builder.Services.AddOpenTelemetry()
.ConfigureResource(resource => resource.AddService(builder.Environment.ApplicationName))
.WithTracing(tracing =>
{
tracing.AddAspNetCoreInstrumentation();
tracing.AddHttpClientInstrumentation();
tracing.AddOtlpExporter();
})
.WithMetrics(metrics =>
{
metrics.AddAspNetCoreInstrumentation();
metrics.AddHttpClientInstrumentation();
metrics.AddRuntimeInstrumentation();
metrics.AddOtlpExporter();
});The AddOtlpExporter() calls do not need an explicit URL because Aspire sets OTEL_EXPORTER_OTLP_ENDPOINT on each child process to point at the dashboard's collector. The AspNetCore, HttpClient, and Runtime instrumentations cover incoming requests, outgoing HTTP calls, and process-level metrics.
We also declare some custom metrics, which piggyback on the same pipeline without any extra plumbing:
private static readonly Meter Meter = new("Gateway.Telemetry");
public static readonly Counter Requests =
Meter.CreateCounter("gateway.requests", unit: "{request}");
public static readonly Histogram DurationMs =
Meter.CreateHistogram("gateway.duration", unit: "ms");
public static readonly Counter BackendFailures =
Meter.CreateCounter("gateway.backend_failures", unit: "{request}");Each middleware layer tags those instruments with the normalized route, the upstream service, and HTTP status class (2xx, 4xx, 5xx), so users can filter the metrics in the dashboard.
In Aspire
Let's take a look at our custom metrics in the Aspire dashboard. Here we can see the API call duration metric we registered earlier, and we can use the custom tags to filter the data.
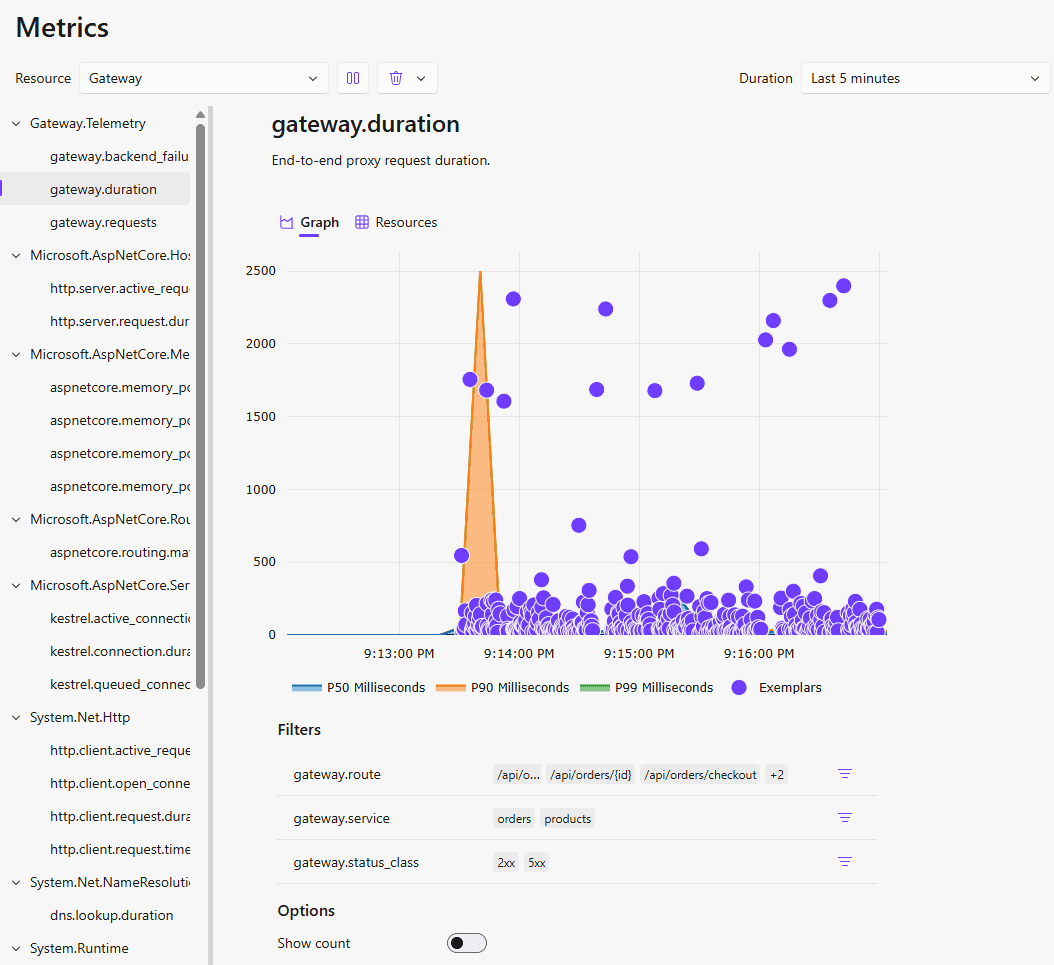
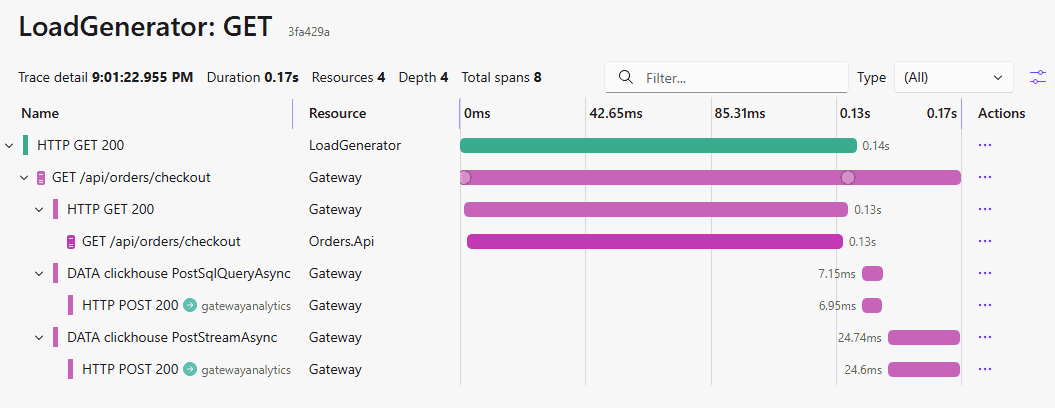
Logs, metrics, and traces are connected. Clicking on one of the exemplars in the metrics chart (or on the trace id of a log) will take you to the corresponding trace, showing all the related spans:
Persistence
One thing worth knowing before you point any of this at production: the Aspire dashboard does not persist what it receives. The logs, traces, and metrics in the dashboard's views are purely in-memory. When the AppHost stops, the history is gone. It's a system designed for the inner dev loop, but it is not a production observability stack.
The good news is that the wiring above does not change when you move beyond development. The services emit standard OTLP, so swapping the dashboard endpoint for a production observability backend is a configuration change. ClickStack, the ClickHouse- and OpenTelemetry-native stack for logs, metrics, and traces, is a natural place to store and query that data with strong performance and compression.
In ClickHouse
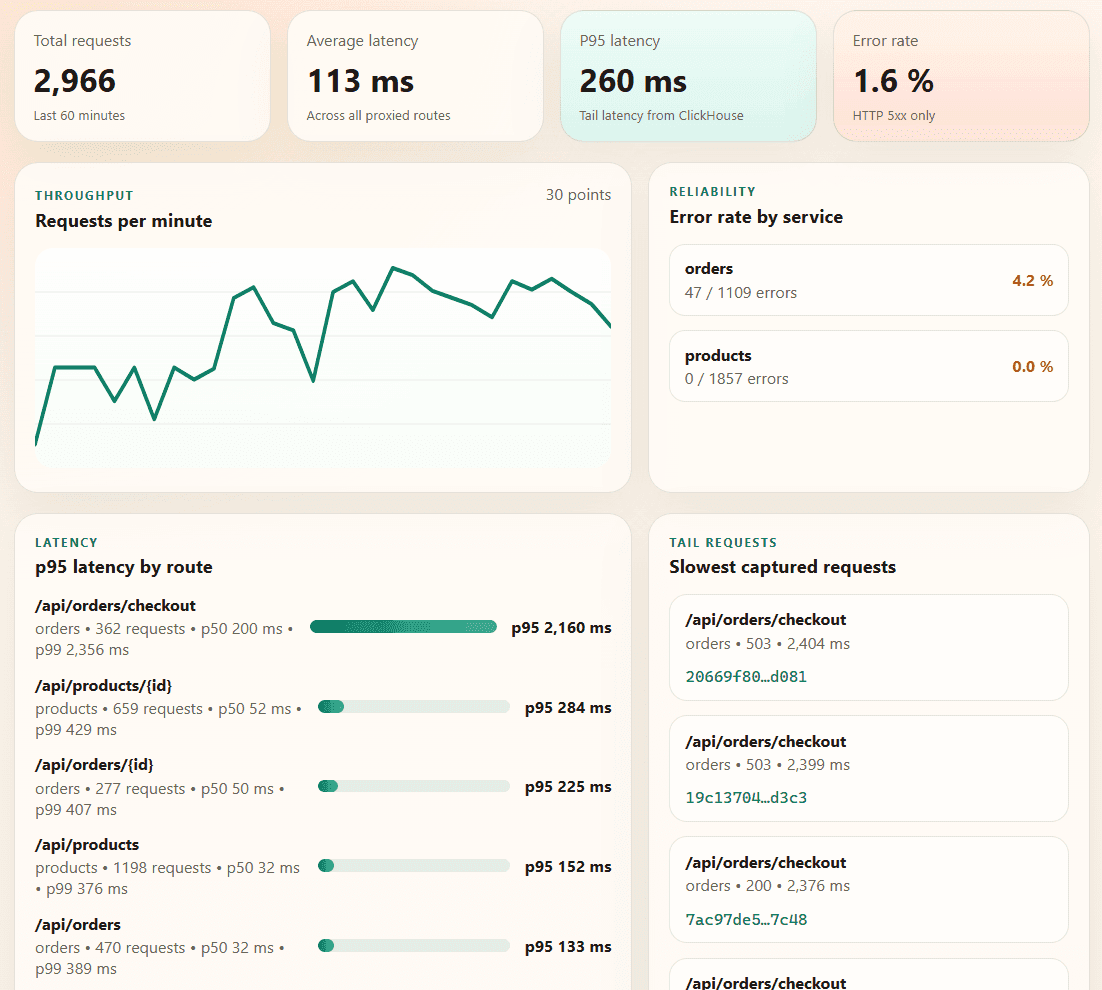
Finally, let's look at the dashboard backed by ClickHouse. This view is intentionally different from the Aspire dashboard. It is not trying to show every span or every live process. It asks analytical questions over the request history: request volume, p95 latency, error rate by service, route-level tail latency, and the slowest recent requests with their trace ids.
The materialized view is what keeps those queries cheap as the raw table grows. Instead of scanning every request for every dashboard refresh, ClickHouse has already reduced the stream into minute-level aggregate states. The dashboard query only merges those states, while the raw request_logs table is still there when we need to drill into individual slow requests or copy a trace_id back into the Aspire traces view.
Summary
Building this demo, we have seen:
- How Aspire can manage ClickHouse as a first-class application resource.
- How AppHost wiring gives us service discovery, dependency ordering, and stable external endpoints without hard-coded URLs.
- How
Aspire.ClickHouse.Drivermakes it easy to build .NET services that query and write to ClickHouse. - How to keep gateway request logging off the hot path with a bounded queue and background ingestion.
- How to store request telemetry in ClickHouse with an efficient schema and a materialized view that precomputes common statistics.
You can explore the full sample, run it locally, and adapt the pieces you need from the companion repo.
Closing
Aspire and ClickHouse fit together naturally for a common .NET problem: understanding distributed systems both while they are running and after enough traffic has accumulated to see patterns.
Start with Aspire for the inner development loop. Add a ClickHouse table when you need history, percentiles, and route-level comparisons. Keep the schema narrow, use low-cardinality dimensions deliberately, and pre-aggregate the views your dashboard will query repeatedly.
From there, the same shape scales easily to production: point Aspire at an existing ClickHouse instance, move gateway writes into a background pipeline, and export OTLP to ClickStack when you are ready.
Get started today
Interested in seeing how ClickHouse works on your data? Get started with ClickHouse Cloud in minutes and receive $300 in free credits.
Sign up


