Introduction #
AWS VPC Flow Logs allow you to capture detailed information about the IP traffic going to and from network interfaces in your VPC. It contains the source and destination IPs, source and destination ports, start and end time, the protocol used, bytes sent and a few other metrics. This data can be useful for debugging security group issues, monitoring ingress and egress traffic as well as checking cross availability zone traffic which helps reduce your cloud bill.
ClickHouse is an open-source column-oriented DBMS for online analytical processing that allows users to generate analytical reports using SQL queries in real-time. In this blog post, we will use ClickHouse to show how easy it can be to analyze Flow Logs.
High-Level Overview #
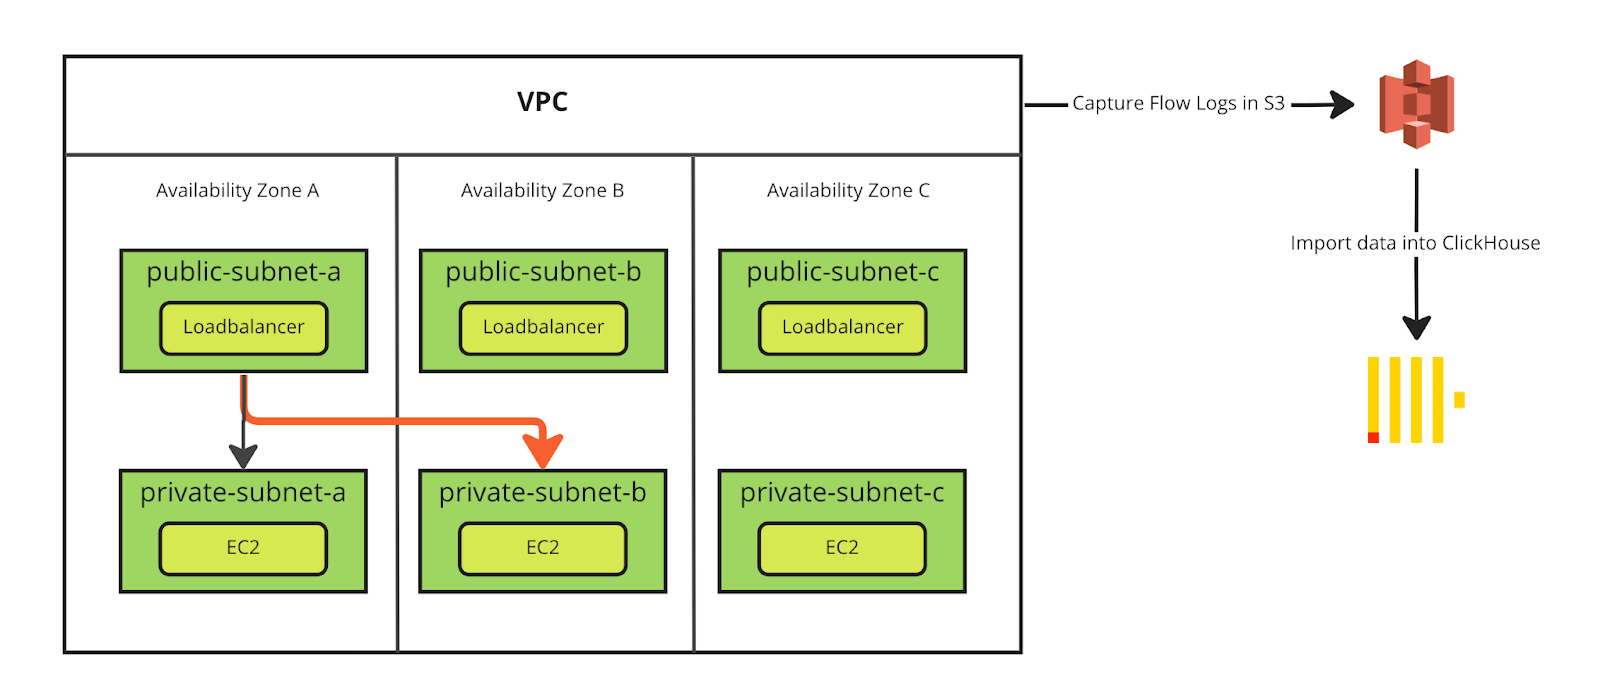
After enabling AWS Flow Logs for the VPC that interests us, I typically gather 24 hours of data to cover a typical business day. To allow for easy importing of the data into ClickHouse, we will store it in parquet format in S3.
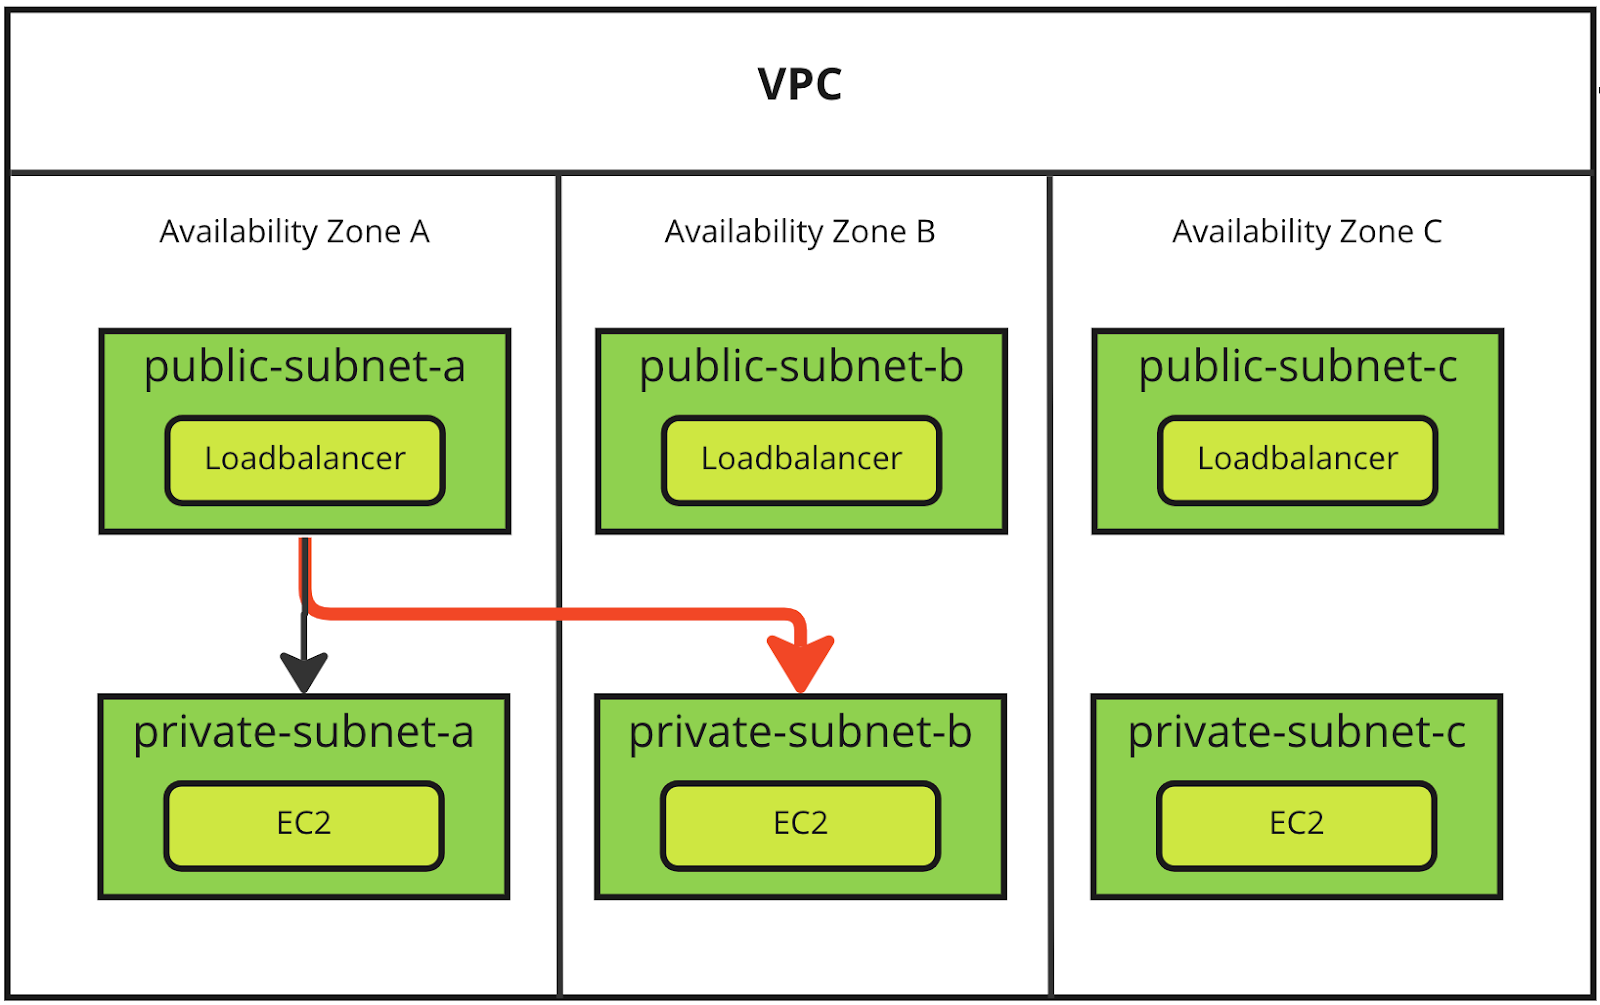
The following diagram shows a typical VPC setup with three public subnets and three private subnets. Since AWS charges a premium for traffic that crosses availability zones (red arrow), our goal is to analyze flow logs to identify these costly component workloads. Once we have identified these components, we can focus our engineering efforts on improving those first.
That last “$0.01/GB in each direction” is the misleading bit. Effectively, cross-AZ data transfer in AWS costs 2¢ per gigabyte, and each gigabyte transferred counts as 2GB on the bill: once for sending and once for receiving." https://www.lastweekinaws.com/blog/aws-cross-az-data-transfer-costs-more-than-aws-says/
Step 1. Create an S3 bucket #
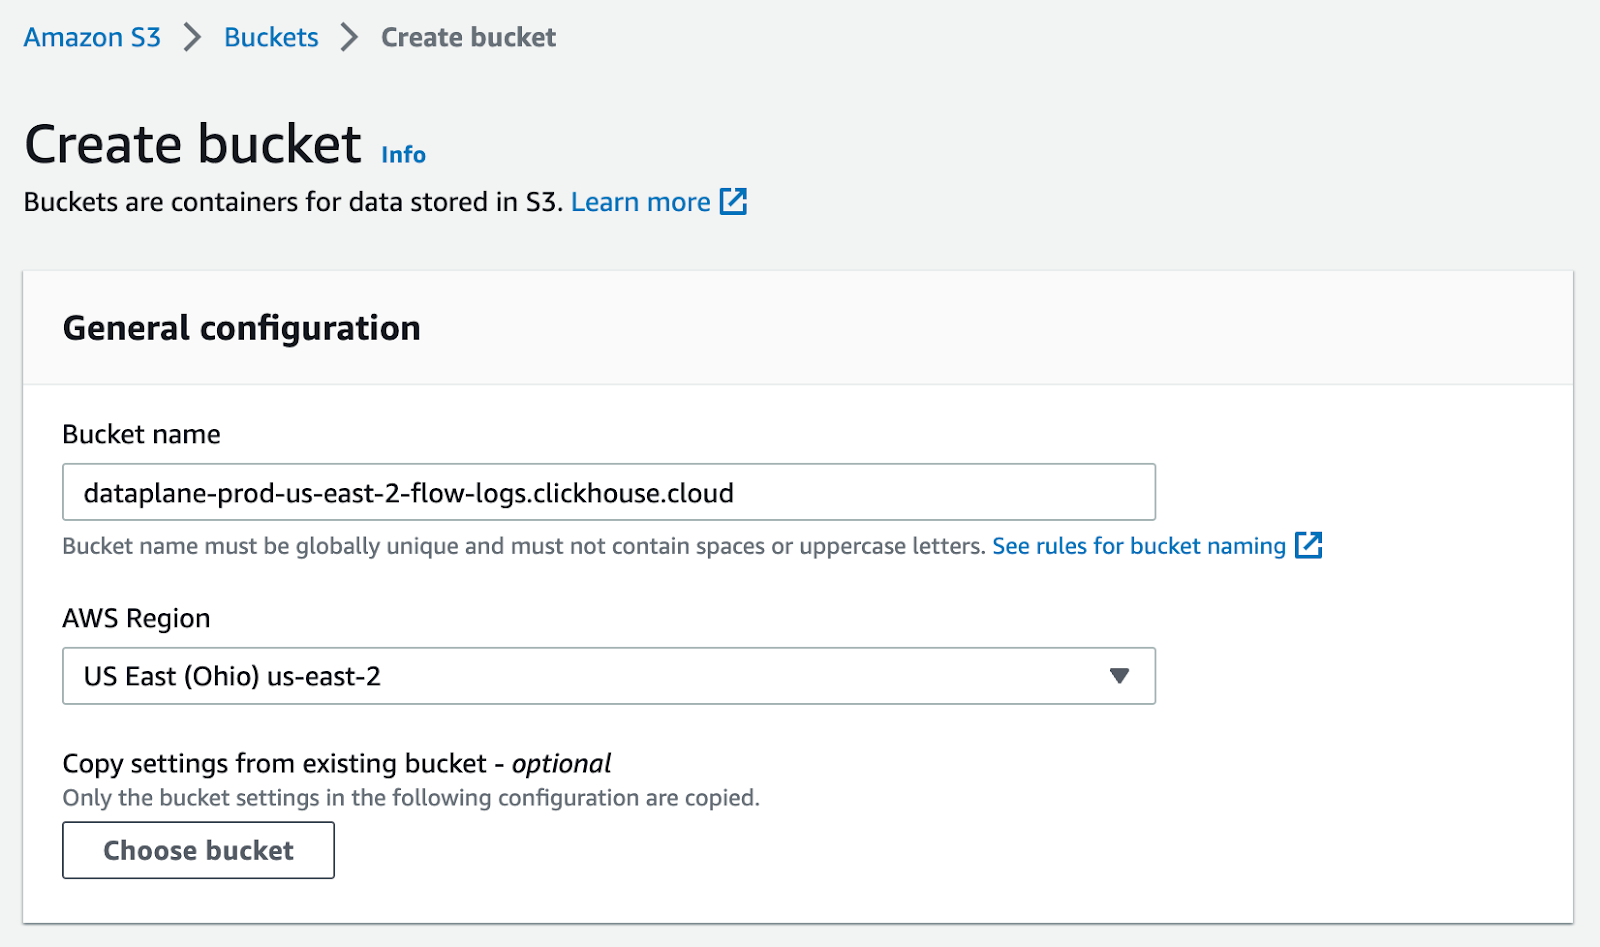
Enough talking. Let's get started. As a first step we need to enable Flow Logs for our VPC. First you need to create an S3 bucket where you want to store the parquet files. Make sure the bucket is not publicly accessible.
Step 2. Enable Flow Logs #
Go to your VPC settings, and under "Actions" enable Flow Logs.
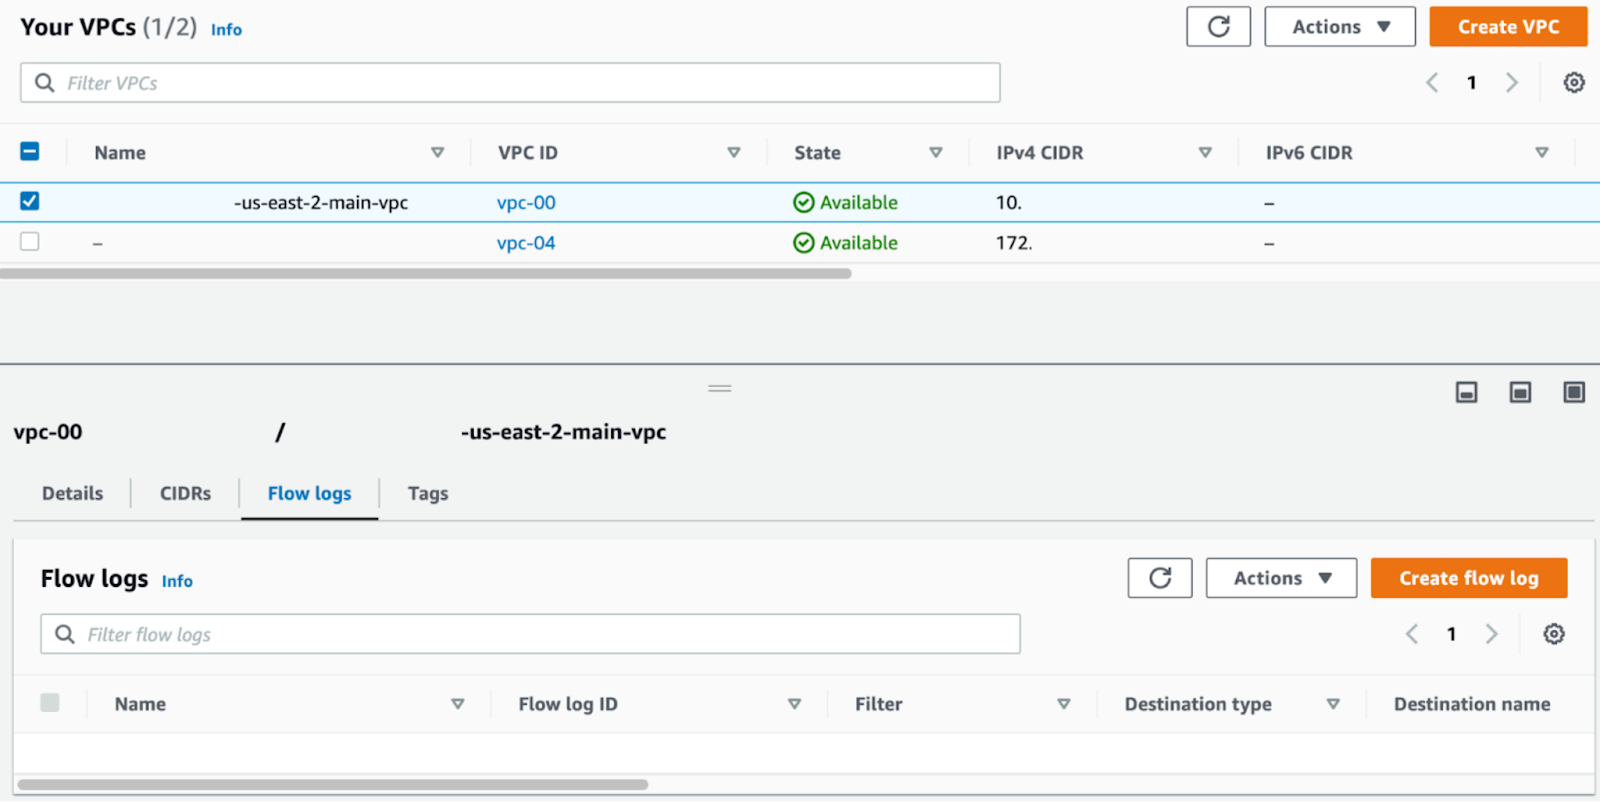
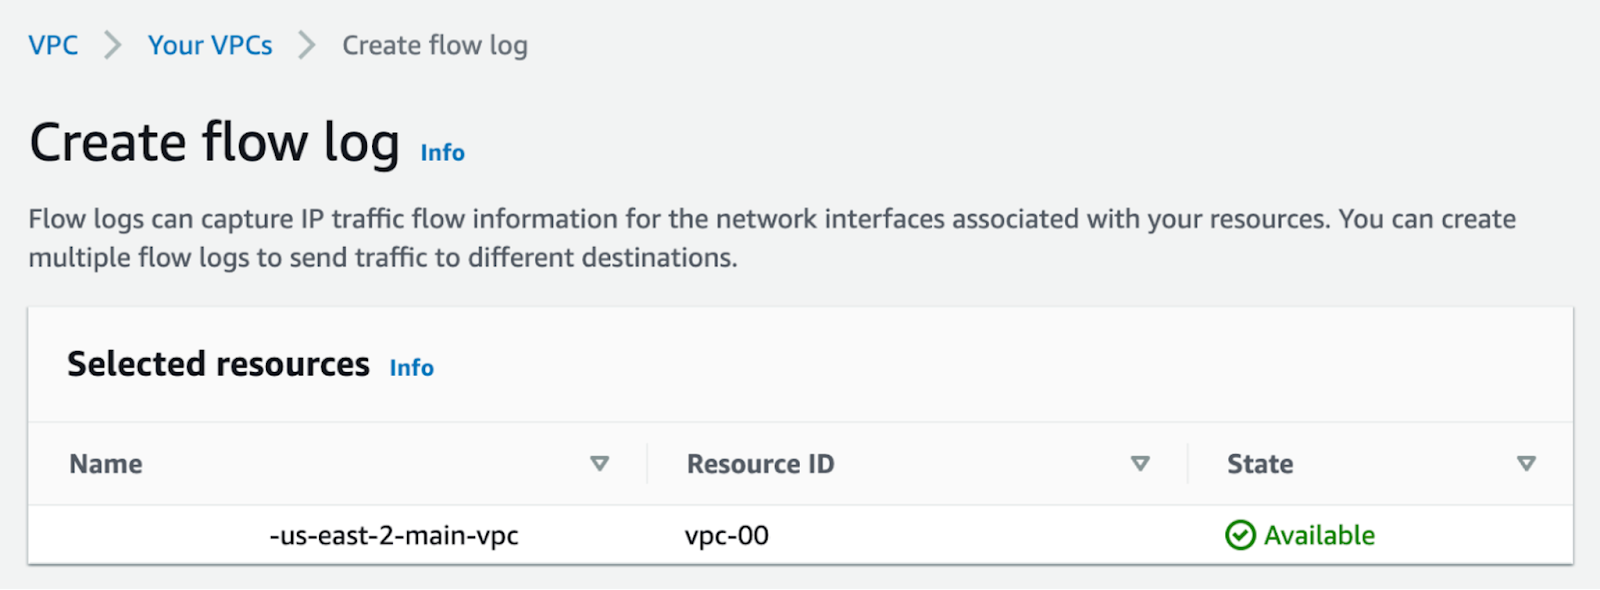
For our use case, we want to gather "All" data and store the data in the S3 bucket we created in Step 1.
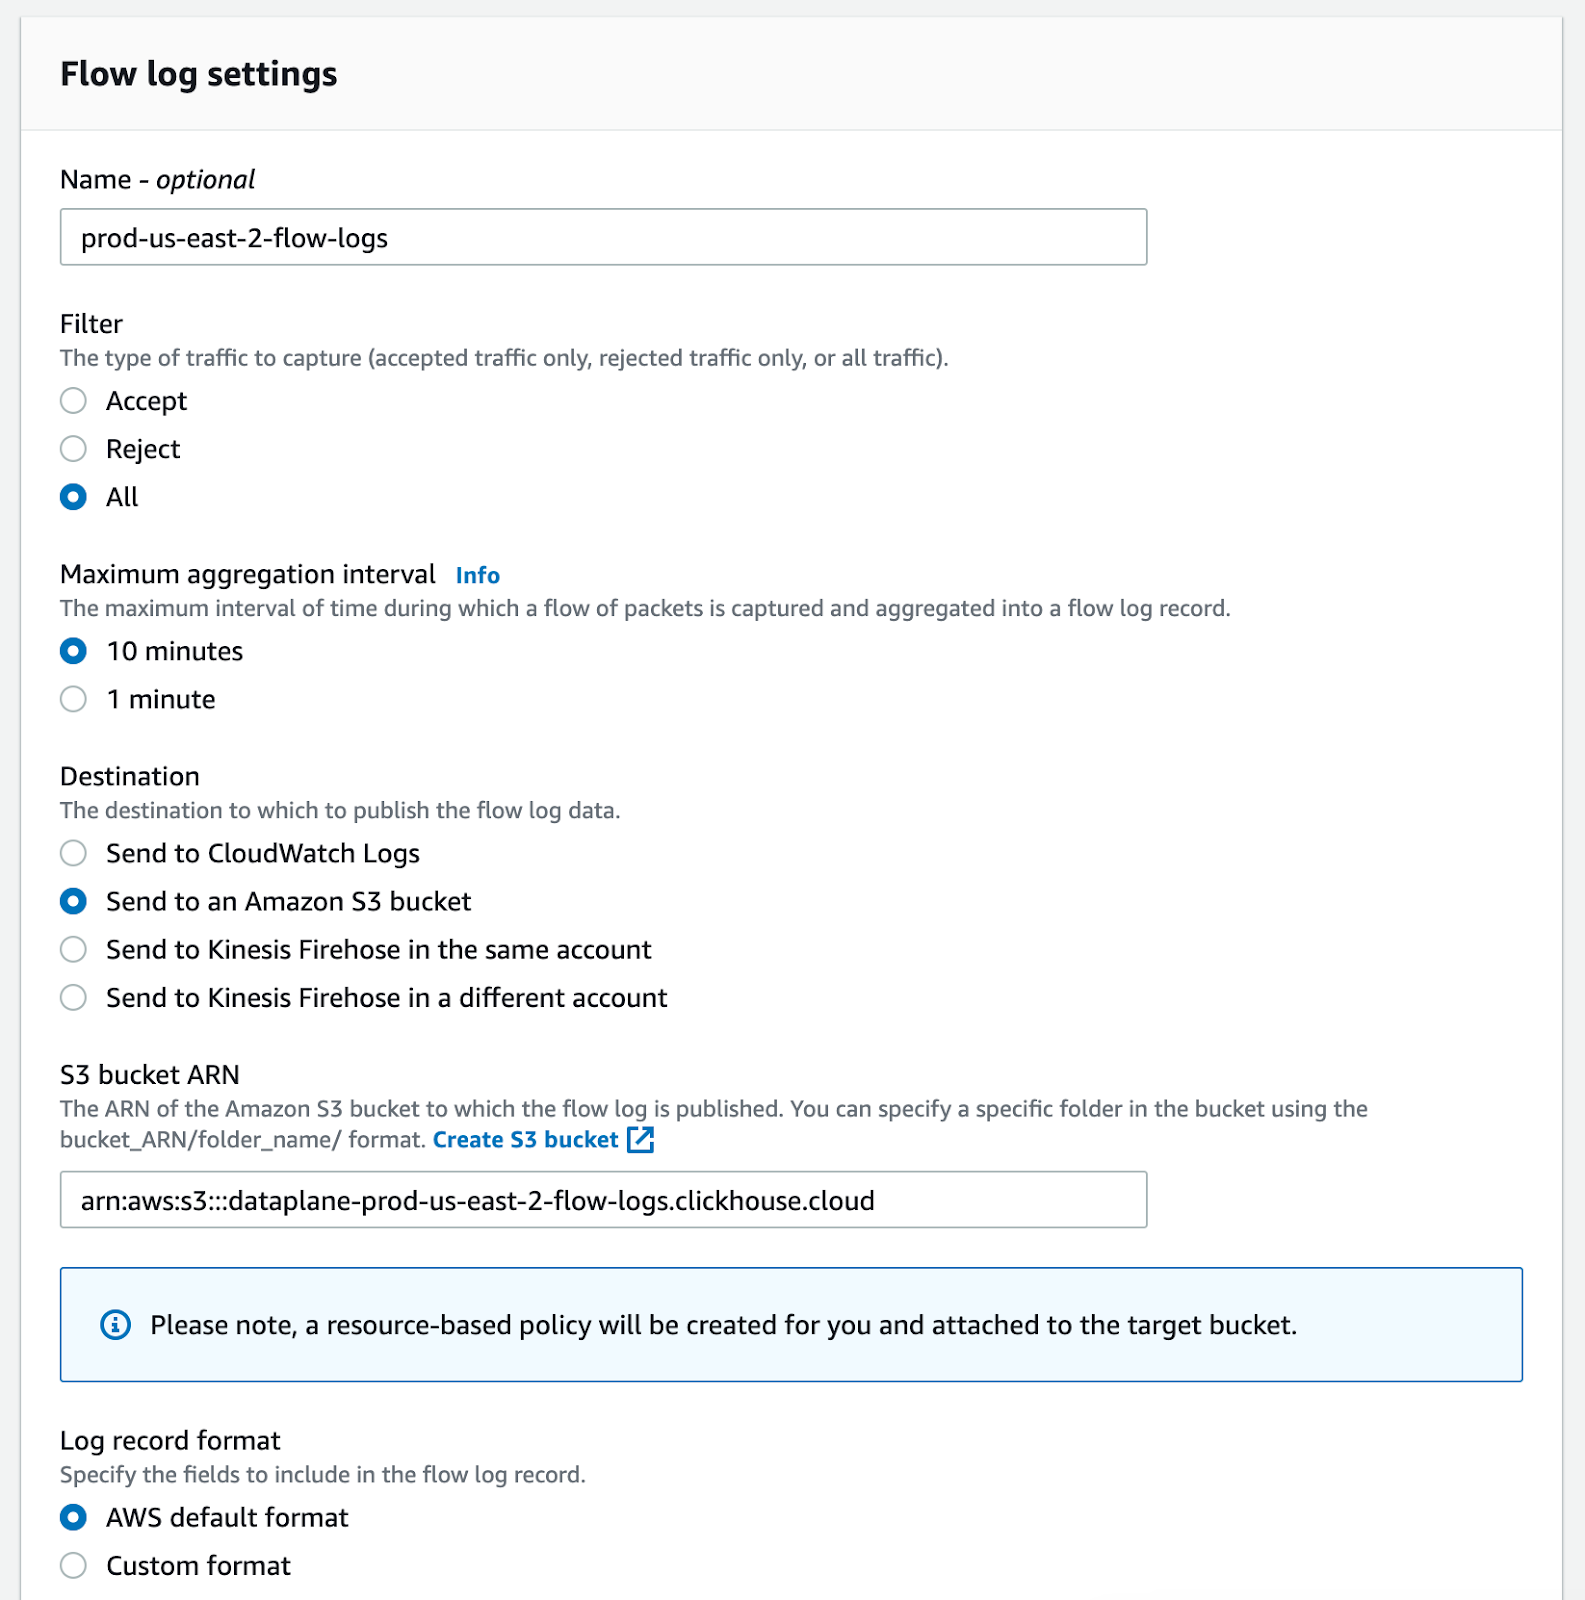
Please choose "Parquet" as Log file format since this makes importing the data a lot easier and improves loading times.
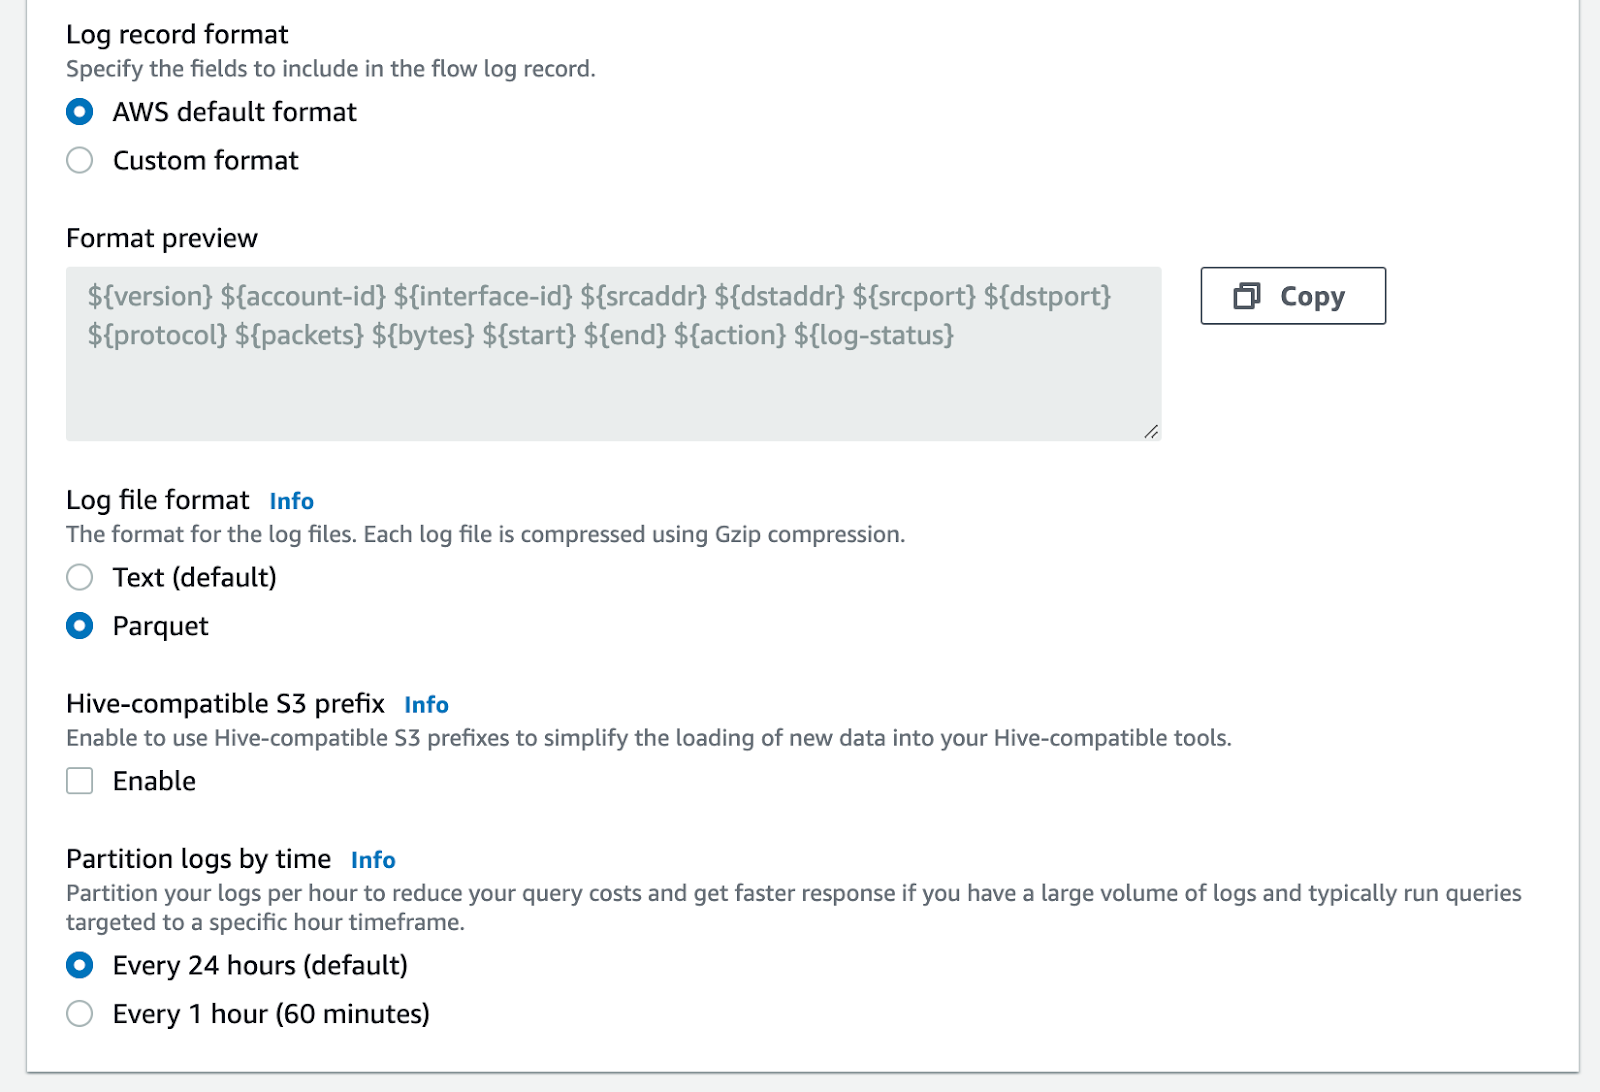
Now we have to wait 24 hours to gather the data. You can check in your S3 bucket that the parquet files are created.
Step 3. Import the data into ClickHouse #
To follow along you have three options for getting up and running with ClickHouse:
- ClickHouse Cloud: The official ClickHouse as a service - built by, maintained and supported by the creators of ClickHouse
- Self-managed ClickHouse: ClickHouse can run on any Linux, FreeBSD, or macOS with x86-64, ARM, or PowerPC64LE CPU architecture
- Docker Image: Read the guide with the official image in Docker Hub
All three options will work for this blog post.
Step 3.1: Define the initial table schema for flow logs #
Before we import data, we should check the data format and create a table schema. ClickHouse can automatically determine the structure of input data in almost all supported Input formats. The following command shows the table schema for one of our parquet files.
> clickhouse local --query "DESCRIBE TABLE file('4XXXXXXXXXXX_vpcflowlogs_us-east-2_fl-0dfd338b697dcd99d_20230124T1540Z_c83147c7.log.parquet')" --format=Pretty

┌─name─────────┬─type─────────────┬
│ version      │ Nullable(Int32)  │
│ account_id   │ Nullable(String) │
│ interface_id │ Nullable(String) │
│ srcaddr      │ Nullable(String) │
│ dstaddr      │ Nullable(String) │
│ srcport      │ Nullable(Int32)  │
│ dstport      │ Nullable(Int32)  │
│ protocol     │ Nullable(Int32)  │
│ packets      │ Nullable(Int64)  │
│ bytes        │ Nullable(Int64)  │
│ start        │ Nullable(Int64)  │
│ end          │ Nullable(Int64)  │
│ action       │ Nullable(String) │
│ log_status   │ Nullable(String) │
└──────────────┴──────────────────┴
Based on the DESCRIBE TABLE output we can create an initial table schema for our Flow Logs.
CREATE TABLE IF NOT EXISTS flowlogs_us_east_2
(
    `version` Int32 NULL,
    `account_id` String NULL,
    `interface_id` String NULL,
    `srcaddr` String NULL,
    `dstaddr` String NULL,
    `srcport` Int32 NULL,
    `dstport` Int32 NULL,
    `protocol` Int32 NULL,
    `packets` Int64 NULL,
    `bytes` Int64 NULL,
    `start` Int64 NULL,
    `end` Int64 NULL,
    `action` String NULL,
    `log_status` String NULL
)
ENGINE = MergeTree
ORDER BY tuple()
Step 3.2: Tune table schema #
Let's improve this table schema, so we get the best query performance. After some tuning we ended up with the following CREATE TABLE statement.
CREATE TABLE default.flowlogs_us_east_2_v4
(
    `version` Nullable(Int32),
    `account_id` LowCardinality(Nullable(String)), # LowCardinality
    `interface_id` LowCardinality(Nullable(String)), # LowCardinality
    `srcaddr` Nullable(IPv4), # IPv4 datatype
    `dstaddr` Nullable(IPv4), # IPv4 datatype
    `srcport` Nullable(Int32),
    `dstport` Nullable(Int32),
    `protocol` Nullable(Int32),
    `packets` Nullable(Int64),
    `bytes` Nullable(Int64),
    `start` Nullable(DateTime('UTC')), # DateTime datatype
    `end` Nullable(DateTime('UTC')), # DateTime datatype
    `action` Enum('ACCEPT', 'REJECT', '-'), # Enumerated type
    `log_status` LowCardinality(Nullable(String)) # LowCardinality
)
ENGINE = MergeTree
ORDER BY (action, srcaddr, dstaddr, protocol, start, end)
SETTINGS allow_nullable_key = 1  # SETTINGS
| Type | Description |
|---|---|
| LowCardinality | The efficiency of using LowCardinality data type depends on data diversity. If a dictionary contains less than 10,000 distinct values, then ClickHouse mostly shows higher efficiency of data reading and storing. If a dictionary contains more than 100,000 distinct values, then ClickHouse can perform worse in comparison with using ordinary data types. |
| IPv4 | IPv4 is a domain based on UInt32 type and serves as a typed replacement for storing IPv4 values. It provides compact storage with a human-friendly input-output format and column-type information on inspection. |
| DateTime | DateTime allows the storage of an instant in time that can be expressed as a calendar date and a time of a day. |
Enum('ACCEPT', 'REJECT', '-') | Enumerated type consisting of named values. ClickHouse stores only numbers but supports operations with the values through their names. |
SETTINGS allow_nullable_key = 1 | This setting allows the use of the Nullable-typed values in a sorting and a primary key for MergeTree tables. |
This query helped find all enumerated values for the action column.
SELECT
    action,
    count()
FROM flowlogs_us_east_2
GROUP BY action

┌─action─┬───count()─┐
│ -      │    794510 │
│ REJECT │   3164999 │
│ ACCEPT │ 510006128 │
└────────┴───────────┘
Step 3.3.1: Import data directly from S3 #
You have different options to import the data to your ClickHouse instance. You can directly import files from S3 using the following command. This is the most convenient way.
INSERT INTO flowlogs_us_east_2
SELECT * FROM s3(
  'https://s3.us-east-2.amazonaws.com//AWSLogs//vpcflowlogs//2023/01/**/*.log.parquet',
  'AWS_ACCESS_KEY',
  'AWS_SECRET_KEY',
  Parquet
)

0 rows in set. Elapsed: 744.802 sec. Processed 517.07 million rows, 32.55 GB (694.24 thousand rows/s., 43.70 MB/s.)
Step 3.3.2: Import data from your local machine #
You can download all parquet files from S3 and then import them to your ClickHouse instance directly using the steps below. This import will take longer since it depends on your internet connection, but if you have the data locally accessible, it is another option you can use.
aws s3 sync s3://<prefix>-us-east-2-flow-logs.clickhouse.cloud .

for f in **/*.log.parquet
do
  echo "Importing $f"
  cat $f | clickhouse client --query "INSERT INTO flowlogs_us_east_2_v4 FORMAT Parquet"  --host <instance>.us-west-2.aws.clickhouse.cloud  --secure  --port 9440  --password <password>
done
Step 3.4: Imported Data Set statistics #
The Flow Log dataset that I am using for this post contains about 500 million rows.
SELECT
    concat(database, '.', table) AS table,
    formatReadableSize(sum(bytes)) AS size,
    sum(rows) AS rows,
    max(modification_time) AS latest_modification,
    sum(bytes) AS bytes_size,
    formatReadableSize(sum(primary_key_bytes_in_memory)) AS primary_keys_size
FROM system.parts
WHERE active AND (table = 'default.flowlogs_us_east_2_v4')
GROUP BY
    database,
    table
ORDER BY bytes_size DESC
┌─table─────────────────────────┬─size─────┬──────rows─┬─latest_modification─┬─bytes_size─┬─primary_keys_size─┐
│ default.flowlogs_us_east_2_v4 │ 2.30 GiB │ 517069187 │ 2023-01-30 13:03:51 │ 2465625288 │ 3.63 MiB          │
└───────────────────────────────┴──────────┴───────────┴─────────────────────┴────────────┴───────────────────┘
The same table statistics can be collected directly from the system tables.
SELECT
    name,
    primary_key,
    total_rows,
    total_bytes
FROM system.tables
WHERE name = 'flowlogs_us_east_2_v4'
┌─name──────────────────┬─primary_key────────────────────────────────────┬─total_rows─┬─total_bytes─┐
│ flowlogs_us_east_2_v4 │ action, srcaddr, dstaddr, protocol, start, end │  517069187 │  2465625288 │
└───────────────────────┴────────────────────────────────────────────────┴────────────┴─────────────┘
Step 4: Analyze Data #
Now that we have the data loaded inside ClickHouse we can analyze it. Here are a couple of example queries you can run to analyze the flow logs.
Step 4.1: Find top IPs that have traffic rejected #
SELECT
    srcaddr,
    dstaddr,
    count(*) AS count
FROM flowlogs_us_east_2_v4
WHERE action = 'REJECT'
GROUP BY
    srcaddr,
    dstaddr
ORDER BY count DESC
LIMIT 10

┌─srcaddr───────┬─dstaddr───────┬─count─┐
│ 52.219.93.41  │ 10.xx.148.26  │  5068 │
│ 10.xx.34.239  │ 10.xx.158.94  │  4575 │
│ 10.xx.34.239  │ 10.xx.18.221  │  4569 │
│ 10.xx.34.239  │ 10.xx.165.205 │  4569 │
│ 10.xx.61.214  │ 10.xx.124.154 │  4567 │
│ 10.xx.34.239  │ 10.xx.57.228  │  4567 │
│ 10.xx.61.214  │ 10.xx.57.150  │  4566 │
│ 10.xx.61.214  │ 10.xx.42.227  │  4565 │
│ 10.xx.134.164 │ 10.xx.42.227  │  4565 │
│ 10.xx.34.239  │ 10.xx.7.57    │  4565 │
└───────────────┴───────────────┴───────┘

10 rows in set. Elapsed: 0.631 sec. Processed 3.22 million rows, 145.81 MB (5.10 million rows/s., 230.90 MB/s.)
Step 4.2: Find top IPs with the most traffic #
SELECT
    srcaddr,
    dstaddr,
    sum(bytes) AS sum_bytes,
    sum(packets) AS sum_packets,
    count(*) AS num_connects
FROM flowlogs_us_east_2_v4
GROUP BY
    srcaddr,
    dstaddr
ORDER BY sum_bytes DESC
LIMIT 10

┌─srcaddr───────┬─dstaddr───────┬────sum_bytes─┬─sum_packets─┬─num_connects─┐
│ 52.219.98.217 │ 10.xx.4.152   │ 408892749105 │   288418578 │        16720 │
│ 52.219.101.9  │ 10.xx.148.26  │ 113090806589 │    79170936 │         2354 │
│ 52.219.92.65  │ 10.xx.129.150 │ 104062457099 │    72194254 │         2787 │
│ 10.xx.151.54  │ 162.xxx.yyy.2 │  90002563685 │    62017417 │         2739 │
│ 10.xx.151.54  │ 10.xx.232.160 │  85990237301 │    60482186 │        37800 │
│ 10.xx.232.160 │ 162.xxx.yyy.2 │  83703023903 │    63673370 │         9048 │
│ 162.xxx.yyy.2 │ 10.xx.143.254 │  76876274499 │    51932321 │         7026 │
│ 162.xxx.yyy.2 │ 10.xx.232.160 │  71774911712 │    58531508 │         9069 │
│ 10.xx.232.160 │ 10.xx.143.254 │  71636349482 │    49617103 │        41563 │
│ 10.xx.72.138  │ 162.xxx.yyy.2 │  68960063436 │    46908157 │         4038 │
└───────────────┴───────────────┴──────────────┴─────────────┴──────────────┘

10 rows in set. Elapsed: 30.346 sec. Processed 517.07 million rows, 32.23 GB (17.04 million rows/s., 1.06 GB/s.)
Step 4.3: Find the top IPs with the most traffic coming from outside the VPC #
WITH IPv4CIDRToRange(toIPv4('10.XX.0.0'), 16) AS mask
SELECT
    srcaddr,
    dstaddr,
    sum(bytes) AS sum_bytes,
    sum(packets) AS sum_packets,
    count(*) AS num_connects
FROM flowlogs_us_east_2_v4
WHERE (srcaddr < (mask.1)) OR (srcaddr > (mask.2))
GROUP BY
    srcaddr,
    dstaddr
ORDER BY sum_bytes DESC
LIMIT 10

┌─srcaddr────────┬─dstaddr───────┬────sum_bytes─┬─sum_packets─┬─num_connects─┐
│ 52.219.98.217  │ 10.XX.4.152   │ 408892749105 │   288418578 │        16720 │
│ 52.219.101.9   │ 10.XX.148.26  │ 113090806589 │    79170936 │         2354 │
│ 52.219.92.65   │ 10.XX.129.150 │ 104062457099 │    72194254 │         2787 │
│ 162.243.189.2  │ 10.XX.143.254 │  76876274499 │    51932321 │         7026 │
│ 162.243.189.2  │ 10.XX.232.160 │  71774911712 │    58531508 │         9069 │
│ 52.219.176.33  │ 10.XX.4.152   │  64240559865 │    44917125 │         2682 │
│ 52.219.109.137 │ 10.XX.129.150 │  39752096707 │    27800978 │          823 │
│ 52.219.98.145  │ 10.XX.123.186 │  39421406790 │    28161428 │         2426 │
│ 52.219.109.153 │ 10.XX.123.186 │  32397795186 │    23754825 │         4861 │
│ 52.219.142.65  │ 10.XX.148.26  │  32010932847 │    22743875 │         3889 │
└────────────────┴───────────────┴──────────────┴─────────────┴──────────────┘

10 rows in set. Elapsed: 4.327 sec. Processed 105.19 million rows, 2.95 GB (24.31 million rows/s., 680.69 MB/s.)
Step 4.4: Find the top IPs with the most traffic going to public IPs #
WITH IPv4CIDRToRange(toIPv4('10.XX.0.0'), 16) AS mask
SELECT
    srcaddr,
    dstaddr,
    sum(bytes) AS sum_bytes,
    sum(packets) AS sum_packets,
    count(*) AS num_connects
FROM flowlogs_us_east_2_v4
WHERE (dstaddr < (mask.1)) OR (dstaddr > (mask.2))
GROUP BY
    srcaddr,
    dstaddr
ORDER BY sum_bytes DESC
LIMIT 10

┌─srcaddr───────┬─dstaddr────────┬───sum_bytes─┬─sum_packets─┬─num_connects─┐
│ 10.XX.151.54  │ 162.243.189.2  │ 90002563685 │    62017417 │         2739 │
│ 10.XX.232.160 │ 162.243.189.2  │ 83703023903 │    63673370 │         9048 │
│ 10.XX.72.138  │ 162.243.189.2  │ 68960063436 │    46908157 │         4038 │
│ 10.XX.212.81  │ 162.243.189.2  │ 61244530980 │    41655380 │         3613 │
│ 10.XX.123.186 │ 52.219.108.201 │ 18577571671 │    13228030 │        13384 │
│ 10.XX.123.186 │ 52.219.94.153  │ 16666940461 │    11551738 │         2477 │
│ 10.XX.151.54  │ 52.219.110.185 │ 14360554536 │    10297054 │         8184 │
│ 10.XX.72.138  │ 52.219.143.81  │ 14306330457 │    10432147 │        18176 │
│ 10.XX.123.186 │ 52.219.99.57   │ 14168694748 │    10038959 │         7574 │
│ 10.XX.123.186 │ 52.219.143.73  │ 14158734985 │     9845027 │         2867 │
└───────────────┴────────────────┴─────────────┴─────────────┴──────────────┘

10 rows in set. Elapsed: 4.361 sec. Processed 160.77 million rows, 3.46 GB (36.87 million rows/s., 792.99 MB/s.)
A web search for the destination IPs starting with `52.219.x.x` reveals that those belong to the AWS S3 service.
Source: https://www.netify.ai/resources/ips/52.219.108.201
Step 5: Enrich Flow Logs #
Coming back to our initial plan to analyze cross availability zone (AZ) traffic, we need to load EC2 metadata that we can use for our analysis. Unfortunately, AWS flow logs do not contain any data about the IPs and in which AZ the EC2 instances are running. Therefore we will retrieve this data from AWS API and store the data inside ClickHouse.
Step 5.1: Get metadata for AWS IP #
One way of getting the availability zones (AZ) for IPs in a VPC is using aws ec2 describe-instances CLI command. All our EC2 instances are tagged, so we know which components are running on them. Here is a simplified example of what our output looks like. By running this command, we are creating a tab-separated values file that can be imported easily into ClickHouse. You can change the Tags to match the names you are using in your environments.
aws ec2 describe-instances --output text --query 'Reservations[*].Instances[*].[InstanceId, Placement.AvailabilityZone, PrivateIpAddress, [Tags[?Key==`Name`].Value] [0][0], [Tags[?Key==`eks:nodegroup-name`].Value] [0][0], [Tags[?Key==`dataplane_component`].Value] [0][0] ]' > us-east2-ec2-metadata.tsv
The output of this command will look like the following.
i-0bda6c63322caa392     us-east-2b      10.xx.89.232    core    ng-us-east-2-core-b-0
i-0b283e306faa2fed3     us-east-2c      10.xx.134.164   core    ng-us-east-2-core-c-0
i-04ac9aea1fd1e04b9     us-east-2a      10.xx.61.214    core    ng-us-east-2-core-a-0
i-0c037e5f3cbf70abe     us-east-2a      10.xx.34.239    core    ng-us-east-2-core-a-0
i-039325803992c97d5     us-east-2a      10.xx.40.15     keeper  ng-us-east-2-keeper-a-0
i-00d0c53e442d6c445     us-east-2a      10.xx.45.139    keeper  ng-us-east-2-keeper-a-0
i-08a520c6a5b0f2ff9     us-east-2a      10.xx.59.108    keeper  ng-us-east-2-keeper-a-0
To import this tab-separated values file we first need to create a table. You can use clickhouse local to get a description of the schema.
> clickhouse local --query "DESCRIBE TABLE file('us-east2-ec2-metadata.tsv')" --format=Pretty

CREATE TABLE us_east_2_ec2metadata
(
    `instanceId` LowCardinality(Nullable(String)),
    `availabilityZone` LowCardinality(Nullable(String)),
    `privateIpAddress` Nullable(IPv4),
    `tagName` LowCardinality(Nullable(String)),
    `tagNodegroupName` LowCardinality(Nullable(String))
)
ENGINE = MergeTree
ORDER BY privateIpAddress
SETTINGS allow_nullable_key = 1
To import this data you can run the following command:
cat us-east2-ec2-metadata.tsv | clickhouse client --query "INSERT INTO us_east_2_ec2metadata FORMAT TSV"
                          --host <instance>.us-west-2.aws.clickhouse.cloud
                          --secure
                          --port 9440
                          --password <password>
From the EC2 metadata, we create a dictionary that will make it easier to enrich our result sets with EC2 tags.
CREATE DICTIONARY us_east_2_ec2_instances_dict
(
    `privateIpAddress` Nullable(String),
    `instanceId` Nullable(String),
    `availabilityZone` Nullable(String),
    `tagName` Nullable(String),
    `tagNodegroupName` Nullable(String)
)
PRIMARY KEY privateIpAddress
SOURCE(CLICKHOUSE(DB 'default' TABLE us_east_2_ec2metadata))
LIFETIME(MIN 1 MAX 10)
LAYOUT(COMPLEX_KEY_HASHED())
Using dictionaries we now have an easy for finding tags for a given IP and enrich our result table.
SELECT dictGet(us_east_2_ec2_instances_dict, 'tagName', '10.xx.0.239')

┌─dictGet(us_east_2_ec2_instances_dict, 'tagName', '10.xx.0.239')─┐
│ core                                                            │
└─────────────────────────────────────────────────────────────────┘

1 rows in set. Elapsed: 0.485 sec.
Step 5.2: Find IPs with the most cross-availability zone traffic #
SELECT
    f.srcaddr,
    dictGetOrNull('us_east_2_ec2_instances_dict', 'tagName', IPv4NumToString(f.srcaddr)) AS tagSrc,
    dictGetOrNull('us_east_2_ec2_instances_dict', 'availabilityZone', IPv4NumToString(f.srcaddr)) AS azSrc,
    f.dstaddr,
    dictGetOrNull('us_east_2_ec2_instances_dict', 'tagName', IPv4NumToString(f.dstaddr)) AS tagDest,
    dictGetOrNull('us_east_2_ec2_instances_dict', 'availabilityZone', IPv4NumToString(f.dstaddr)) AS azDest,
    sum(f.bytes) AS sum_bytes
FROM flowlogs_us_east_2_v4 AS f
INNER JOIN us_east_2_ec2metadata AS i1 ON f.srcaddr = i1.privateIpAddress
INNER JOIN us_east_2_ec2metadata AS i2 ON f.dstaddr = i2.privateIpAddress
WHERE i1.availabilityZone != i2.availabilityZone
GROUP BY
    f.srcaddr,
    f.dstaddr
ORDER BY sum_bytes DESC
LIMIT 10

┌─f.srcaddr─────┬─tagSrc───┬─azSrc──────┬─f.dstaddr─────┬─tagDest─┬─azDest─────┬──sum_bytes─┐
│ 10.xx.171.252 │ core     │ us-east-2c │ 10.xx.0.239   │ core    │ us-east-2a │ 1902671332 │
│ 10.xx.74.154  │ core     │ us-east-2b │ 10.xx.0.239   │ core    │ us-east-2a │  507520688 │
│ 10.xx.172.251 │ core     │ us-east-2c │ 10.xx.0.239   │ core    │ us-east-2a │  224974948 │
│ 10.xx.15.27   │ dev      │ us-east-2a │ 10.xx.153.9   │ server  │ us-east-2c │   43971454 │
│ 10.xx.19.138  │ server   │ us-east-2a │ 10.xx.153.9   │ server  │ us-east-2c │   42983148 │
│ 10.xx.6.209   │ mgmt     │ us-east-2a │ 10.xx.87.223  │ mgmt    │ us-east-2b │   41120344 │
│ 10.xx.122.178 │ server   │ us-east-2b │ 10.xx.153.9   │ server  │ us-east-2c │   40911334 │
│ 10.xx.72.138  │ dev      │ us-east-2b │ 10.xx.153.9   │ server  │ us-east-2c │   37413716 │
│ 10.xx.47.141  │ server   │ us-east-2a │ 10.xx.153.9   │ server  │ us-east-2c │   37273446 │
│ 10.xx.0.239   │ core     │ us-east-2a │ 10.xx.171.252 │ core    │ us-east-2c │   33990090 │
└───────────────┴──────────┴────────────┴───────────────┴─────────┴────────────┴────────────┘
Now that we know which components cause the most cross-availability zone traffic, we can focus on improving reading and writing data for those components.
Summary #
I hope you found some useful information in this post. Now that you have the flow log data loaded in ClickHouse, you have a full set of SQL features at your hands for slicing and dicing your data.
Looking forward to your comments. I am curious about what else you are using flow logs for.
Links #
- AWS Flow Logs, https://docs.aws.amazon.com/vpc/latest/userguide/flow-logs.html
- Blog about AWS cross az data transfer costs, https://www.lastweekinaws.com/blog/aws-cross-az-data-transfer-costs-more-than-aws-says/
- ClickHouse documentation, https://clickhouse.com/docs/en/home


