LangChain has emerged as one of the leading frameworks for building AI applications, making it easier than ever to create complex workflows with large language models. However, as these applications grow in complexity, understanding what's happening under the hood becomes increasingly important for debugging, optimization, and monitoring.
In this guide, we'll explore how to add comprehensive observability to your LangChain applications using OpenLLMetry. We'll walk through building a joke generation pipeline while instrumenting it to collect detailed tracing data, giving you visibility into every step of your AI workflow. Once we have this data flowing, we'll analyze it in ClickStack to gain insights into our application's performance and behavior.
LangChain joke generation pipeline #
Let's create our joke generation pipeline using LangChain. We'll have OpenAI create a joke about a given person and then enhance it in another call to OpenAI.
This is done in LangChain by creating a chain of reusable components:
first_chainwill create the initial joke.second_chainwill take the joke and enhance it.second_chain_templateexpects a dictionary with a content key, butfirst_chainreturns an object with a content attribute, so we need to useRunnableLambdato extract the text content and put it in a dictionary.
1# /// script
2# requires-python = ">=3.9"
3# dependencies = [
4#     "langchain",
5#     "langchain-openai",
6#     "openai"
7# ]
8# ///
9
10import os
11from langchain_core.runnables import RunnableLambda
12from langchain_core.prompts import ChatPromptTemplate
13from langchain_openai import ChatOpenAI
14
15chat = ChatOpenAI(
16    model="gpt-4o",
17    temperature=0.7
18)
19
20first_prompt_template = ChatPromptTemplate.from_template(
21    "You are a funny sarcastic person. Create a joke about {subject}. Make it funny and sarcastic."
22)
23first_chain = (first_prompt_template | chat)
24
25second_prompt_template = ChatPromptTemplate.from_template(
26    "You are a professional comedian. Take this joke and make it edgier and more provocative:\n\n{content}"
27)
28second_chain = (RunnableLambda(lambda x: {"content": x.content}) | second_prompt_template | chat)
29
30
31def generate_joke(subject: str):
32    print(f"🎭 Generating joke about: {subject}")
33    complete_pipeline = (first_chain | second_chain)
34    return complete_pipeline.invoke({"subject": subject})
35
36
37result = generate_joke("Carlos Alcaraz")
38print("Result:")
39print(result.content)
1uv run lc.py
🎭 Generating joke about: Carlos Alcaraz
Result:
Why did Carlos Alcaraz bring a ladder to the tennis match?

Because he heard his ranking was on the rise and figured it was the only way to see Novak Djokovic’s ego from up there!
Tracing LangChain with OpenLLMetry #
Our joke pipeline is working, but as it stands, we have limited visibility into what's happening inside each step. If something goes wrong — maybe the initial joke generation fails or the enhancement step produces unexpected results — we'd have trouble diagnosing the issue. We need observability!
This is where OpenLLMetry comes in. OpenLLMetry is a set of extensions built on top of OpenTelemetry that provides comprehensive observability for LLM applications. It includes dedicated instrumentation for popular AI frameworks like LangChain, making it perfect for tracing our pipeline.
With OpenLLMetry, we'll be able to capture detailed information about each step: the prompts sent to the model, the responses received, timing data, and any errors that occur. This tracing data will help us understand our pipeline's behavior and quickly identify issues when they arise.
Let's update our script:
1# /// script
2# requires-python = ">=3.9"
3# dependencies = [
4#     "traceloop-sdk",
5#     "langchain",
6#     "langchain-openai",
7#     "opentelemetry-instrumentation-langchain",
8#     "openai"
9# ]
10# ///
11
12import os
13from langchain_core.runnables import RunnableLambda
14from langchain_core.prompts import ChatPromptTemplate
15from langchain_openai import ChatOpenAI
16from opentelemetry.sdk.trace.export import ConsoleSpanExporter, SimpleSpanProcessor
17from opentelemetry.sdk import trace as trace_sdk
18from opentelemetry.sdk.resources import Resource
19from opentelemetry.instrumentation.langchain import LangchainInstrumentor
20from opentelemetry import trace
21
22resource = Resource.create({
23    "service.name": "joke-generation-pipeline",
24})
25
26tracer_provider = trace_sdk.TracerProvider(resource=resource)
27tracer_provider.add_span_processor(SimpleSpanProcessor(ConsoleSpanExporter()))
28
29LangchainInstrumentor().instrument(tracer_provider=tracer_provider)
30
31chat = ChatOpenAI(
32    model="gpt-4o",
33    temperature=0.7,
34    metadata={"component": "openai_gpt4o", "purpose": "llm_joke_generation"}
35)
36
37first_prompt_template = ChatPromptTemplate.from_template(
38    "You are a funny sarcastic person. Create a joke about {subject}. Make it funny and sarcastic."
39)
40first_chain = (first_prompt_template | chat).with_config({
41    "metadata":{"purpose": "initial_joke"}}
42)
43
44second_prompt_template = ChatPromptTemplate.from_template(
45    "You are a professional comedian. Take this joke and make it edgier, funnier, and more provocative:\n\n{content}"
46)
47second_chain = (RunnableLambda(lambda x: {"content": x.content}) | second_prompt_template | chat).with_config({
48    "metadata":{"purpose": "enhanced_joke"}}
49)
50
51
52def generate_joke(subject: str):
53    print(f"🎭 Generating joke about: {subject}")
54    complete_pipeline = (first_chain | second_chain)
55    return complete_pipeline.invoke({"subject": subject})
56
57
58result = generate_joke("Carlos Alcaraz")
59print("Result:")
60print(result.content)
The main library is traceloop-sdk with the LangChain integration in opentelemetry-instrumentation-langchain.
We've added the following bits of code:
Resource.creategives our spans a service name so that we can identify them later on.ConsoleSpanExporterlogs all generate spans to the terminal.LangchainInstrumentor().instrumentautomatically instruments our LangChain application.
We've also added metadata to the OpenAI client as well as first_chain and second_chain so that we can identify them more easily later on.
Before printing out the joke, the script will now print out all the OpenTelemetry spans, as you can see below (one span shown for brevity)
{
    "name": "ChatPromptTemplate.task",
    "context": {
        "trace_id": "0x6f7dc698ad87c0e7280695f9f4254d17",
        "span_id": "0x70064dafdb021a02",
        "trace_state": "[]"
    },
    "kind": "SpanKind.INTERNAL",
    "parent_id": "0x710295f97af8cc37",
    "start_time": "2025-08-28T14:17:03.468854Z",
    "end_time": "2025-08-28T14:17:03.469595Z",
    "status": {
        "status_code": "UNSET"
    },
    "attributes": {
        "traceloop.workflow.name": "RunnableSequence",
        "traceloop.association.properties.purpose": "initial_joke",
        "traceloop.span.kind": "task",
        "traceloop.entity.name": "ChatPromptTemplate",
        "traceloop.entity.input": "{\"inputs\": {\"subject\": \"Carlos Alcaraz\"}, \"tags\": [\"seq:step:1\"], \"metadata\": {\"purpose\": \"initial_joke\"}, \"kwargs\": {\"run_type\": \"prompt\", \"name\": \"ChatPromptTemplate\"}}",
        "traceloop.entity.output": "{\"outputs\": {\"lc\": 1, \"type\": \"constructor\", \"id\": [\"langchain\", \"prompts\", \"chat\", \"ChatPromptValue\"], \"kwargs\": {\"messages\": [{\"lc\": 1, \"type\": \"constructor\", \"id\": [\"langchain\", \"schema\", \"messages\", \"HumanMessage\"], \"kwargs\": {\"content\": \"You are a funny sarcastic person. Create a joke about Carlos Alcaraz. Make it funny and sarcastic.\", \"type\": \"human\"}}]}}, \"kwargs\": {\"tags\": [\"seq:step:1\"]}}"
    },
    "events": [],
    "links": [],
    "resource": {
        "attributes": {
            "telemetry.sdk.language": "python",
            "telemetry.sdk.name": "opentelemetry",
            "telemetry.sdk.version": "1.36.0",
            "service.name": "joke-generation-pipeline"
        },
        "schema_url": ""
    }
}
...
Exporting OpenTelemetry data to ClickStack #
Printing spans to the console gives us a quick glimpse into our tracing data, but for any serious analysis, we need to export this data to a proper observability platform.
Enter ClickStack, a production-grade observability platform built on ClickHouse, unifying logs, traces, metrics and session in a single high-performance solution.
ClickStack consists of three core components:
- OpenTelemetry collector – a custom-built, pre-configured collector with an opinionated schema for logs, traces, and metrics
- HyperDX UI – a purpose-built frontend for exploring and visualizing observability data
- ClickHouse – the high-performance analytical database at the heart of the stack
The simplest way to get started with ClickStack is by running the single-image distribution that bundles all the components together:
1docker run -p 8080:8080 -p 4317:4317 -p 4318:4318 \
2docker.hyperdx.io/hyperdx/hyperdx-all-in-one
Send OpenTelemetry data via:
  http/protobuf: OTEL_EXPORTER_OTLP_ENDPOINT=http://localhost:4318
  gRPC: OTEL_EXPORTER_OTLP_ENDPOINT=http://localhost:4317

Exporting data to ClickHouse:
  Endpoint: tcp://ch-server:9000?dial_timeout=10s
  Database: default

Waiting for ClickHouse to be ready...
ClickHouse is ready!

Visit the HyperDX UI at http://localhost:8080
This exposes the HyperDX UI on port 8080, with OpenTelemetry endpoints available on ports 4317 (gRPC) and 4318 (HTTP) for sending your tracing data. We'll be using port 4318 for sending our tracing data.
Let's update our script:
1# /// script
2# requires-python = ">=3.9"
3# dependencies = [
4#     "traceloop-sdk",
5#     "langchain",
6#     "langchain-openai",
7#     "opentelemetry-instrumentation-langchain",
8#     "openai"
9# ]
10# ///
11
12import os
13from langchain_core.runnables import RunnableLambda
14from langchain_core.prompts import ChatPromptTemplate
15from langchain_openai import ChatOpenAI
16from opentelemetry.sdk.trace.export import ConsoleSpanExporter, SimpleSpanProcessor
17from opentelemetry.exporter.otlp.proto.http.trace_exporter import OTLPSpanExporter
18from opentelemetry.sdk import trace as trace_sdk
19from opentelemetry.sdk.resources import Resource
20from opentelemetry.instrumentation.langchain import LangchainInstrumentor
21from opentelemetry import trace
22
23resource = Resource.create({
24    "service.name": "joke-generation-pipeline",
25})
26
27tracer_provider = trace_sdk.TracerProvider(resource=resource)
28tracer_provider.add_span_processor(SimpleSpanProcessor(ConsoleSpanExporter()))
29
30otlp_exporter = OTLPSpanExporter(
31    endpoint="http://localhost:4318/v1/traces",
32    headers={
33        "authorization": os.getenv("HYPERDX_API_KEY", "your_api_key_here")
34    }
35)
36
37tracer_provider.add_span_processor(SimpleSpanProcessor(otlp_exporter))
38
39trace.set_tracer_provider(tracer_provider)
40LangchainInstrumentor().instrument(tracer_provider=tracer_provider)
41
42chat = ChatOpenAI(
43    model="gpt-4o",
44    temperature=0.7,
45    metadata={"component": "openai_gpt4o", "purpose": "llm_joke_generation"}
46)
47
48first_prompt_template = ChatPromptTemplate.from_template(
49    "You are a funny sarcastic person. Create a joke about {subject}. Make it funny and sarcastic."
50)
51first_chain = (first_prompt_template | chat).with_config({
52    "metadata":{"purpose": "initial_joke"}}
53)
54
55second_prompt_template = ChatPromptTemplate.from_template(
56    "You are a professional comedian. Take this joke and make it edgier, funnier, and more provocative:\n\n{content}"
57)
58second_chain = (RunnableLambda(lambda x: {"content": x.content}) | second_prompt_template | chat).with_config({
59    "metadata":{"purpose": "enhanced_joke"}}
60)
61
62
63def generate_joke(subject: str):
64    print(f"🎭 Generating joke about: {subject}")
65    complete_pipeline = (first_chain | second_chain)
66    return complete_pipeline.invoke({"subject": subject})
67
68
69result = generate_joke("Carlos Alcaraz")
70print("Result:")
71print(result.content)
We've added an OTLPSpanExporter, which will export the spans to our OpenTelemetry collector.
We had to pass in our HyperDX key, which we can get by navigating to http://localhost:8080/team and copying the Ingestion API Key.
1export HYPERDX_API_KEY="xxx"
Analyzing OpenTelemetry data in ClickStack #
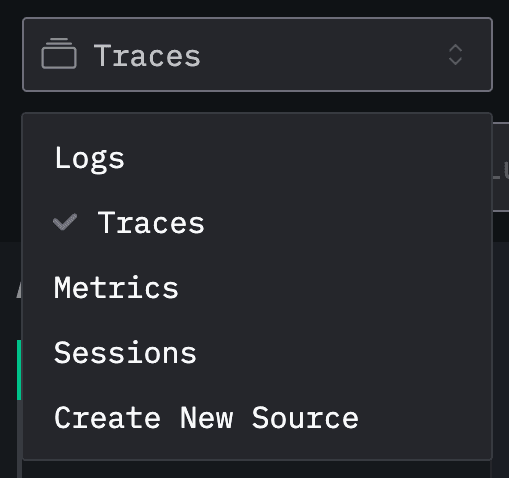
We can run our script again and then go back to the HyperDX home page at http://localhost:8080 and select Traces from the dropdown:

We'll see new events coming in after each invocation of the above script:

Each row represents a different span in our application, showing key details like timestamps, service names, status codes, and execution duration. You can see our joke generation pipeline broken down into its individual components—from the initial joke creation to the enhancement step.
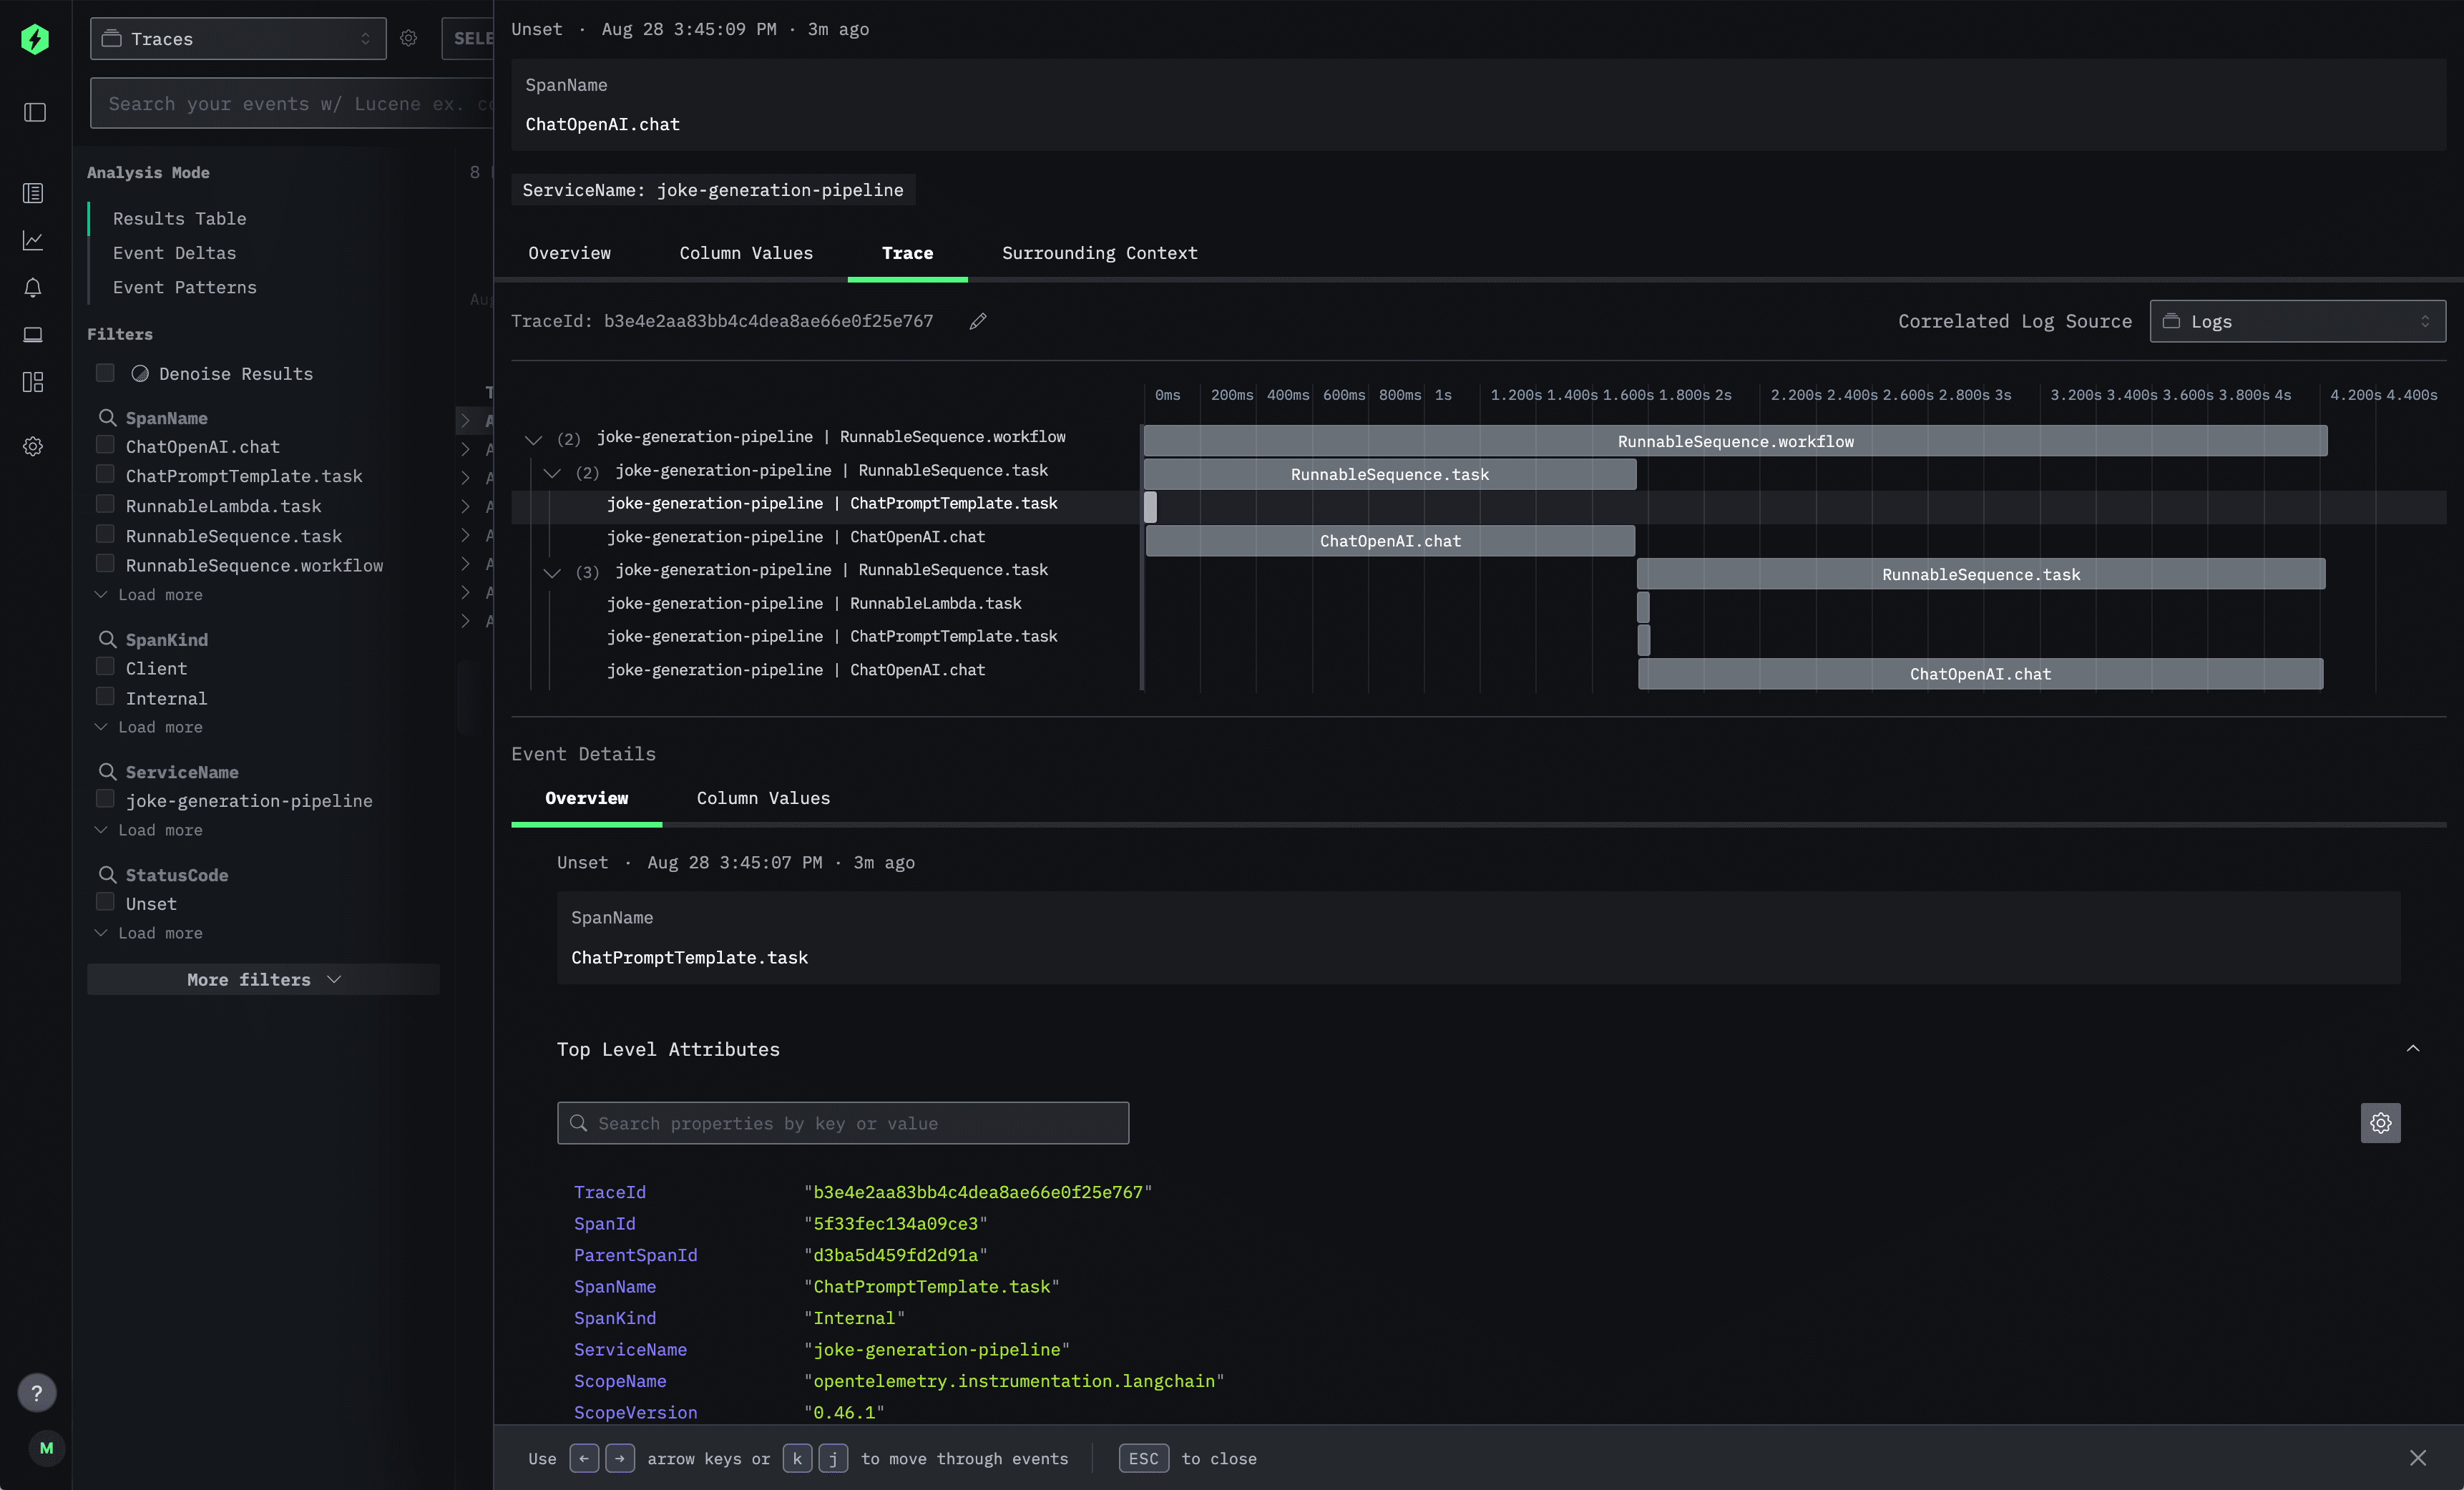
But the real power comes when you drill down into individual traces. Clicking on any span opens up the detailed trace view:

This trace visualization shows the complete execution flow of a single joke generation request. The timeline view on the right displays how the different LangChain components executed in sequence, while the left panel provides detailed metadata for each span. You can see the exact prompts sent to the language model, the responses received, timing information, and any custom attributes you've added.
The Event Details section at the bottom gives you access to all the raw telemetry data, including trace IDs, span relationships, and service information—everything you need to debug issues or optimize performance.
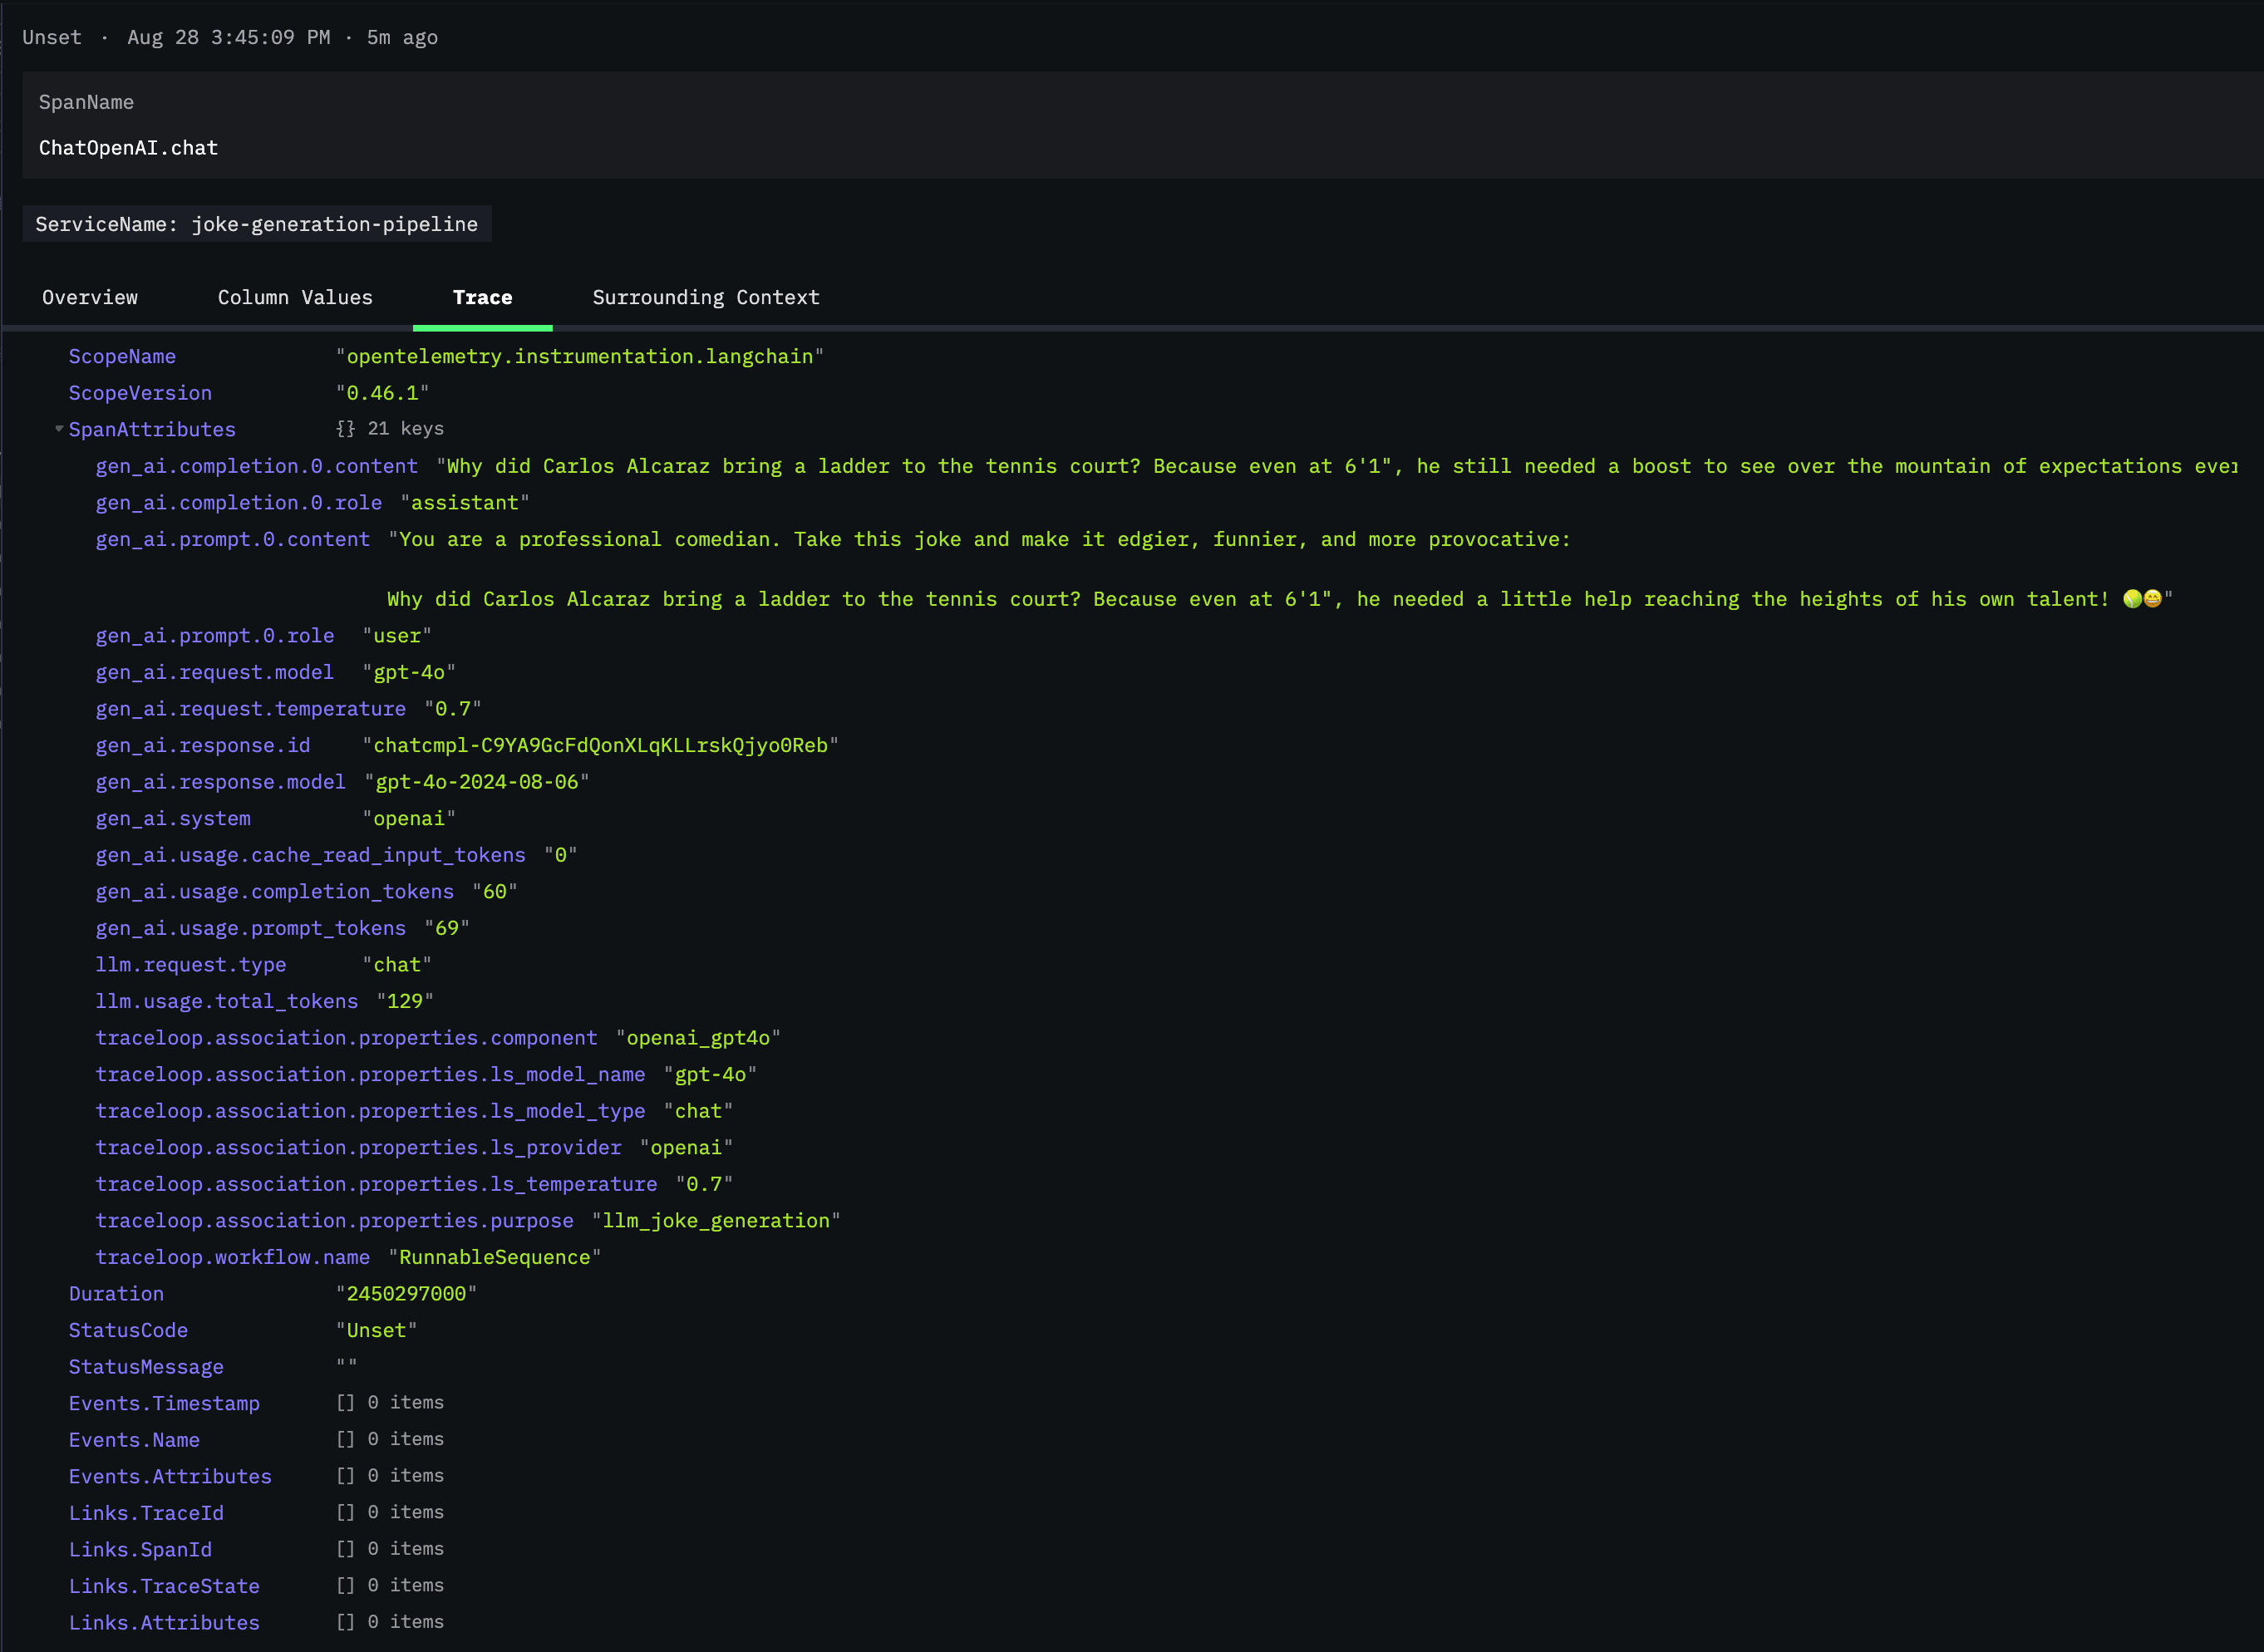
If we click on one of the ChatOpenAI.chat spans and scroll down to SpanAttributes, we'll see the rich telemetry data that OpenLLMetry automatically captures:

This view reveals the true power of OpenLLMetry's instrumentation. You can see the complete LLM interaction captured in detail: the exact prompt sent (gen_ai.prompt.0.content), the model's response (gen_ai.completion.0.content), token usage statistics, model parameters like temperature, and even the specific model version used (gpt-4o-2024-08-06).
Under traceloop.association.properties, we can see additional metadata that helps categorize and organize our traces. The llm_request.type is marked as "chat" and the purpose is identified as llm_joke_generation - making it easy to filter and analyze specific types of requests across your application.
This level of detail is invaluable for debugging. If a joke comes out poorly, you can see exactly what prompt was used, what parameters were set, and how many tokens were consumed. You can track cost implications through token usage and identify patterns in model behavior across different requests.
If we close that span and go back to the main page, we can then update the SELECT query to include the purpose of the span:
Timestamp,ServiceName,StatusCode,round(Duration/1e6),SpanName,SpanAttributes['traceloop.association.properties.purpose']

This query demonstrates one of ClickStack's key strengths: the ability to slice and dice your observability data using familiar SQL syntax. Notice how we can extract nested attributes like traceloop.association.properties.purpose directly from the span data, making it easy to categorize and filter operations.
The results clearly show the two distinct purposes in our pipeline: llm_joke_generation for the initial joke creation and enhanced_joke for the improvement step. With this kind of structured querying, you can quickly identify patterns, measure performance across different operation types, or troubleshoot specific parts of your LangChain workflow.
This SQL-based approach to trace analysis is particularly powerful for teams already familiar with database queries, allowing you to apply existing analytical skills to your observability data without learning new query languages or interfaces.
Conclusion #
With OpenLLMetry and ClickStack in place, you now have comprehensive visibility into your LangChain applications. You can see exactly how your prompts are performing, identify bottlenecks in your pipeline, and quickly diagnose issues when they arise.
The joke generation example we built here is just the beginning—these same tracing principles apply to any LangChain workflow, whether you're building RAG systems, multi-agent applications, or complex reasoning chains. As your AI applications grow in complexity, having this observability foundation will prove invaluable for maintaining performance and reliability.