If you've been building anything with OpenAI's APIs lately, you've probably run into some familiar headaches. Maybe you're wondering why your API bill was higher than expected this month, or trying to figure out which model actually works best for your specific use case. Or perhaps you're just crossing your fingers that your token usage stays reasonable as your app scales up. Here are some questions that probably sound familiar:
- How much am I actually spending on different OpenAI models?
- Which models are performing best for my use cases?
- Are my API calls taking longer than expected?
- How can I track token usage across different parts of my application?
If you've tried to answer these questions, you know it's trickier than it should be. You end up manually checking OpenAI's dashboard, trying to match up timestamps with your app's behavior, or just hoping for the best.
This is where LLM observability comes in. LLM observability is similar to regular application monitoring, but it focuses on the things that matter when using language models, like token usage, model performance, prompt effectiveness, and cost breakdowns across different models.
In this guide, we'll learn how to capture telemetry data for OpenAI API calls using OpenTelemetry. We'll start by logging that data to the terminal, before introducing the ClickStack, which lets us store and analyze the data.
It's actually pretty straightforward to get running, and once you have it, you'll wonder how you ever managed without it. By the end, you'll have dashboards that show you exactly what's happening with your OpenAI usage in real-time — no more guessing games about performance or costs.
Calling the OpenAI client #
We start with the following code that has OpenAI's gpt-3.5-turbo model write a Haiku for us, and print it to the screen.
We'll put that code in a file called haiku.py:
1# /// script
2# requires-python = ">=3.9"
3# dependencies = [
4#     "openai",
5# ]
6# ///
7
8import openai
9
10if __name__ == "__main__":
11    client = openai.OpenAI()
12    response = client.chat.completions.create(
13        model="gpt-3.5-turbo",
14        messages=[{"role": "user", "content": "Write a haiku about playing tennis."}],
15        stream=True,
16        stream_options={"include_usage": True},
17    )
18    for chunk in response:
19        if chunk.choices and (content := chunk.choices[0].delta.content):
20            print(content, end="")
We're going to run the script using uv, so make sure you have that downloaded to your machine.
We'll also need to define our OPENAI_API_KEY environment variable:
1export OPENAI_API_KEY="sk-proj-xxx"
Now, we can run the script:
1uv run haiku.py
It will output something like the following:
Yellow ball soars high,
Racquet swings with precision,
Victory is mine.
Now, let's say we're running this script regularly and we want to collect telemetry data about the OpenAI calls we're making. Perhaps we want to explore token usage, response time, and how this varies when using different models.
What is OpenTelemetry? #
OpenTelemetry is an open-source framework designed to standardize the way telemetry data — metrics, logs, and traces—is collected, processed, and exported in modern software systems. Like physical engineering standards have revolutionized mass production and global supply chains, OpenTelemetry aims to standardize how we gather and analyze data about our software systems.
It has integrations for instrumenting lots of different libraries and frameworks, including OpenAI. This means we can instrument our OpenAI client with OpenTelemetry and collect telemetry data about our LLM calls.
Instrumenting OpenAI with OpenTelemetry #
The OpenTelemetry Registry contains a list of all the instrumentation libraries, collector components, utilities, and other useful projects in the OpenTelemetry ecosystem There are two libraries in that list that we can use to instrument the OpenAI Python library with OpenTelemetry:
Either of these libraries will instrument the OpenAI client with OpenTelemetry and collect telemetry data about our LLM calls.
We're going to use openinference-instrumentation-openai for the rest of this article.
The script below instruments the OpenAI client with OpenTelemetry and prints the telemetry data to the console.
1# /// script
2# requires-python = ">=3.9"
3# dependencies = [
4#     "openai",
5#     "openinference-instrumentation-openai",
6# ]
7# ///
8
9import openai
10
11from openinference.instrumentation.openai import OpenAIInstrumentor
12from opentelemetry.sdk import trace as trace_sdk
13from opentelemetry.sdk.trace.export import ConsoleSpanExporter, SimpleSpanProcessor
14
15tracer_provider = trace_sdk.TracerProvider()
16tracer_provider.add_span_processor(SimpleSpanProcessor(ConsoleSpanExporter()))
17
18OpenAIInstrumentor().instrument(tracer_provider=tracer_provider)
19
20if __name__ == "__main__":
21    client = openai.OpenAI()
22    response = client.chat.completions.create(
23        model="gpt-3.5-turbo",
24        messages=[{"role": "user", "content": "Write a haiku about playing tennis."}],
25        stream=True,
26        stream_options={"include_usage": True},
27    )
28    for chunk in response:
29        if chunk.choices and (content := chunk.choices[0].delta.content):
30            print(content, end="")
If we re-run our script, we'll see the following output:
Racquet strikes the ball
Sweat glistens in the sunlight
Victory is sweet

{
    "name": "ChatCompletion",
    "context": {
        "trace_id": "0x979c96ac84bf2aab1c39dc676d68315e",
        "span_id": "0xa608b12d577b4fa5",
        "trace_state": "[]"
    },
    "kind": "SpanKind.INTERNAL",
    "parent_id": null,
    "start_time": "2025-07-31T14:04:19.747668Z",
    "end_time": "2025-07-31T14:04:20.823797Z",
    "status": {
        "status_code": "OK"
    },
    "attributes": {
        "llm.provider": "openai",
        "llm.system": "openai",
        "input.value": "{\"messages\": [{\"role\": \"user\", \"content\": \"Write a haiku about playing tennis.\"}], \"model\": \"gpt-3.5-turbo\", \"stream\": true, \"stream_options\": {\"include_usage\": true}}",
        "input.mime_type": "application/json",
        "output.value": "{\"choices\": [{\"message\": {\"content\": \"Racquet strikes the ball\\nSweat glistens in the sunlight\\nVictory is sweet\", \"role\": \"assistant\"}, \"index\": 0, \"finish_reason\": \"stop\"}], \"id\": \"chatcmpl-BzOBIOTbI1XIkDNmD38TViPXjzrd6\", \"created\": 1753970660, \"model\": \"gpt-3.5-turbo-0125\", \"object\": \"chat.completion.chunk\", \"service_tier\": \"default\", \"usage\": {\"completion_tokens\": 21, \"prompt_tokens\": 15, \"total_tokens\": 36, \"completion_tokens_details\": {\"accepted_prediction_tokens\": 0, \"audio_tokens\": 0, \"reasoning_tokens\": 0, \"rejected_prediction_tokens\": 0}, \"prompt_tokens_details\": {\"audio_tokens\": 0, \"cached_tokens\": 0}}}",
        "output.mime_type": "application/json",
        "llm.invocation_parameters": "{\"model\": \"gpt-3.5-turbo\", \"stream\": true, \"stream_options\": {\"include_usage\": true}}",
        "llm.input_messages.0.message.role": "user",
        "llm.input_messages.0.message.content": "Write a haiku about playing tennis.",
        "llm.model_name": "gpt-3.5-turbo-0125",
        "llm.token_count.total": 36,
        "llm.token_count.prompt": 15,
        "llm.token_count.completion": 21,
        "llm.token_count.prompt_details.cache_read": 0,
        "llm.token_count.prompt_details.audio": 0,
        "llm.token_count.completion_details.reasoning": 0,
        "llm.token_count.completion_details.audio": 0,
        "llm.output_messages.0.message.role": "assistant",
        "llm.output_messages.0.message.content": "Racquet strikes the ball\nSweat glistens in the sunlight\nVictory is sweet",
        "openinference.span.kind": "LLM"
    },
    "events": [
        {
            "name": "First Token Stream Event",
            "timestamp": "2025-07-31T14:04:20.706471Z",
            "attributes": {}
        }
    ],
    "links": [],
    "resource": {
        "attributes": {
            "telemetry.sdk.language": "python",
            "telemetry.sdk.name": "opentelemetry",
            "telemetry.sdk.version": "1.36.0",
            "service.name": "unknown_service"
        },
        "schema_url": ""
    }
}
THe Haiku is still printed, but we also have a span printed to the console as well. There is a lot of useful information there, including the model name, token count, and response time.
Exporting OpenTelemetry data #
So we've collected the data, but what do we do with it now? We need to export it somewhere so that we can analyze it more easily.
Let's update our script to add the code to export the data to an OpenTelemetry collector.
1# /// script
2# requires-python = ">=3.9"
3# dependencies = [
4#     "openai",
5#     "opentelemetry-sdk",
6#     "openinference-instrumentation-openai",
7#     "opentelemetry-exporter-otlp",
8# ]
9# ///
10
11import openai
12
13from openinference.instrumentation.openai import OpenAIInstrumentor
14from opentelemetry.sdk import trace as trace_sdk
15from opentelemetry.sdk.trace.export import ConsoleSpanExporter, SimpleSpanProcessor
16from opentelemetry.exporter.otlp.proto.http.trace_exporter import OTLPSpanExporter
17
18tracer_provider = trace_sdk.TracerProvider()
19
20otlp_exporter = OTLPSpanExporter(
21    endpoint="http://[otel-collector]/v1/traces"
22)
23
24tracer_provider.add_span_processor(SimpleSpanProcessor(otlp_exporter))
25tracer_provider.add_span_processor(SimpleSpanProcessor(ConsoleSpanExporter()))
26
27OpenAIInstrumentor().instrument(tracer_provider=tracer_provider)
28
29if __name__ == "__main__":
30    client = openai.OpenAI()
31    response = client.chat.completions.create(
32        model="gpt-3.5-turbo",
33        messages=[{"role": "user", "content": "Write a haiku about playing tennis."}],
34        stream=True,
35        stream_options={"include_usage": True},
36    )
37    for chunk in response:
38        if chunk.choices and (content := chunk.choices[0].delta.content):
39            print(content, end="")
We've only had to add a couple of lines to have the data exported to an OpenTelemetry collector:
otlp_exporter = OTLPSpanExporter(
    endpoint="http://[otel-collector]/v1/traces"
)

tracer_provider.add_span_processor(SimpleSpanProcessor(otlp_exporter))
We need to replace [otel-collector] with the address of our OpenTelemetry collector.
The data will then be sent to the collector and exported to our chosen backend data store.
What is ClickStack? #
ClickStack is a production-grade observability platform built on ClickHouse, unifying logs, traces, metrics and session in a single high-performance solution. Designed for monitoring and debugging complex systems, ClickStack enables developers and SREs to trace issues end-to-end without switching between tools or manually stitching together data using timestamps or correlation IDs.
ClickStack consists of three core components:
- OpenTelemetry collector – a custom-built, pre-configured collector with an opinionated schema for logs, traces, and metrics
- HyperDX UI – a purpose-built frontend for exploring and visualizing observability data
- ClickHouse – the high-performance analytical database at the heart of the stack
The simplest way to get started with ClickStack is by running the single-image distribution that includes all core components of the stack bundled together. We can run it using the following command:
1docker run -p 8080:8080 -p 4317:4317 -p 4318:4318 \
2docker.hyperdx.io/hyperdx/hyperdx-all-in-one
Send OpenTelemetry data via:
  http/protobuf: OTEL_EXPORTER_OTLP_ENDPOINT=http://localhost:4318
  gRPC: OTEL_EXPORTER_OTLP_ENDPOINT=http://localhost:4317

Exporting data to ClickHouse:
  Endpoint: tcp://ch-server:9000?dial_timeout=10s
  Database: default

Waiting for ClickHouse to be ready...
ClickHouse is ready!

Visit the HyperDX UI at http://localhost:8080
We now have an OpenTelemetry collector running on ports 4317 and 4318. Port 4318 supports sending data by HTTP, so that's the one we'll be using.
Exporting OpenTelemetry data to ClickStack #
Let's update our script to set our endpoint to http://localhost:4318/v1/traces.
We'll also need to pass in our HyperDX API key, which we'll make available to the script through the HYPERDX_API_KEY environment variable.
1# /// script
2# requires-python = ">=3.9"
3# dependencies = [
4#     "openai",
5#     "opentelemetry-sdk",
6#     "openinference-instrumentation-openai",
7#     "opentelemetry-exporter-otlp",
8# ]
9# ///
10
11import openai
12import os
13import random
14
15from openinference.instrumentation.openai import OpenAIInstrumentor
16from opentelemetry.sdk import trace as trace_sdk
17from opentelemetry.sdk.trace.export import ConsoleSpanExporter, SimpleSpanProcessor
18from opentelemetry.exporter.otlp.proto.http.trace_exporter import OTLPSpanExporter
19
20tracer_provider = trace_sdk.TracerProvider()
21otlp_exporter = OTLPSpanExporter(
22    endpoint="http://localhost:4318/v1/traces",
23    headers={
24        "authorization": os.getenv("HYPERDX_API_KEY", "your_api_key_here")
25    }
26)
27
28tracer_provider.add_span_processor(SimpleSpanProcessor(otlp_exporter))
29tracer_provider.add_span_processor(SimpleSpanProcessor(ConsoleSpanExporter()))
30
31OpenAIInstrumentor().instrument(tracer_provider=tracer_provider)
32
33if __name__ == "__main__":
34    client = openai.OpenAI()
35    model_names = ["gpt-3.5-turbo", "gpt-4o-mini", "gpt-4o", "o3", "o3-mini", "o1"]
36    model_name = random.choice(model_names)
37    response = client.chat.completions.create(
38        model=model_name,
39        messages=[{"role": "user", "content": "Write a haiku about playing tennis."}],
40        stream=True,
41        stream_options={"include_usage": True},
42    )
43    for chunk in response:
44        if chunk.choices and (content := chunk.choices[0].delta.content):
45            print(content, end="")
Before we run the script again, we'll need to set the HYPERDX_API_KEY environment variable to the API key we got from HyperDX.
We can get this by navigating to http://localhost:8080/team and copying the Ingestion API Key.
1export HYPERDX_API_KEY="xxx"
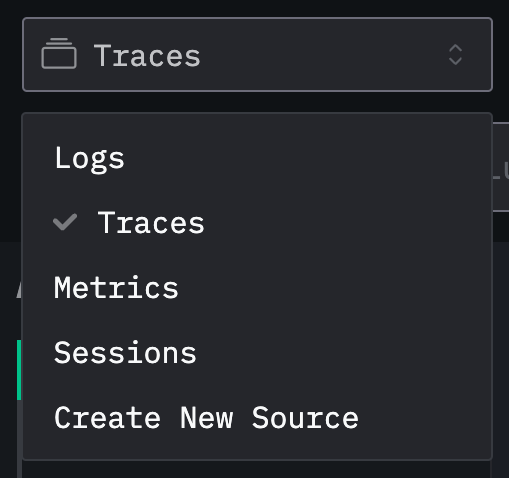
We can run our script again and then go back to the HyperDX home page at http://localhost:8080 and select Traces from the dropdown:
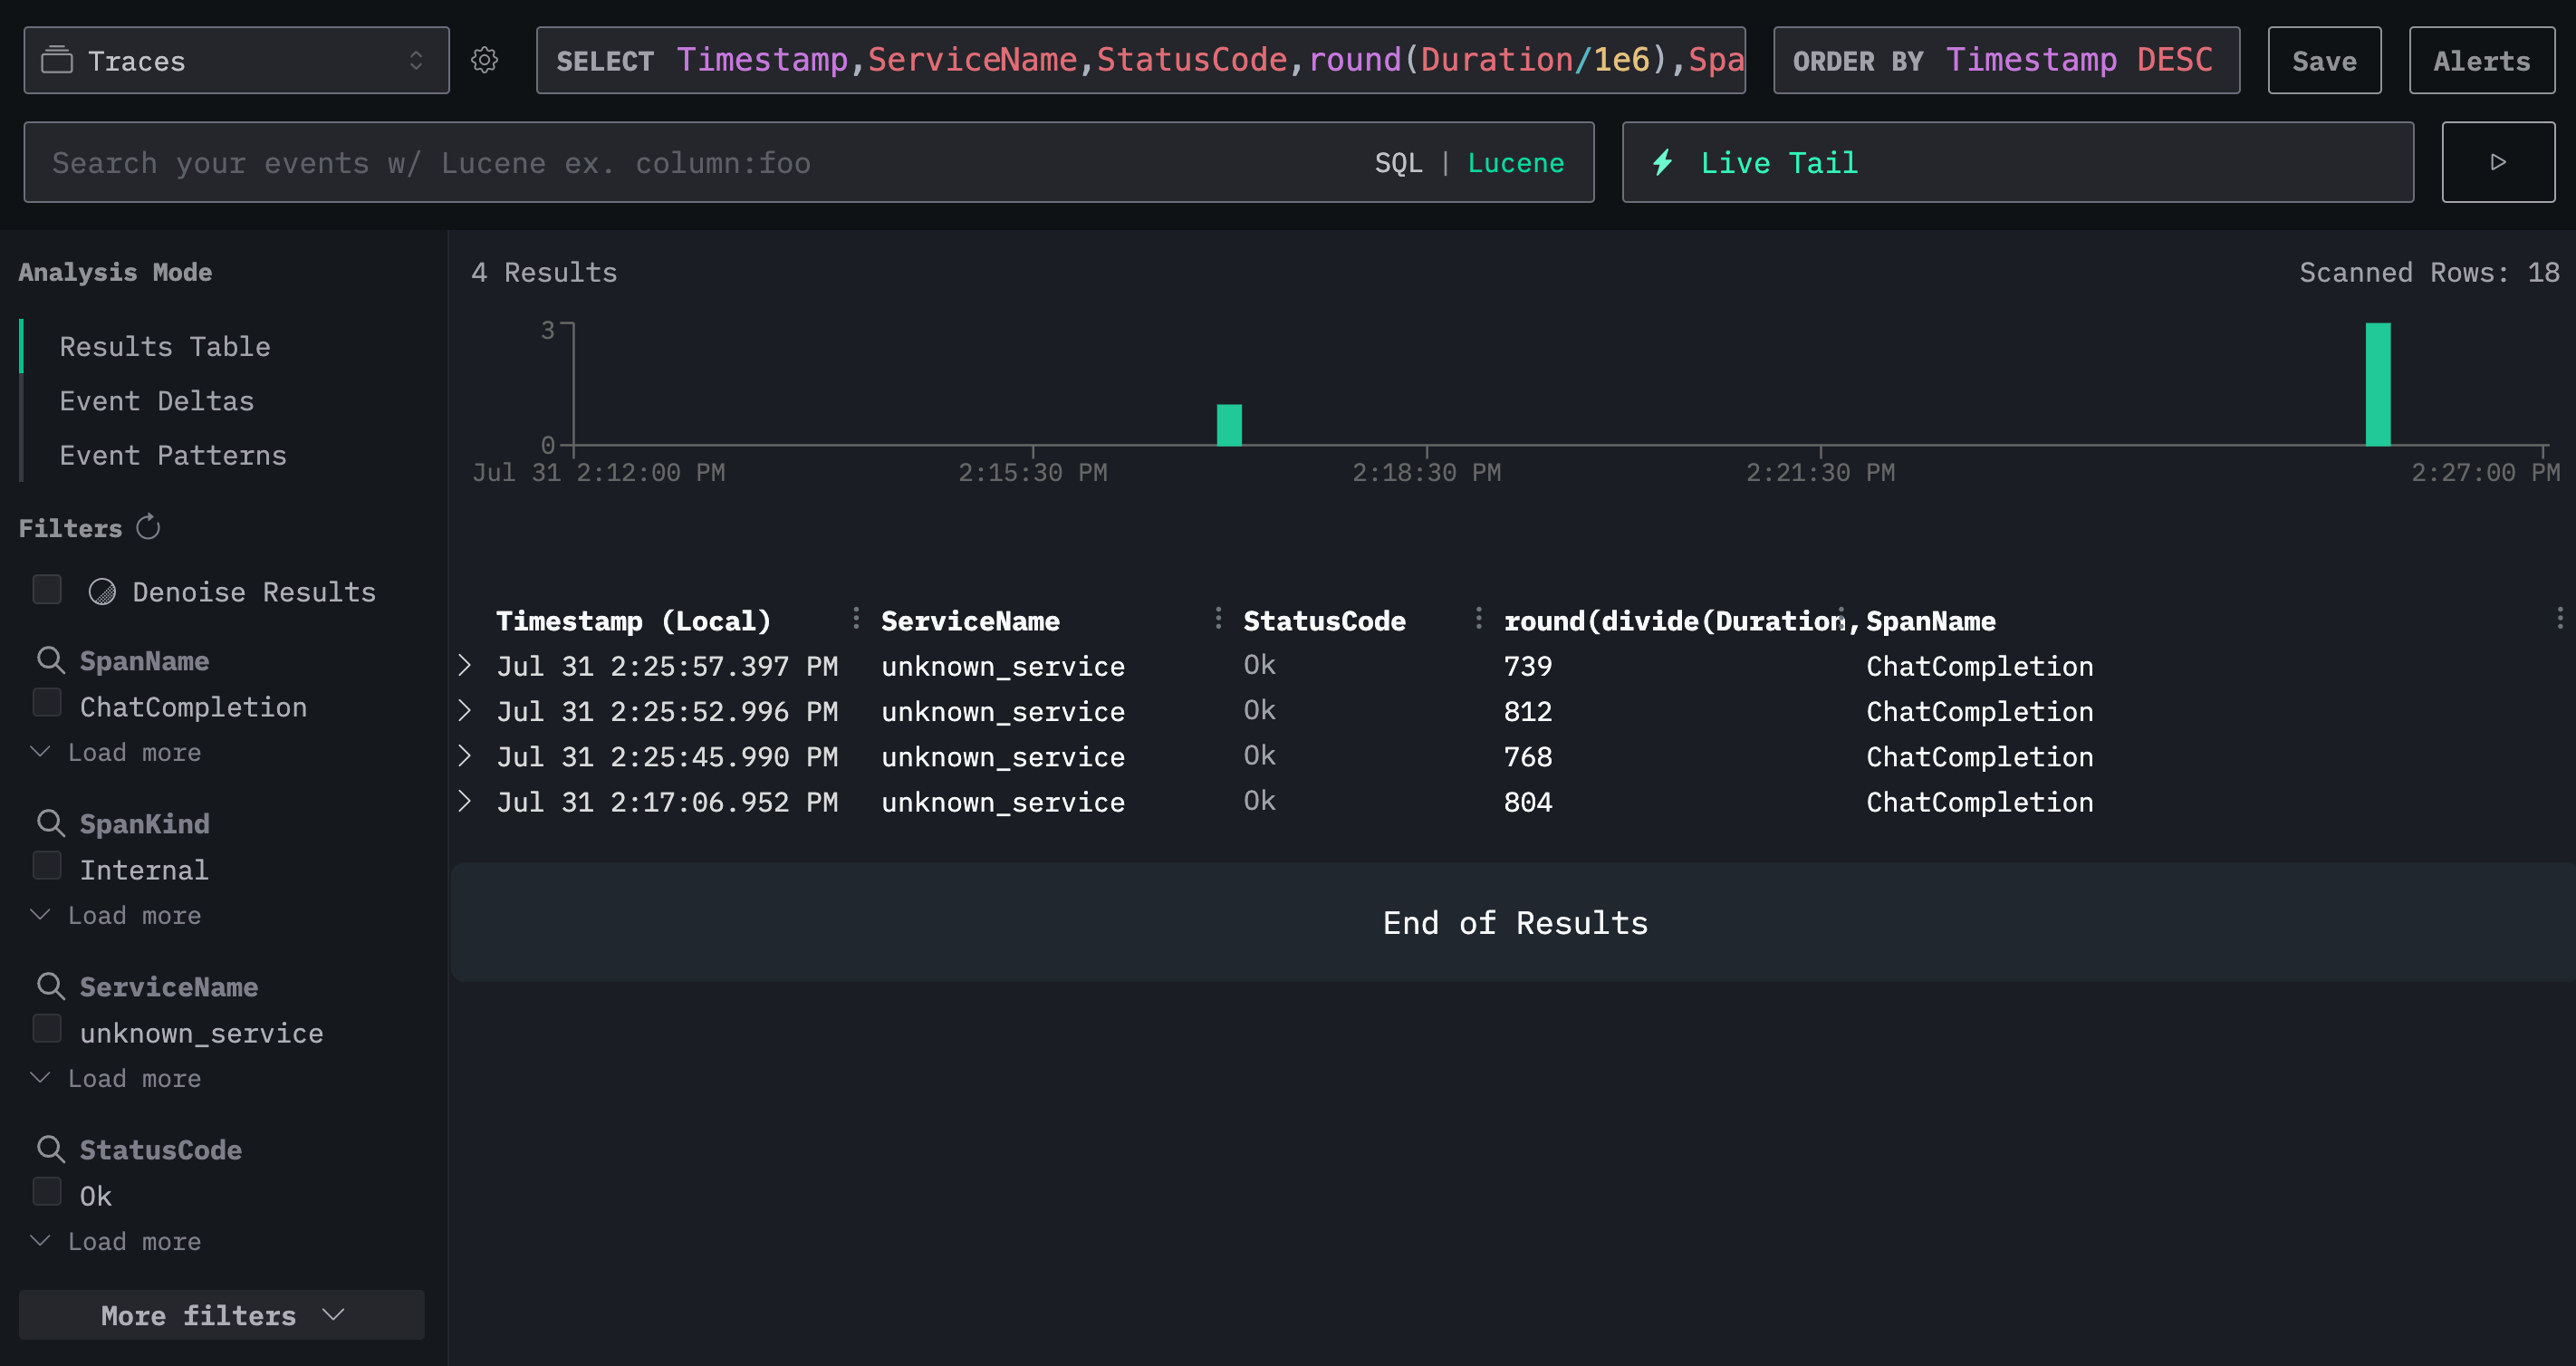
We'll now see new events coming in after each invocation of the above script:
Creating a HyperDX dashboard #
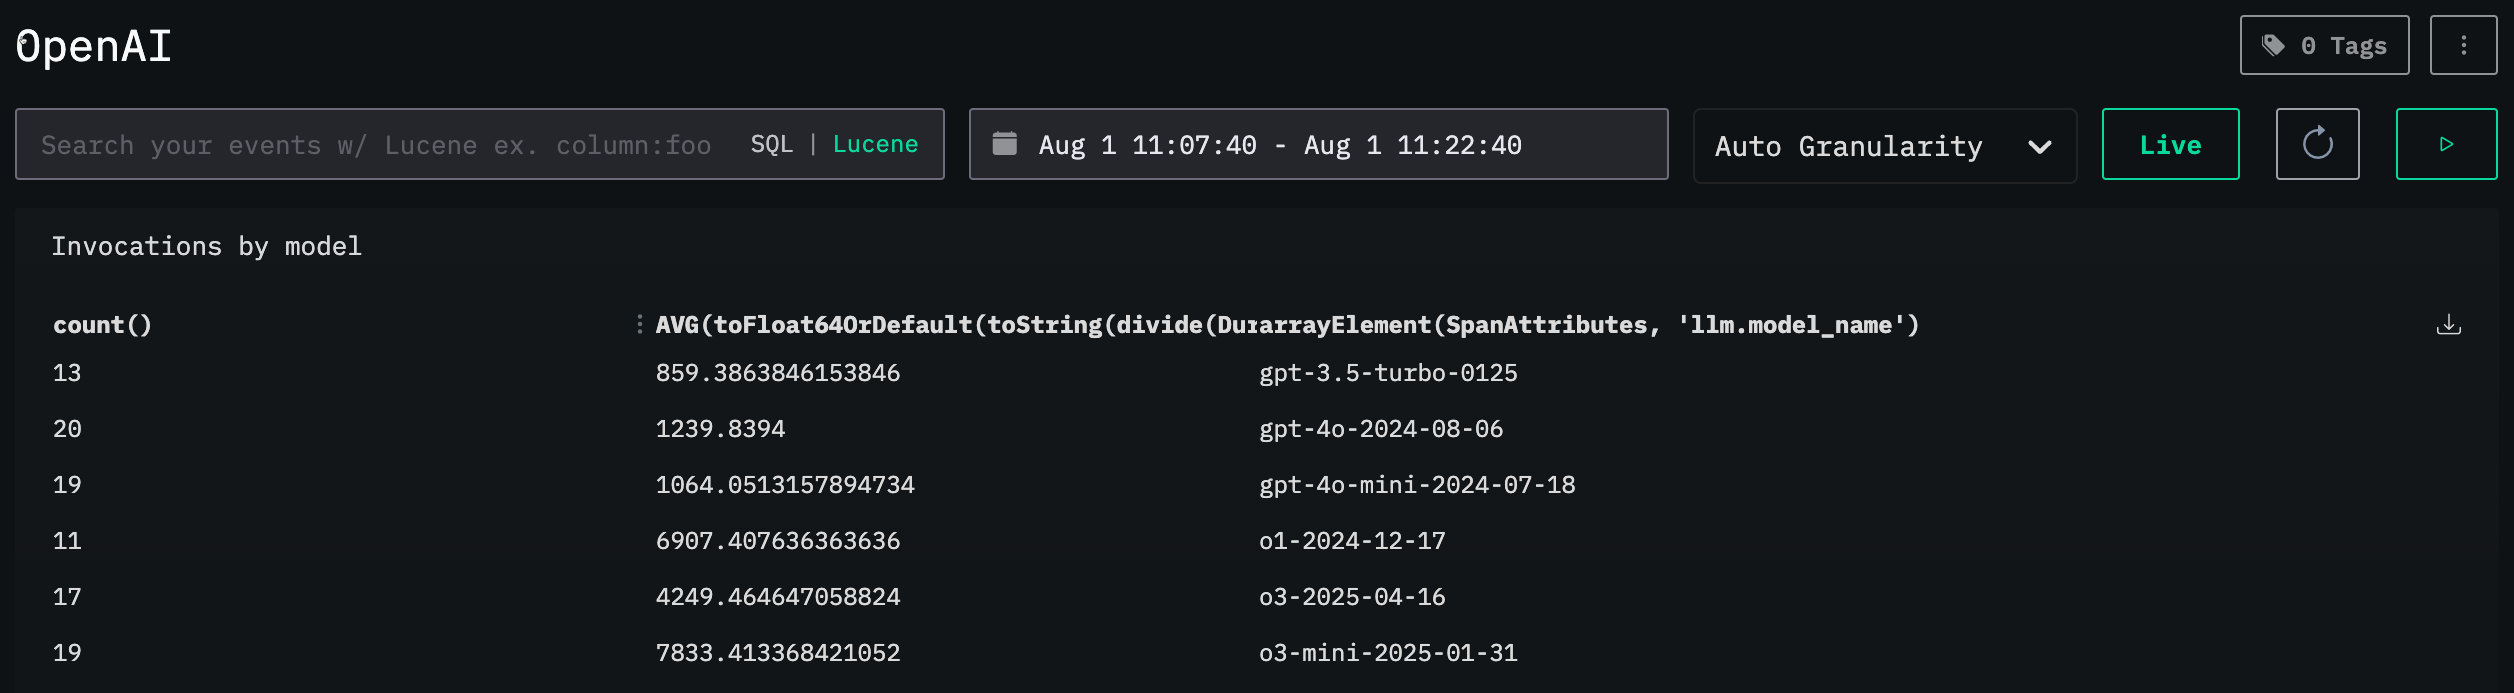
We can then make a dashboard to keep track of calls being made to OpenAI. We'll add the following tile that tracks the number of invocations of each model and their average duration:
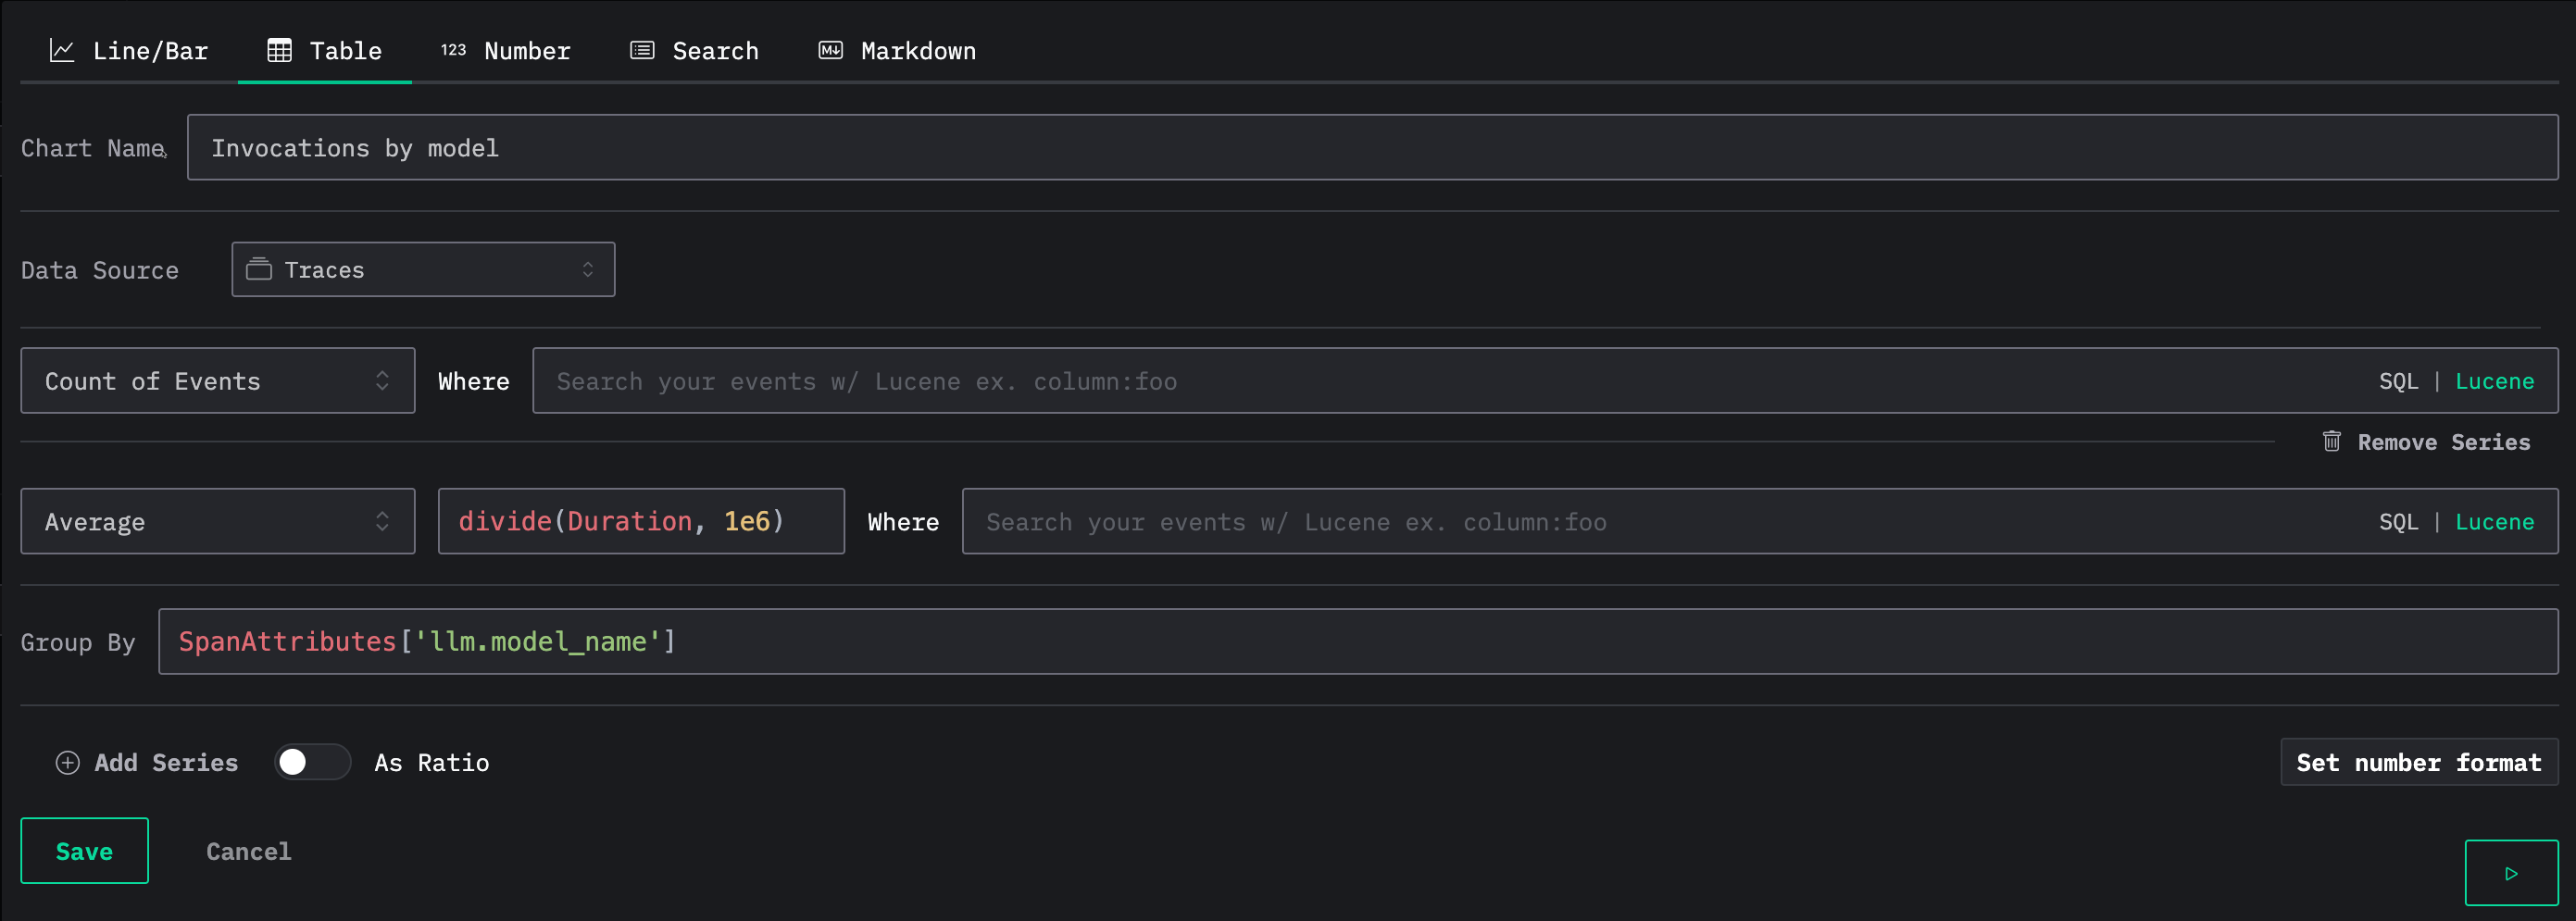
Below we can see the dashboard with our table:
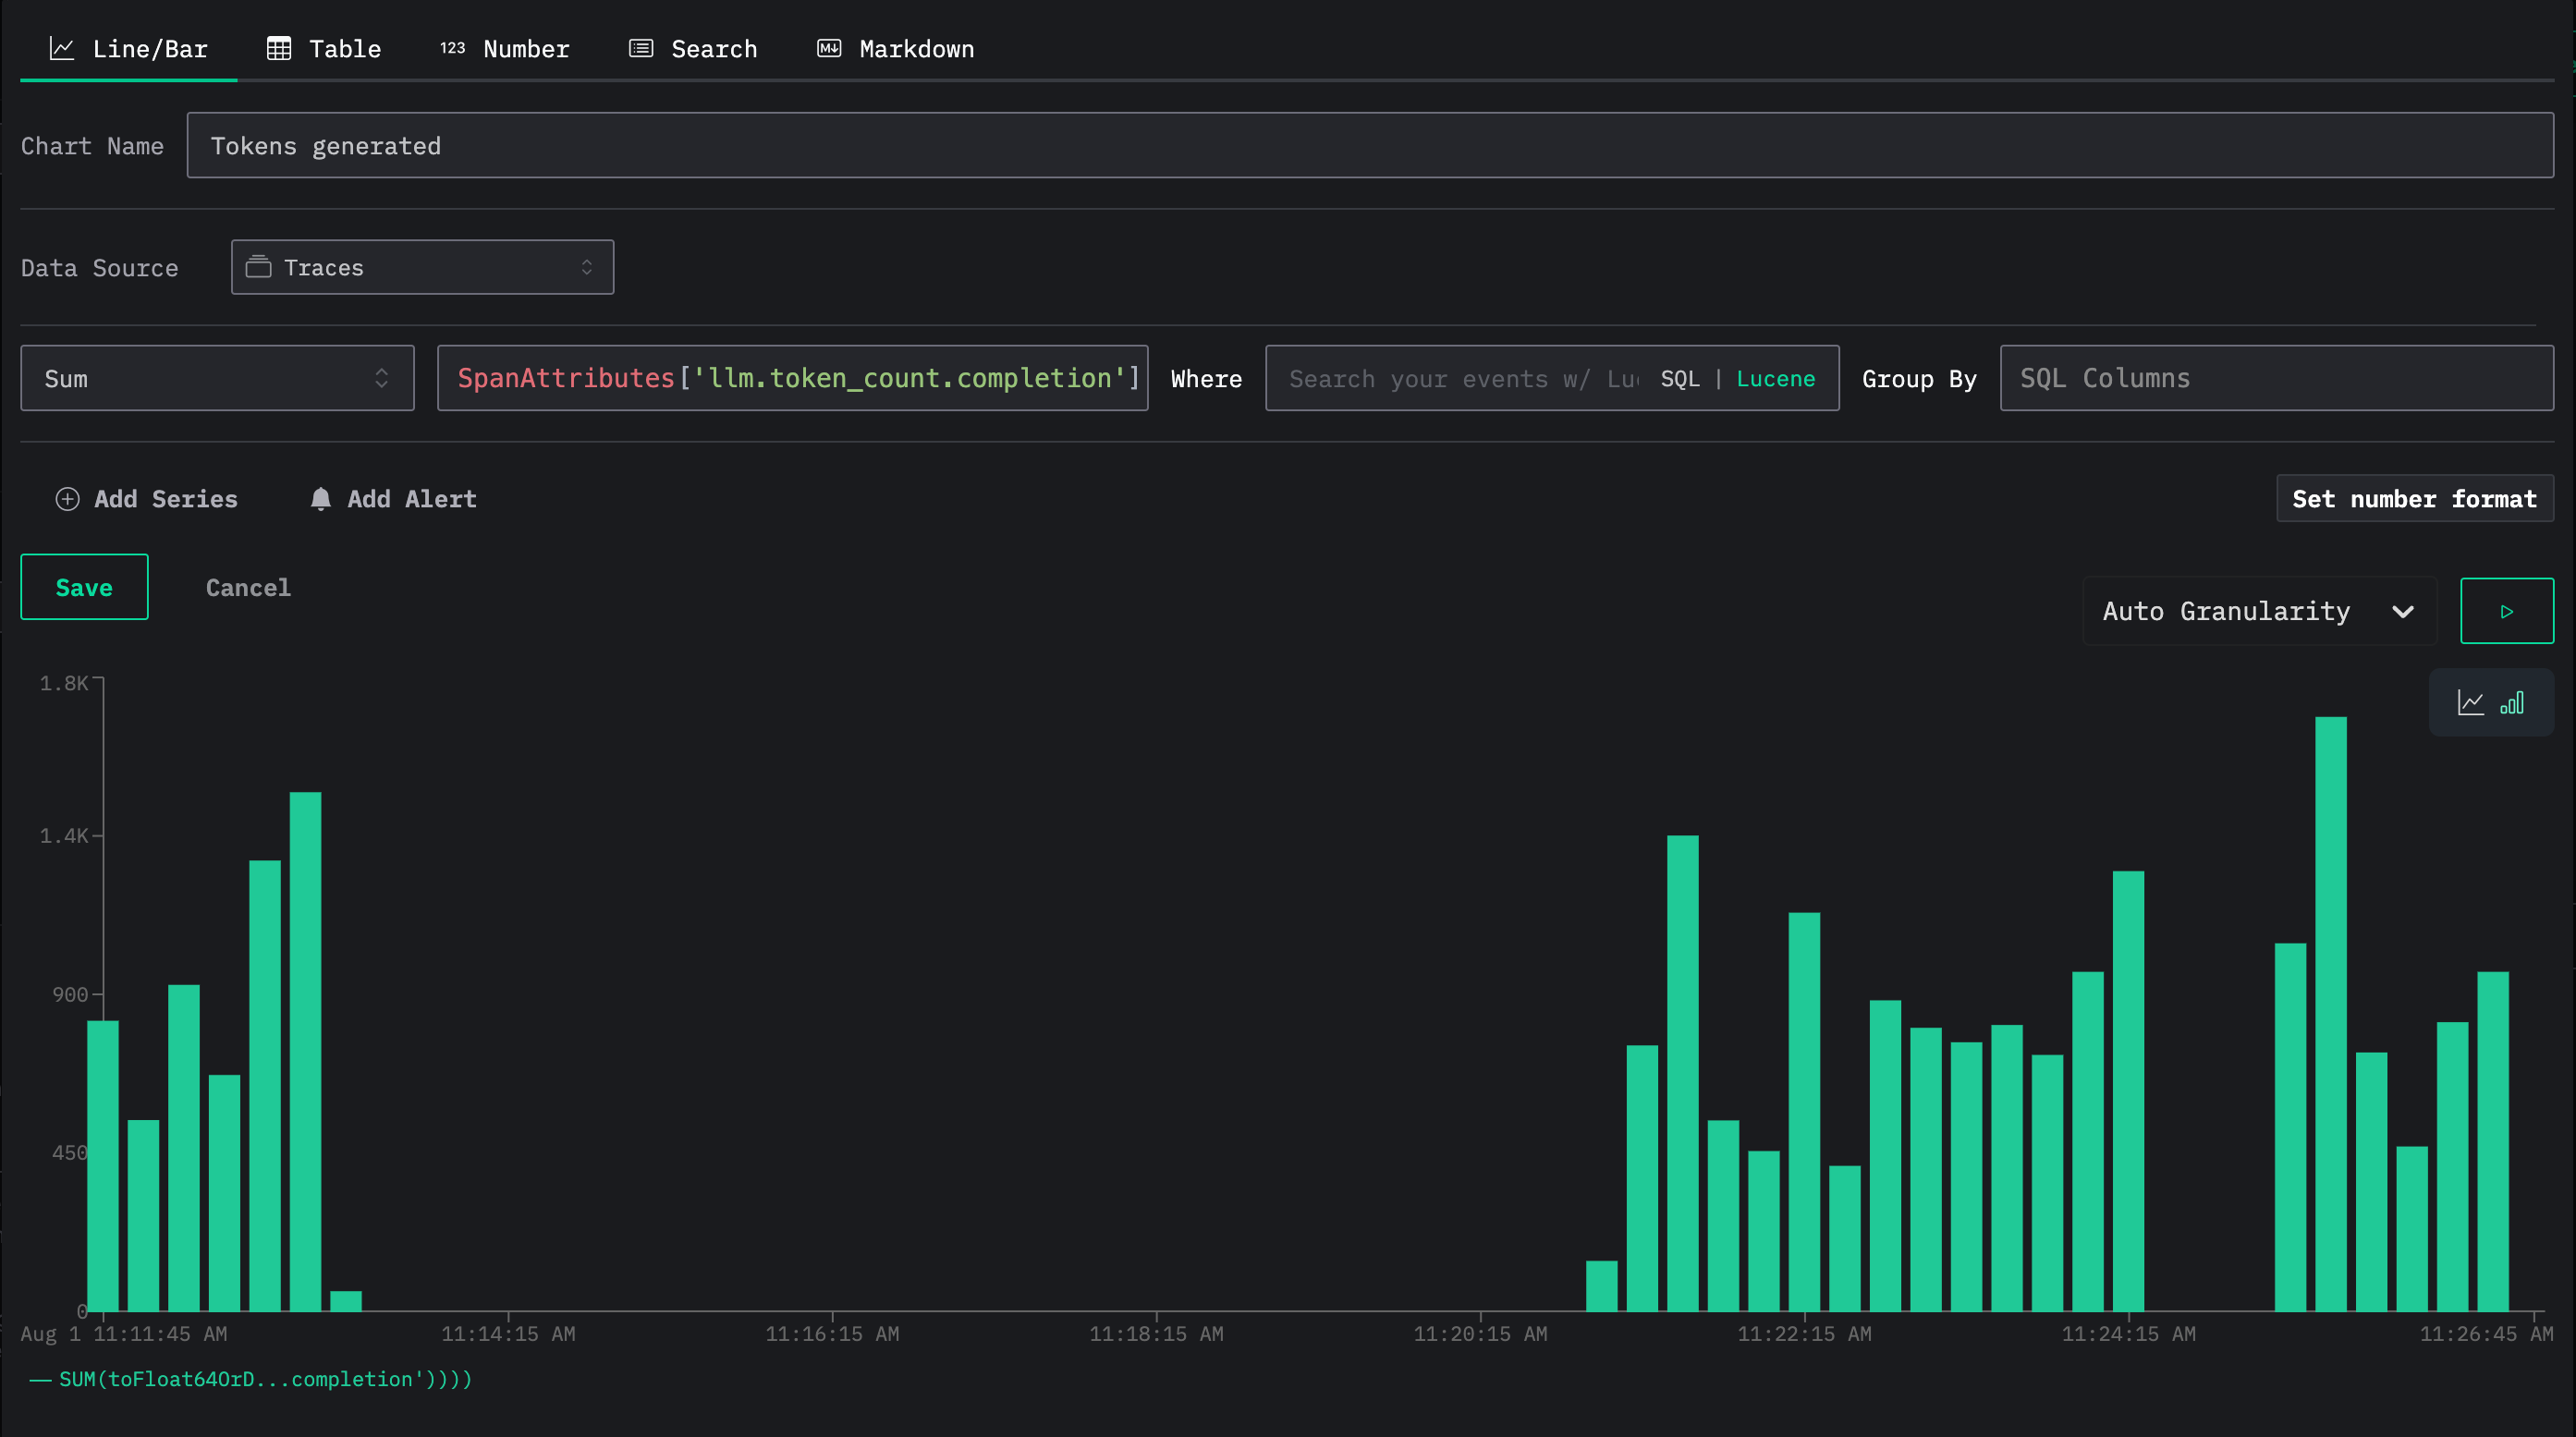
We can also add a tile that tracks the total number of output tokens used: