Explore GitHub stats with ClickHouse #
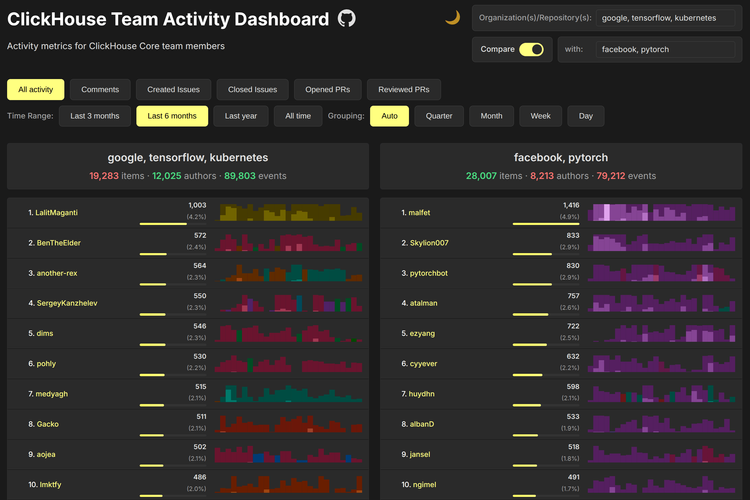
Imagine watching the pulse of the entire GitHub ecosystem as it happens - seeing which repositories are trending, understanding developer activity patterns, and analyzing open-source collaboration in real-time. This is the kind of insight we can unlock with real-time analytics.
SELECT message FROM (
SELECT '🚀 Welcome to the interactive guide to Real-time analytics with GitHub data! 📊'  as message, 0 as order
UNION ALL
SELECT 'All queries in this guide execute against our live demo environment sql.clickhouse.com.' as messsage, 1 as order
UNION ALL
SELECT 'To run a query simply use the ▶ button' as messsage, 2 as order
) ORDER BY order ASC
What is Real-time analytics? #
Real-time analytics refers to data processing that delivers insights to end users and customers as soon as the data is generated. Real-time analytics systems are built on top of event streams, which consist of a series of events ordered in time.
One such stream of data is GitHub events. When analyzing GitHub events in real-time, we need a database that can handle both high-speed ingestion and quick analytical queries. ClickHouse provides the capabilities to process our dataset of over 7 billion GitHub events, which grows as new events are ingested.
The system we build must have specific characteristics to achieve real-time analytics:
- Ingestion speed - The value of streaming data decreases over time. We, therefore, need a fast data ingestion process to make the data immediately available for querying.
- Query speed - We should aim for web page response times, i.e., a query's time to run and return a result should be sub-second and ideally 100 milliseconds or less.
- Concurrency - Real-time analytics systems are often user-facing and must handle tens or hundreds of thousands of queries per second.
In this interactive guide, you'll learn how to build a real-time analytics system that can process and analyze GitHub activity as it happens. We'll start with some simple queries and build our way up to more complex ones, showing how to maintain performance while handling real-world data volumes.
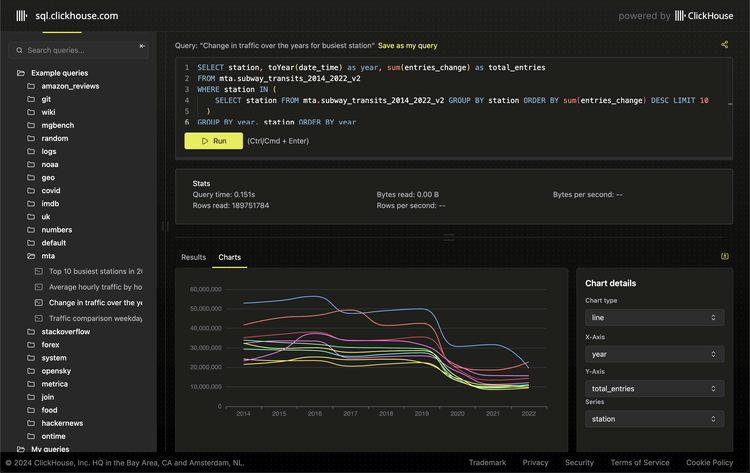
The GitHub events data is continuously loaded into the github_events table of the github database in the ClickHouse SQL playground. We’ll query the dataset via a JavaScript widget embedded in the page. Each query has a link to the underlying query in the SQL playground, so you can play around with and tweak the queries yourself.
Let’s get started!
An intro to GitHub events #
The GitHub events dataset contains individual records for various GitHub activities, including people liking, forking, or commenting on repositories.
That data has been ingested into a table called events. Below is an example of one row in the table:
1SELECT *
2FROM github.events
3WHERE (event_type = 'PullRequestReviewCommentEvent')
4AND (repo_name = 'ClickHouse/ClickHouse')
5ORDER BY created_at ASC
6LIMIT 1
7FORMAT PrettyJSONEachRow;
{
	"file_time": "2019-09-23 11:00:00",
	"event_type": "PullRequestReviewCommentEvent",
	"actor_login": "excitoon",
	"repo_name": "ClickHouse/ClickHouse",
	"repo_id": "60246359",
	"created_at": "2019-09-23 11:25:54",
	"updated_at": "2019-09-23 11:25:54",
	"action": "created",
	"comment_id": "327062451",
	"body": "c03857b2aee08fee4616cecae6caf4dbd94555bf",
	"path": "dbms/src/TableFunctions/TableFunctionS3.h",
	"position": 5,
	"line": 0,
	"ref": "",
	"ref_type": "none",
	"creator_user_login": "excitoon",
	"number": 5596,
	"title": "s3 table function and storage",
	"labels": [
    	"can be tested",
    	"pr-feature"
	],
	"state": "closed",
	"locked": 0,
	"assignee": "",
	"assignees": [],
	"comments": 0,
	"author_association": "CONTRIBUTOR",
	"closed_at": "2019-09-22 21:53:07",
	"merged_at": "2019-09-22 21:53:07",
	"merge_commit_sha": "2054f80623f0454b1aabeccbaffc49e17e005926",
	"requested_reviewers": [
    	"stavrolia"
	],
	"requested_teams": [],
	"head_ref": "table_function_s3",
	"head_sha": "4608da13449dacbeabda77ec9d7d10bb8db1358b",
	"base_ref": "master",
	"base_sha": "617604193531842d5e4059ace9d3ef24eeaa8ab6",
	"merged": 0,
	"mergeable": 0,
	"rebaseable": 0,
	"mergeable_state": "unknown",
	"merged_by": "",
	"review_comments": 0,
	"maintainer_can_modify": 0,
	"commits": 0,
	"additions": 0,
	"deletions": 0,
	"changed_files": 0,
	"diff_hunk": "@@ -0,0 +1,25 @@n+#pragma oncen+n+#include n+#include n+#include ",
	"original_position": 5,
	"commit_id": "4608da13449dacbeabda77ec9d7d10bb8db1358b",
	"original_commit_id": "4608da13449dacbeabda77ec9d7d10bb8db1358b",
	"push_size": 0,
	"push_distinct_size": 0,
	"member_login": "",
	"release_tag_name": "",
	"release_name": "",
	"review_state": "none"
}
We can write the following query to get the schema for this table:
DESCRIBE github.events
The full schema is quite large, so we’re just showing the columns we’ll use in our queries below.
CREATE TABLE github.events
(
	`file_time` DateTime,
	`event_type` Enum8('CommitCommentEvent' = 1, 'CreateEvent' = 2, 'DeleteEvent' = 3, 'ForkEvent' = 4, 'GollumEvent' = 5, 'IssueCommentEvent' = 6, 'IssuesEvent' = 7, 'MemberEvent' = 8, 'PublicEvent' = 9, 'PullRequestEvent' = 10, 'PullRequestReviewCommentEvent' = 11, 'PushEvent' = 12, 'ReleaseEvent' = 13, 'SponsorshipEvent' = 14, 'WatchEvent' = 15, 'GistEvent' = 16, 'FollowEvent' = 17, 'DownloadEvent' = 18, 'PullRequestReviewEvent' = 19, 'ForkApplyEvent' = 20, 'Event' = 21, 'TeamAddEvent' = 22),
	`actor_login` LowCardinality(String),
	`repo_name` LowCardinality(String),
	`repo_id` LowCardinality(String),
	`created_at` DateTime,
..
)
ENGINE = MergeTree
ORDER BY (event_type, repo_name, toDate(created_at))
The most important thing to note here is the ordering key as indicated by the ORDER BY clause. This sorts the data by (event_type, repo_name, toDate(created_at)) because most of our queries will filter by event_type and repo_name with a possible date range filter. Sorting the data this way means that ClickHouse can easily prune the data it needs to read at query time.
Sorting data according to query patterns is one of the things that makes ClickHouse fast. You can read more in the Why is ClickHouse so fast? guide.
Let’s have a look at how much data we’ll be working with:
At the time of writing, we’ve got just over 9 billion rows, which takes up over 400GB of space in its compressed form and over 3TB uncompressed. It’s a pretty sizable dataset!
Fast SQL aggregations #
ClickHouse is an analytics database optimized for fast aggregation queries written in SQL. Thanks to the ordering key, high compression, and parallelized execution, even complex aggregations can be fast for almost 10 billion rows.
Over the following few sections, we will first run some aggregations before learning how to optimize these queries for even faster performance.
Most popular event types #
Let’s start by getting an overview of the dataset. The following query counts the number of each event type:
We can see a breakdown of the event types in the GitHub event types documentation.
Top repositories by stars in 2025 #
GitHub is centered around repositories where various communities and people collaborate. However, not all repositories are created equal. Some will be extremely popular, and others will act as dumping grounds for code (I’m sure we’ve all got a few of those!).
One way to determine a repository's popularity is to look at its number of stars. We can compute the number of stars by counting the times that event_type = 'WatchEvent'. We’ll also filter the results so we find the most popular repositories in 2025:
When writing this guide, in March 2025, the top repository is deepseek-ai/DeepSeek-R1, which has received over 80,000 stars in about 6 weeks. This is the repository for DeepSeek’s R1 reasoning model, which was the talk of the (AI) world when it was released.
Stars per day #
Next, we’ll see how the DeepSeek repository has accumulated those stars over time. The following query counts the number of stars received each day:
When the model was first released, we saw a surge of over 10,000 stars in one day at the end of January, but it quickly fell off, and now, it receives between 100 and 300 stars per day.
Counting event types #
Many people have starred the DeepSeek repository, but is there any other activity? We can count some of the other event types like this:
We can see that, in addition to stars, many issues have been created for this repository.
Counting event types over time #
We can see how those event types have evolved by writing the following query:
This chart more clearly shows the surge in interest on January 28th, 2025, followed by the quick tailoff.
Let’s move away from DeepSeek now and do some more general queries.
Emerging Repos #
It might also be interesting to see which repositories have “emerged” in 2024 and become popular. We can again filter by event_type = 'WatchEvent' and conditionally count using the countIf function to create buckets for 2023 and 2024 before computing year-over-year growth.
1SELECT repo_name,
2       countIf(toYear(created_at) <= 2023) AS stars2023,
3       countIf(toYear(created_at) <= 2024) AS stars2024,
4       round((stars2024 - stars2023) / stars2023, 3) AS yoy,
5       min(created_at) AS first_seen
6FROM github.events
7WHERE event_type = 'WatchEvent'
8GROUP BY repo_name
9ORDER BY yoy DESC, stars2024 DESC
10LIMIT 10
We can see the emergence of ollama for running LLM models locally, as well as the hugely popular Zed editor. All of these projects have infinite growth with no stars in 2023.
If we filter to projects which already existed prior to 2024 with an established presence i.e. > 1000 stars.
1SELECT repo_name,
2        countIf(toYear(created_at) <= 2023) AS stars2023,
3        countIf(toYear(created_at) <= 2024) AS stars2024,
4        round((stars2024 - stars2023) / stars2023, 3) AS yoy,
5        min(created_at) AS first_seen
6FROM github.events
7WHERE event_type = 'WatchEvent'
8GROUP BY repo_name
9HAVING stars2023 > 1000
10ORDER BY yoy DESC, stars2024 DESC
11LIMIT 10
The conductor project looks particularly interesting with impressive community growth numbers in the last year. CopilotKit looks potentially applicable to ClickHouse.
Events by day of week #
Something that you often see with tech datasets is that there will be a dip in engagement over the weekend. Let’s see if that’s the case in this dataset by counting the number of events by the day of the week:
It’s hard to see the dip over the weekend for the less popular event types, as PushEvent dominates the chart. We can fix that by writing the following query to compute the relative change in the numbers of each event by day of the week:
1WITH eventTypeStars AS (
2  SELECT toDayOfWeek(created_at) AS dayOfWeek, event_type,
3         count() AS stars,
4         max(stars) OVER(PARTITION BY event_type) AS maxDay
5  FROM github.events
6  WHERE event_type IN (
7    'ForkEvent', 'IssuesEvent', 'WatchEvent', 'PushEvent', 'PullRequestEvent'
8  )
9  GROUP BY ALL
10  ORDER BY dayOfWeek ASC
11)
12
13SELECT *, stars/maxDay AS ratio
14FROM eventTypeStars;
This more clearly shows that activity dropped significantly over the weekend, with Tuesday being the best day to “catch a star”. Another interesting thing in this chart is that all event types except PullRequestEvent recovered from Saturday to Sunday.
Most active contributors (not bots) #
Let’s change track and explore the contributors on GitHub. We’re going to find the most active contributors by counting the number of pushes done on the top 1000 repositories:
1SELECT
2	actor_login,
3	countIf(event_type = 'PushEvent') AS c,
4	uniq(repo_name) AS repos,
5	countIf(event_type = 'IssuesEvent') AS issues,
6	countIf(event_type = 'WatchEvent') AS stars,
7	anyHeavy(repo_name)
8FROM github.events
9WHERE (event_type IN ('PushEvent', 'IssuesEvent', 'WatchEvent')) AND (repo_name IN (
10	SELECT repo_name
11	FROM github.events
12	WHERE event_type = 'WatchEvent'
13	GROUP BY repo_name
14	ORDER BY count() DESC
15	LIMIT 1000
16))
17GROUP BY actor_login
18HAVING (repos < 10000) AND (issues > 1) AND (stars > 1)
19ORDER BY c DESC
20LIMIT 20;
You may notice the query took a little longer to run than the others we’ve written. That’s because it is the first query we’ve written that doesn’t exploit the ordering key very well - we don’t filter by event_type or repo_name in the outer query. Therefore, many rows need to be scanned to compute the answer.
Let’s look at some ways to improve this query's performance.
Faster SQL aggregations with incremental materialized views #
Incremental materialized views shift the cost of computation from query time to insert time. An incremental materialized view is equivalent to a trigger that runs a query on blocks of data as they are inserted into a table. The result of this query is inserted into a second "target" table. These results are merged transparently in the background over time, ensuring the results are consistent with a query over the original table.
We’ll start by creating a materialized view for the inner query that returns the most popular repositories. The materialized view will write into the following target table:
CREATE TABLE repo_stars (
  repo_name String,
  count UInt32
)
ENGINE = SummingMergeTree
ORDER BY (repo_name)
And the materialized view itself is shown below:
CREATE MATERIALIZED VIEW github.repo_stars_mv
TO github.repo_stars AS
SELECT repo_name, count() as count
FROM github.events
WHERE event_type = 'WatchEvent'
GROUP BY repo_name
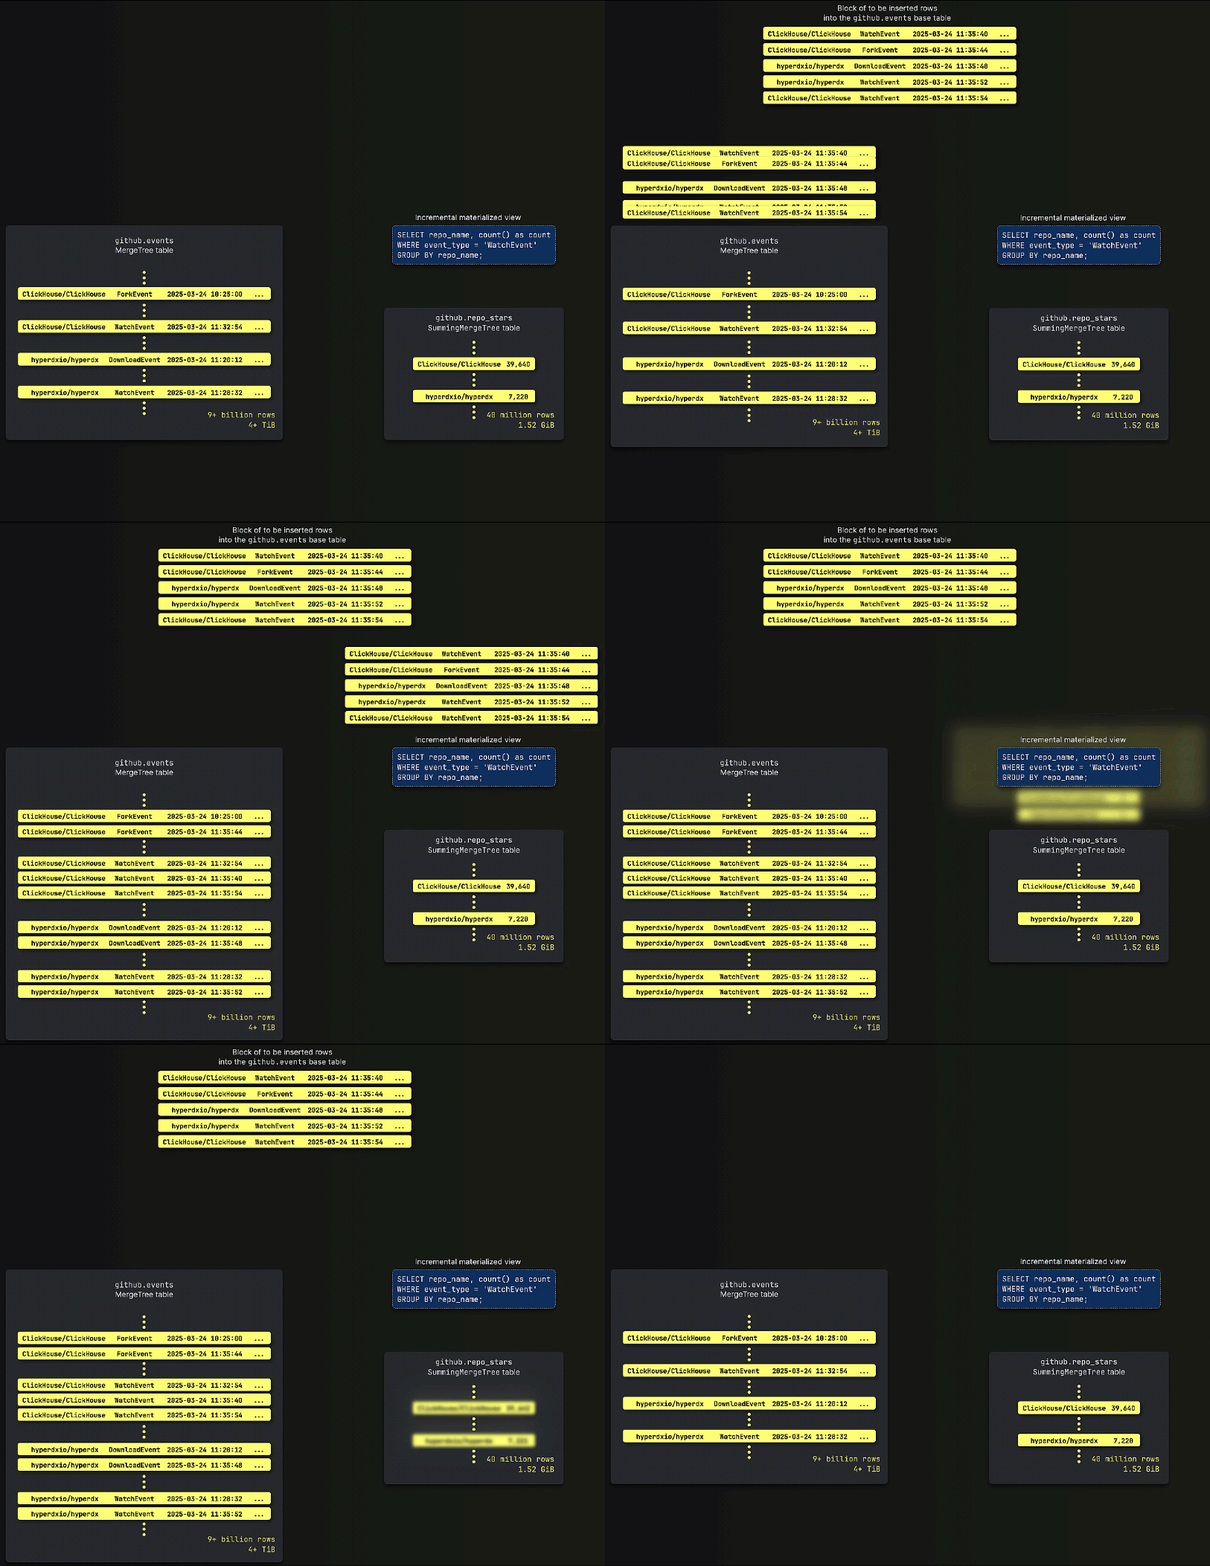
Incremental materialized views are only triggered when new rows are added to the base table (github.events in this case). We’ll also need to write a query to backfill previous data into the target table. The easiest way to do this is by writing an [INSERT INTO...SELECT](https://clickhouse.com/docs/sql-reference/statements/insert-into#inserting-the-results-of-select) query:
INSERT INTO github.repo_stars SELECT repo_name
FROM github.events
WHERE event_type = 'WatchEvent'
GROUP BY repo_name;
For an alternate way of backfilling data that’s more memory efficient and resilient to failure, see the backfilling data guide.
Once repo_stars is populated, we can update our query to find the most active contributors. Notice how the inner query now uses repo_stars:
1SELECT
2	actor_login,
3	countIf(event_type = 'PushEvent') AS c,
4	uniq(repo_name) AS repos,
5	countIf(event_type = 'IssuesEvent') AS issues,
6	countIf(event_type = 'WatchEvent') AS stars,
7	anyHeavy(repo_name)
8FROM github.events
9WHERE (event_type IN ('PushEvent', 'IssuesEvent', 'WatchEvent')) AND (repo_name IN (
10	SELECT repo_name
11	FROM github.repo_stars
12	GROUP BY repo_name
13	ORDER BY sum(count) DESC
14	LIMIT 1000
15))
16GROUP BY actor_login
17HAVING (repos < 10000) AND (issues > 1) AND (stars > 1)
18ORDER BY c DESC
19LIMIT 20;
You might also notice that we use
sum(count). This ensures that any rows for a given repository are consolidated, even if ClickHouse’s background merging (which is eventual and not guaranteed to have completed) hasn’t finished yet.
That’s knocked a few seconds off the query time, but can we speed it up further?
We can also create an incremental materialized view for the main/outer part of the query. The target table is described below:
CREATE TABLE actors_per_repo
(
	`actor_login` LowCardinality(String),
	`repo_name` String,
	`pushes` UInt32,
	`issues` UInt32,
	`stars` UInt32
)
ENGINE = SummingMergeTree
ORDER BY (repo_name, actor_login);
This table uses the SummingMergeTree table engine. When data parts are merged with this table engine, ClickHouse replaces all the rows with the same sorting key, with one row containing summed values for numeric columns. This allows the table to receive incremental updates.
The SummingMergeTree is a simpler version of the AggregatingMergeTree table engine. This latter engine can be used for all types of aggregations, storing intermediate states for aggregation results and merging them correctly. A sum presents the simplest example, but all aggregation results in ClickHouse can be stored this way.
The definition of the materialized view is shown below:
CREATE MATERIALIZED VIEW github.actors_per_repo_mv
TO github.actors_per_repo
AS
SELECT
	actor_login,
	repo_name,
	countIf(event_type = 'PushEvent') AS pushes,
	countIf(event_type = 'IssuesEvent') AS issues,
	countIf(event_type = 'WatchEvent') AS stars
FROM github.events
GROUP BY actor_login, repo_name;
And, as before, we’ll need to backfill this table:
INSERT INTO actors_per_repo SELECT
	actor_login,
	repo_name,
	countIf(event_type = 'PushEvent') AS pushes,
	countIf(event_type = 'IssuesEvent') AS issues,
	countIf(event_type = 'WatchEvent') AS stars
FROM github.events
GROUP BY actor_login, repo_name;
Now we’re ready to update our query to use actors_per_repo and see if we’ve been able to improve the performance further:
1SELECT
2	actor_login,
3	sum(pushes) AS pushes,
4	uniq(repo_name) AS repos,
5	sum(issues) AS repo_issues,
6	sum(stars) AS stars,
7	argMax(repo_name, issues) AS repo
8FROM github.actors_per_repo
9WHERE repo_name IN (
10	SELECT repo_name
11	FROM github.repo_stars
12	GROUP BY repo_name
13	ORDER BY sum(count) DESC
14	LIMIT 1000
15)
16GROUP BY actor_login
17HAVING (repos < 10000) AND (repo_issues > 1) AND (stars > 1)
18ORDER BY pushes DESC
19LIMIT 20;
Introducing these materialized views has helped reduce the query time to a couple of seconds, which is fine for many cases. If that’s still not fast enough, we have one more trick up our sleeve.
Refreshable materialized views #
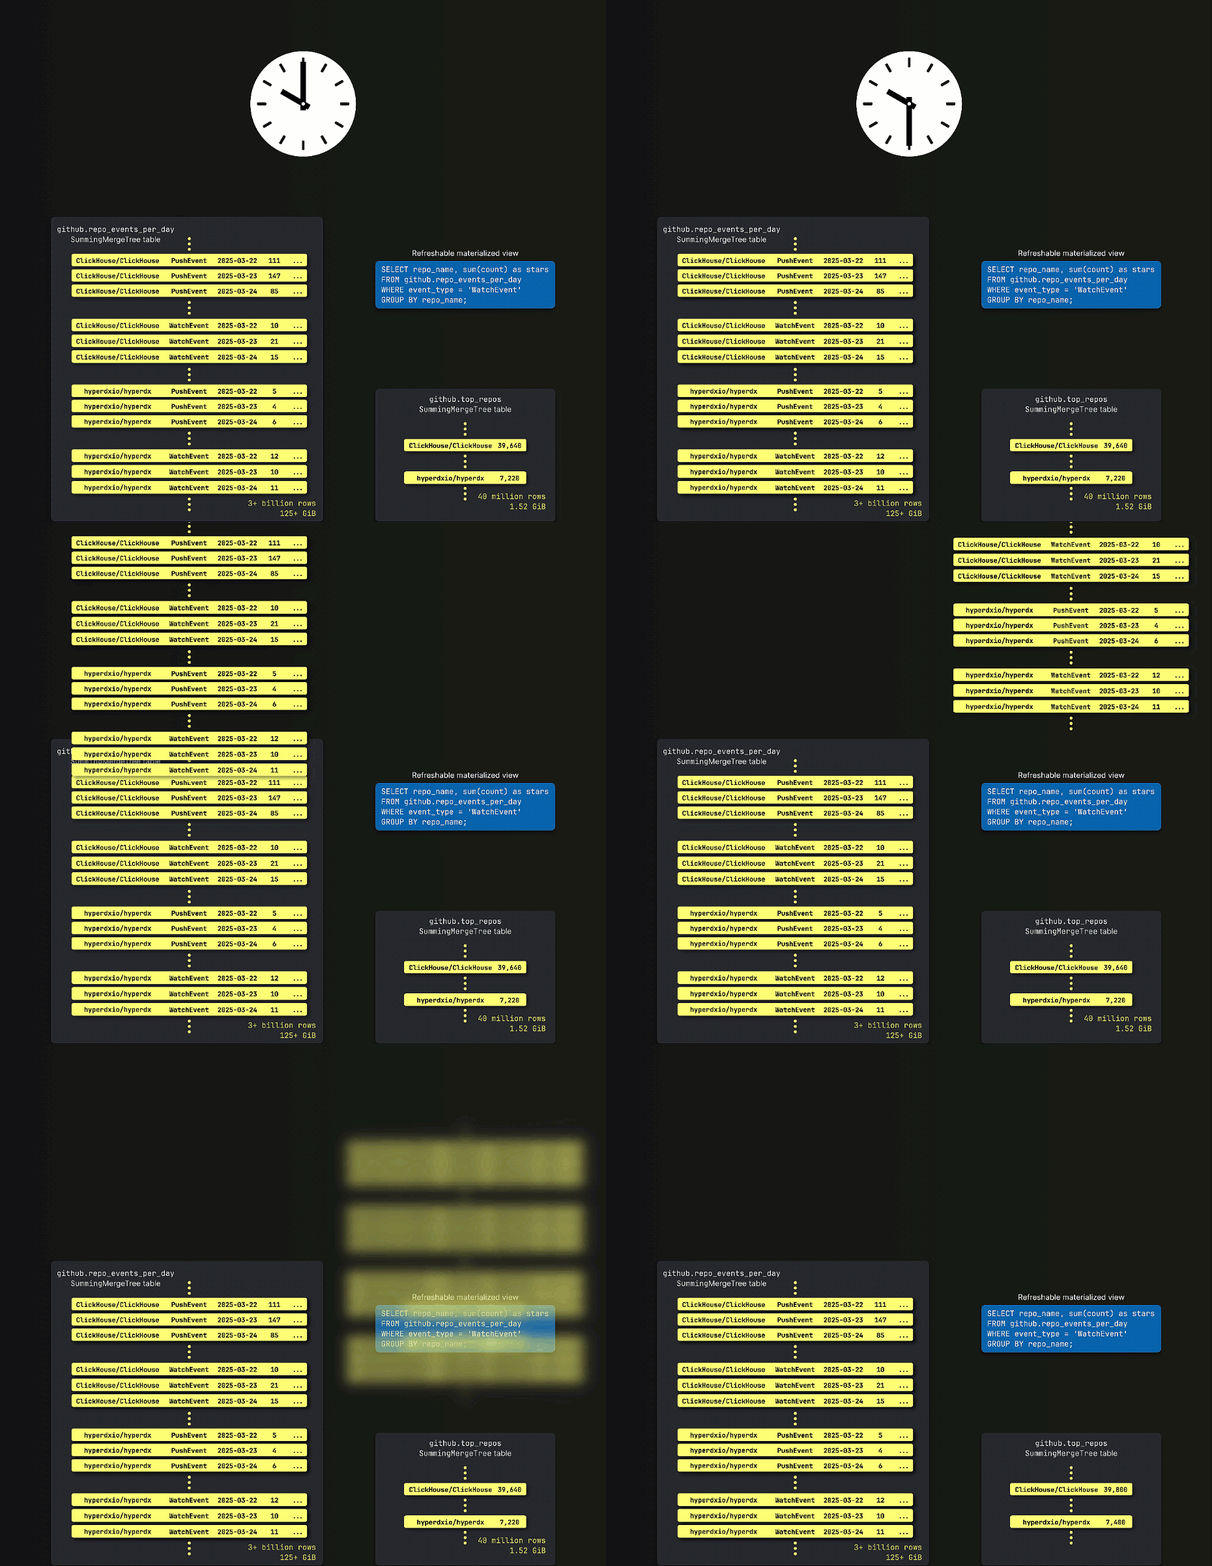
Refreshable materialized views are similar to the materialized views that you see in relational databases like Postgres. You specify a query that will be run at intervals (a bit like a cron job), and the results are stored in a target table.
Refreshable materialized views are most frequently used when you want to speed up a query that contains joins, but they can also be used when you’re happy to trade off data freshness for improved query latency and need to store a result set periodically.
We will start by speeding up the query to find the most popular repositories. We’ll create the following target table. Notice how this table is ordered by stars, thus allowing the top N to be computed easily:
CREATE TABLE github.top_repos
(
	`repo_name` String,
	`stars` UInt64
)
ENGINE = MergeTree
ORDER BY stars;
And a refreshable materialized view to populate that table:
CREATE MATERIALIZED VIEW github.top_repos_mv
REFRESH EVERY 30 MINUTES TO github.top_repos
(
	`repo_name` String,
	`stars` Int64
)
AS SELECT
	repo_name,
	sum(count) AS stars
FROM github.repo_events_per_day
WHERE event_type = 'WatchEvent'
GROUP BY ALL;
Notice how the refreshable materialized view executes every 30 minutes. The target table top_repos will be atomically updated with the results.
If we update our query to use the new target table:
1SELECT
2	actor_login,
3	sum(pushes) AS pushes,
4	uniq(repo_name) AS repos,
5	sum(issues) AS repo_issues,
6	sum(stars) AS stars,
7	argMax(repo_name, issues) AS repo
8FROM github.actors_per_repo
9WHERE repo_name IN (
10	SELECT repo_name
11	FROM github.top_repos
12	ORDER BY stars DESC
13	LIMIT 1000
14)
15GROUP BY actor_login
16HAVING (repos < 10000) AND (repo_issues > 1) AND (stars > 1)
17ORDER BY pushes DESC
18LIMIT 20;
This improves our query further to around 1.5s. We could take this even further and use a refreshable materialized view to store the complete result of the query. In this case, the final query becomes very simple - it just retrieves the top 20 results from a table.
Our target table is defined below:
CREATE TABLE github.top_actors
(
	`actor_login` LowCardinality(String),
	`pushes` UInt64,
	`repos` UInt64,
	`repo_issues` UInt64,
	`stars` UInt64,
	`repo` String
)
ENGINE = MergeTree
ORDER BY pushes;
Now, let’s create a materialized view to populate the target table:
CREATE MATERIALIZED VIEW github.top_actors_mv
REFRESH EVERY 1 HOUR TO github.top_actors
AS SELECT
	actor_login,
	sum(pushes) AS pushes,
	uniq(repo_name) AS repos,
	sum(issues) AS repo_issues,
	sum(stars) AS stars,
	argMax(repo_name, issues) AS repo
FROM github.actors_per_repo
WHERE repo_name IN (
	SELECT repo_name
	FROM github.top_repos
	ORDER BY stars DESC
	LIMIT 1000
)
GROUP BY actor_login
HAVING (repos < 10000) AND (repo_issues > 1) AND (stars > 1)
ORDER BY pushes DESC
We can then write the following query to find the top 10 most active contributors:
1/100th of a second should be fast enough for any dashboard!
Projections #
We’ll conclude this guide by revisiting the actors_per_repo table we created earlier. The table stores a row for every actor and repo name along with the number of pushes, issues, and stars.
CREATE TABLE actors_per_repo(
  `actor_login` LowCardinality(String),
  `repo_name` String,
  `pushes` UInt32,
  `issues` UInt32,
  `stars` UInt32
)
ENGINE = SummingMergeTree
ORDER BY (repo_name, actor_login);
The table is optimized for filtering by repo_name and then actor_login.
In ClickHouse, queries will be faster if the filter criteria match a column earlier in the ordering key. If you’re curious why, see A Practical Introduction to Primary Indexes in ClickHouse.
We can optimize tables for different access patterns by adding projections. Projections store a copy of the data in a table in a different order. At query time, ClickHouse will decide which projection, if any, to use.
To make this table more generically useful, and allow users to query for their own contributions, we can add a projection that sorts by actor_login. We need first to set the following property so that ClickHouse knows what to do with projections when parts are merged:
ALTER TABLE github.actors_per_repo
MODIFY SETTING deduplicate_merge_projection_mode='rebuild';
We can then create the projection and materialize it:
ALTER TABLE github.actors_per_repo
ADD PROJECTION actor_login_order (
  SELECT *
  ORDER BY actor_login
);
ALTER TABLE github.actors_per_repo
MATERIALIZE PROJECTION actor_login_order;
With this projection in place, queries for specific users are also very fast:
That's a wrap! #
That’s the end of this interactive guide to querying GitHub events data with ClickHouse. We hope you enjoyed reading it. If you’d like to play around with more datasets in ClickHouse, head over to the SQL playground.
