Introduction #
This blog post continues our series on monitoring ClickHouse. While in the previous post in this series, we focused on INSERT queries, users are also interested in troubleshooting and understanding the behavior and performance of their SELECT queries. This post will provide you with queries that will help you better understand how your service is behaving, and how to improve the performance of your SELECT queries.
While the examples in this blog post assume you are using a ClickHouse Cloud instance, they can be easily modified to work on self-managed clusters. In most cases, this means modifying the FROM clause to use the table name instead of the function clusterAllReplicas. Alternatively, you can spin up a service in ClickHouse Cloud on a free trial in minutes, let us deal with the infrastructure and get you querying!
Monitoring SELECT queries #
The SQL queries in this post fall into two main categories:
- Monitoring - Used for understanding the ClickHouse cluster setup and usage
- Troubleshooting - Required when identifying the root cause of an issue
Let's run through a quick overview of the query topics you will see on this blog post.
| Topic | Summary |
|---|---|
| Global overview of your cluster | Useful mainly for Troubleshooting. Review how much data you have and the primary key size. These metrics are great to understand how you are using ClickHouse but can also be worth Monitoring. |
| Most expensive SELECT queries | Troubleshooting. Review what are your most expensive queries to prioritise tuning efforts. |
| Compare metrics from two queries | Troubleshooting and Monitoring. Use this query to iteratively improve a specific query, by comparing your original query to a new version. |
| SELECT query deep dive | Troubleshooting by reviewing what ClickHouse is doing during each execution. |
| Average query duration and number of requests | Monitoring. The data by table, or as an overview of your ClickHouse service is a great way to understand changes on the query or service performance. Great to define trend usage. |
| Number of SQL queries by client or user | Monitoring. Provide reports about the usage of each client or user. |
| TOO_MANY_SIMULTANEOUS_QUERIES | Troubleshooting and Monitoring. Useful for identifying long running or “stuck” queries when under high load. A second query assists with Troubleshooting by returning the errors and stack traces produced by failed queries. |
Global overview of your cluster #
The following query provides an overview of your service. Specifically, what are the biggest tables in terms of rows, data and primary key size. We can also see when each table was last modified:
SELECT
    table,
    sum(rows) AS rows,
    max(modification_time) AS latest_modification,
    formatReadableSize(sum(bytes)) AS data_size,
    formatReadableSize(sum(primary_key_bytes_in_memory)) AS primary_keys_size,
    any(engine) AS engine,
    sum(bytes) AS bytes_size
FROM clusterAllReplicas(default, system.parts)
WHERE active
GROUP BY
    database,
    table
ORDER BY bytes_size DESC

Most expensive SELECT queries #
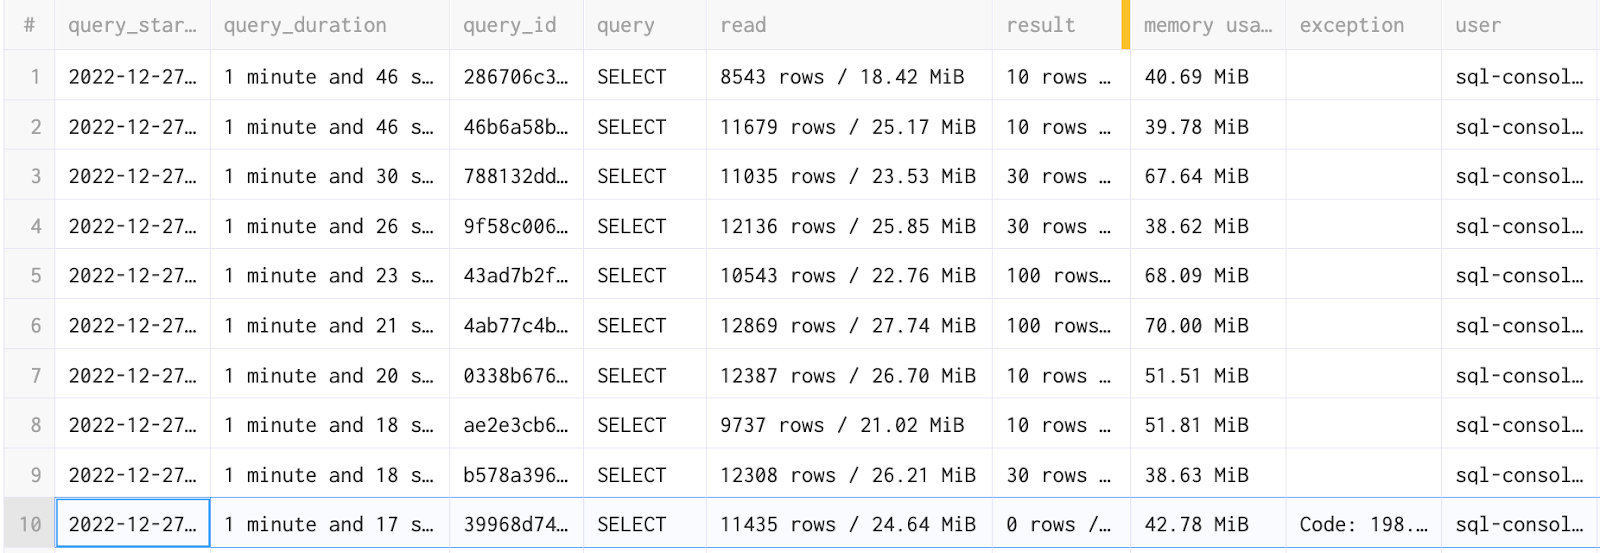
We next want to identify the most expensive queries in our ClickHouse service. The query below returns historical queries ordered by their duration, allowing us to see which ones need our attention.
We have a large number of columns that will allow us to better understand the reasons why each query was slow. This includes:
- Columns allowing us to understand the query type and its timing.
- The size and the amount of rows that have been read by the service to provide the result.
- The number of rows returned in the result.
- Any exceptions which have occurred including the stack trace.
- The requesting user.
- The format, functions, dictionaries and settings used.
SELECT
    type,
    query_start_time,
    formatReadableTimeDelta(query_duration_ms) AS query_duration,
    query_id,
    query_kind,
    is_initial_query,
    query,
    concat(toString(read_rows), ' rows / ', formatReadableSize(read_bytes)) AS read,
    concat(toString(result_rows), ' rows / ', formatReadableSize(result_bytes)) AS result,
    formatReadableSize(memory_usage) AS `memory usage`,
    exception,
    concat('\n', stack_trace) AS stack_trace,
    user,
    initial_user,
    multiIf(empty(client_name), http_user_agent, concat(client_name, ' ', toString(client_version_major), '.', toString(client_version_minor), '.', toString(client_version_patch))) AS client,
    client_hostname,
    databases,
    tables,
    columns,
    used_aggregate_functions,
    used_dictionaries,
    used_formats,
    used_functions,
    used_table_functions,
    ProfileEvents.Names,
    ProfileEvents.Values,
    Settings.Names,
    Settings.Values
FROM system.query_log
WHERE (type != 'QueryStart') AND (query_kind = 'Select') AND (event_date >= (today() - 1)) AND (event_time >= (now() - toIntervalDay(1)))
ORDER BY query_duration_ms DESC
LIMIT 10

Compare metrics between two queries #
Let's imagine that you have identified an expensive SELECT that you wish to improve from the previous query results. For this, you can compare metrics between versions of the query using their respective ids. This information is returned if you are using the clickhouse-client.
clickhouse-client --host play.clickhouse.com --user play --secure
ClickHouse client version 22.13.1.160 (official build).
Connecting to play.clickhouse.com:9440 as user play.
Connected to ClickHouse server version 22.13.1 revision 54461.

play-eu :) SELECT 1

SELECT 1

Query id: 13f75255-edec-44b2-b63b-affa9d345f0f

┌─1─┐
│ 1 │
└───┘

1 row in set. Elapsed: 0.002 sec.
However, we appreciate this information might not always be available through other clients or applications. Assuming the response to the earlier section has provided you with your baseline id, execute the next iteration of your query and collect the id with the following:
SELECT
    query_id,
    query,
    formatReadableTimeDelta(query_duration_ms) AS query_duration
FROM clusterAllReplicas(default, system.query_log)
WHERE (type != 'QueryStart') AND (query_kind = 'Select') AND (event_time >= (now() - toIntervalHour(1)))
ORDER BY event_time DESC
LIMIT 10
If you are unable to identify the query e.g. due to high load, add a filter for the table or query column using the ILIKE function.
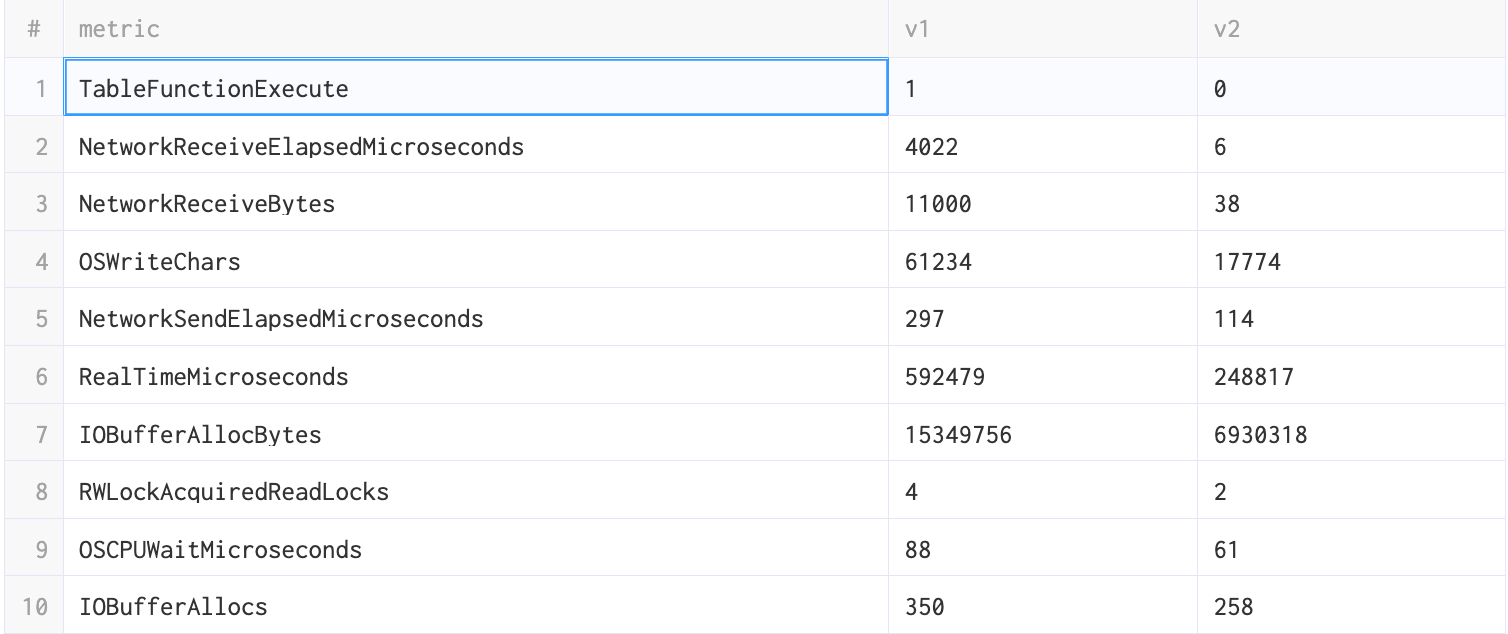
Once you have the two query_id values, you can run the following query to compare both executions.
WITH
    query_id = '...query_id_old_version...' AS first,
    query_id = '...query_id_new_version...' AS second
SELECT
    PE.Names AS metric,
    anyIf(PE.Values, first) AS v1,
    anyIf(PE.Values, second) AS v2
FROM clusterAllReplicas(default, system.query_log)
ARRAY JOIN ProfileEvents AS PE
WHERE (first OR second) AND (event_date = today()) AND (type = 2)
GROUP BY metric
HAVING v1 != v2
ORDER BY
    (v2 - v1) / (v1 + v2) ASC,
    v2 ASC,
    metric ASC

In general you should be looking for large differences in any metric. You can see the description of these metrics here. If you have any doubt or question as to the cause of difference, please open an issue with the ClickHouse Support team.
SELECT query deep dive #
It’s also possible that you have only one version of your query and you need to improve. Suppose your goal is to understand what ClickHouse is doing behind the scenes with the objective of making the query faster. For this, you will need to use ClickHouse Client. No worries if you don't have one installed, in less than two minutes we will have one running.
If you do not have an installation of the ClickHouse Client you have two options:
- Download the executable and start the client from your terminal
curl https://clickhouse.com/ | sh

./clickhouse client --host xx.aws.clickhouse.cloud --secure --user default --password your-password
- Alternatively, you can also use docker containers to start a clickhouse-client and connect to ClickHouse cloud:
docker run -it --entrypoint clickhouse-client clickhouse/clickhouse-server --host xx.aws.clickhouse.cloud --secure –user default --password your-password
This latter command benefits from making it trivial to test different client versions if required e.g.
docker run -it --entrypoint clickhouse-client clickhouse/clickhouse-server:22.12 --host xx.aws.clickhouse.cloud --secure –user default --password your-password
From the client terminal first set the log level to trace level :
SET send_logs_level = 'trace'
Running the query you wish to improve will cause a detailed log to be displayed in the clickhouse-client shell.
Using the UK house price dataset, we will utilize the following query as an example to show the value of the contents of this log.
SELECT
  county,
  price
FROM uk_price_paid
WHERE town = 'LONDON'
ORDER BY price DESC
LIMIT 3

Query id: 31bc412a-411d-4717-95c1-97ac0b5e22ff

┌─county─────────┬─────price─┐
│ GREATER LONDON │ 594300000 │
│ GREATER LONDON │ 569200000 │
│ GREATER LONDON │ 523000000 │
└────────────────┴───────────┘

3 rows in set. Elapsed: 1.206 sec. Processed 27.84 million rows, 44.74 MB (23.08 million rows/s., 37.09 MB/s.)
This query is already very fast but let's suppose we add some projections to accelerate it further.
We can add a projection with new primary keys in order to drastically limit the amount of data ClickHouse needs to read from disk. This process is explained in detail in the recent blog post Super charging your ClickHouse queries.
ALTER TABLE uk_price_paid
    ADD PROJECTION uk_price_paid_projection
    (
        SELECT *
        ORDER BY
            town,
            price
    )

ALTER TABLE uk_price_paid MATERIALIZE PROJECTION uk_price_paid_projection

SELECT
  county,
  price
FROM uk_price_paid
WHERE town = 'LONDON'
ORDER BY price DESC
LIMIT 3

Query id: f5931796-62d1-4577-9a80-dbaf21a43049

┌─county─────────┬─────price─┐
│ GREATER LONDON │ 594300000 │
│ GREATER LONDON │ 569200000 │
│ GREATER LONDON │ 448500000 │
└────────────────┴───────────┘

3 rows in set. Elapsed: 0.028 sec. Processed 2.18 million rows, 13.09 MB (78.30 million rows/s., 470.20 MB/s.)
We can immediately see this query reads fewer rows and is considerably faster. We can also compare some metrics provided by the logs from the execution before and after the projection:
| Original query | Query with projection |
|---|---|
| Selected 6/6 parts by partition key, 6 parts by primary key, 3401/3401 marks by primary key, 3401 marks to read from 6 ranges | Selected 6/6 parts by partition key, 6 parts by primary key, 266/3401 marks by primary key, 266 marks to read from 6 ranges |
| Reading approx. 27837192 rows with 2 streams | Reading approx. 2179072 rows with 2 streams |
| Read 27837192 rows, 42.67 MiB in 1.205915216 sec., 23083871 rows/sec., 35.38 MiB/sec. | Read 2179072 rows, 12.48 MiB in 0.027350854 sec., 79671077 rows/sec., 456.28 MiB/sec. |
| MemoryTracker: Peak memory usage (for query): 73.20 MiB. | MemoryTracker: Peak memory usage (for query): 1.73 MiB. |
| TCPHandler: Processed in 1.209767078 sec. | TCPHandler: Processed in 0.028087551 sec. |
As you can see the logs provided by send_logs_level are really useful to better understand what ClickHouse is doing and the improvements your changes provide for each query.
In the logs we can also see debug messages like this one:
Used generic exclusion search over index for part 202211_719_719_0 with 1 steps
As mentioned in our documentation, the generic exclusion search algorithm is used when a query is filtering on a column that is part of a compound key, but is not the first key column is most effective when the predecessor key column has low(er) cardinality.
Again if you have any message that you don’t understand, do not hesitate to contact ClickHouse Support.
Average query duration and number of requests #
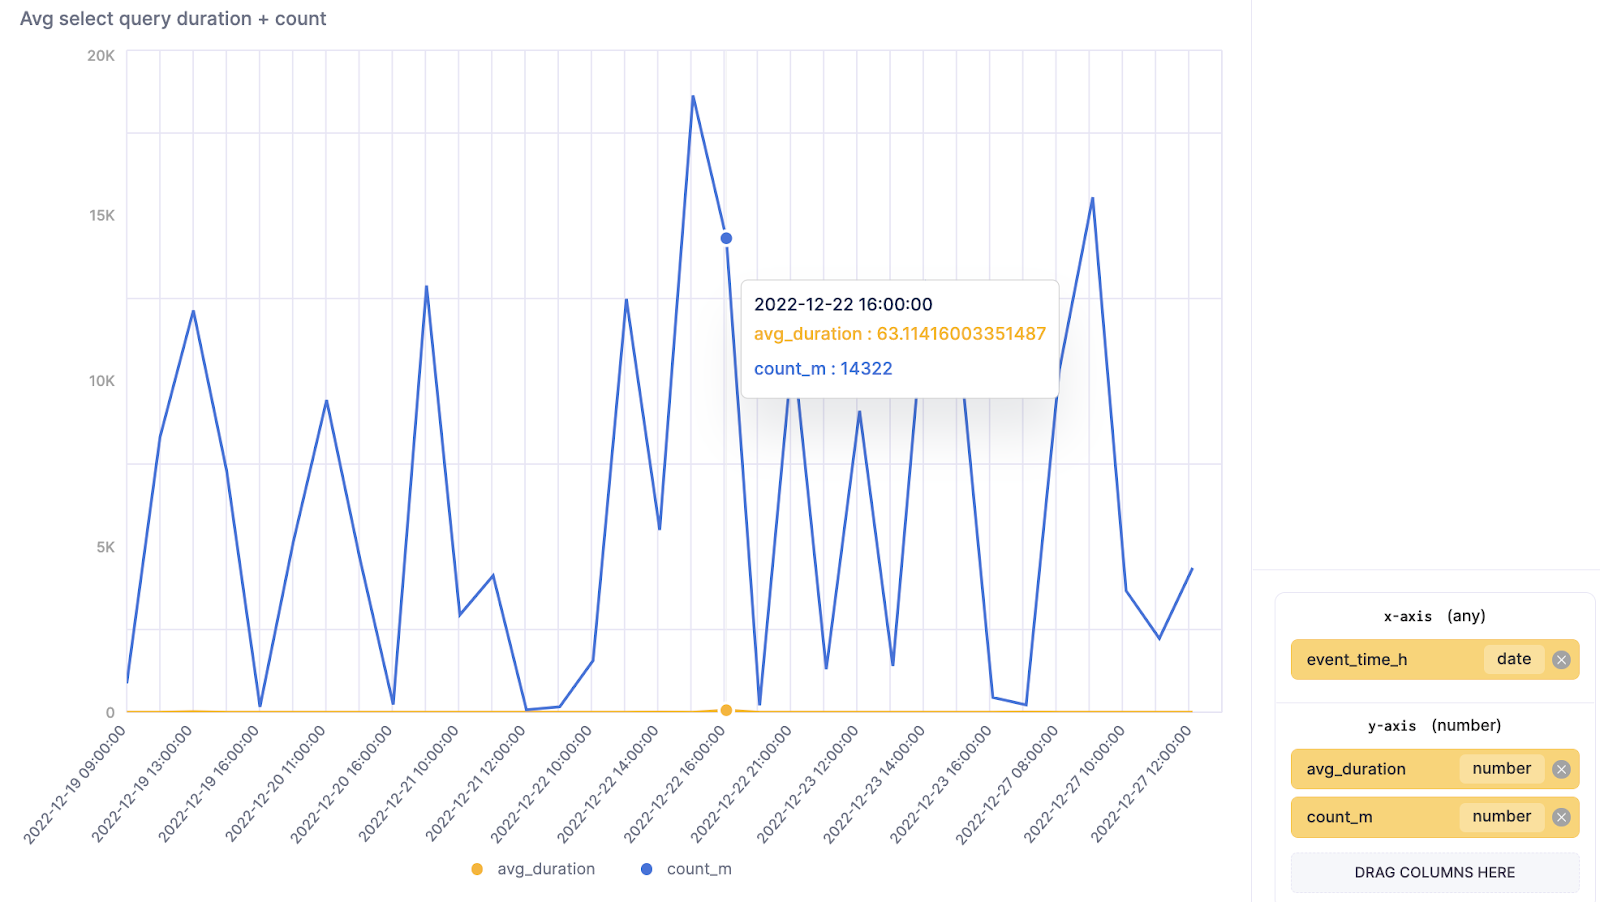
It’s important to understand how many concurrent select queries a ClickHouse service is handling and for how long on average these requests are taking to be processed. This data is also great for troubleshooting, as you can see if the number of requests has had a negative impact on the response time. While for our example we count the requests across all databases and tables, this query could easily be modified to filter for one or more specific tables or databases.
The following query is also great as a time-series visualization in SQL console.
SELECT
    toStartOfHour(event_time) AS event_time_h,
    count() AS count_m,
    avg(query_duration_ms) AS avg_duration
FROM clusterAllReplicas(default, system.query_log)
WHERE (query_kind = 'Select') AND (type != 'QueryStart') AND (event_time > (now() - toIntervalDay(3)))
GROUP BY event_time_h
ORDER BY event_time_h ASC

Note: avg_duration is in milliseconds
Number of SQL queries by client or user #
While we have seen how the total number of queries, and their duration, can be visualized across all clients, you will often need to identify hot spots from a specific user or client. In this case, performing a similar query with grouping by the client name is useful. The query below aggregates the last 10 minutes and groups by client_name. Feel free to adapt it if you need a larger overview of the same data.
SELECT
    toStartOfMinute(event_time) AS event_time_m,
    if(empty(client_name), 'unknow_or_http', client_name) AS client_name,
    count(),
    query_kind
FROM clusterAllReplicas(default, system.query_log)
WHERE (type = 'QueryStart') AND (event_time > (now() - toIntervalMinute(10))) AND (query_kind = 'Select')
GROUP BY
    event_time_m,
    client_name,
    query_kind
ORDER BY
    event_time_m DESC,
    count() ASC
LIMIT 100

This query can also be adapted to show the top queries by user, by modifying the GROUP BY to use the user column instead of the client_name.
Troubleshooting TOO_MANY_SIMULTANEOUS_QUERIES #
This error can happen when you are handling a very large number of concurrent SELECT queries. The settings max_concurrent_queries and the more specific max_concurrent_select_queries can help you to fine-tune when this error is triggered. If this error does occur, it is important to establish that no queries are “stuck”. The results of the query below show an elapsed column formatted with the formatReadableTimeDelta function, which can be easily used to see if any of the queries are stuck.
SELECT
    formatReadableTimeDelta(elapsed) AS time_delta,
    *
FROM clusterAllReplicas(default, system.processes)
WHERE query ILIKE 'SELECT%'
ORDER BY time_delta DESC

While all of the queries in my cluster have completed in less than a second, this should be reviewed carefully if your ClickHouse service has a large and heavy number of SELECT queries.
If you identified queries that are stuck or failed in the previous query, you can review the system.stack_trace table to get more details on the cause with a full stack trace. This information is useful for troubleshooting.
SELECT
    thread_id,
    query_id,
    arrayStringConcat(arrayMap((x, y) -> concat(x, ': ', y), arrayMap(x -> addressToLine(x), trace), arrayMap(x -> demangle(addressToSymbol(x)), trace)), '\n') AS n_trace
FROM clusterAllReplicas(default, system.stack_trace)
WHERE query_id IS NOT NULL
SETTINGS allow_introspection_functions = 1

When using the ClickHouse SQL-console, you can double click on each cell to get the full context via an inspector.
Conclusion #
In this blog post, we have reviewed different ways to troubleshoot and understand how SELECT queries are behaving in ClickHouse as well as providing the methods to help you to review your improvements and changes. We recommend proactively monitoring the results of these queries and alerting if the behavior is usual, potentially using tools such as Grafana, which has a mature ClickHouse integration and supports alerting. In the next post from this series, we will review queries to monitor and troubleshoot a distributed ClickHouse deployment.


