
In the last year, we have built and released ClickHouse Cloud, delivering a beta release in September and, more recently, reaching GA this month. As our Cloud usage grows, our support team is increasingly required to monitor and help diagnose issues on our customer’s clusters. For this, we often rely on the system tables provided by ClickHouse. In this blog series, we share some of their common queries to benefit our self-managed community, utilizing SQL queries to monitor your SQL queries! In our first post, we focus on monitoring data concerning INSERT statements to address early misconfiguration or misuse. In a later post, we’ll look at monitoring SELECT queries and how we can detect problems your users are experiencing early, allowing you to deliver a better ClickHouse experience.
All of the examples in this post were created in ClickHouse Cloud where you can spin up a cluster on a free trial in minutes, let us deal with the infrastructure, and get querying! This includes access to SQL Console, which we have used here for visualizing the results of queries.
Monitoring Insert queries #
In this blog post, you will find a list of useful SQL queries for monitoring the results of INSERT statements. These queries fall into two main categories:
- Monitoring - Used for understanding the clickhouse cluster setup and usage
- Troubleshooting - Required when identifying the root cause of an issue
Let's run through a quick overview of the queries you will see on this blog post.
| Topic | Summary |
|---|---|
| Monitoring Insert Metrics | Monitoring. Using this query you can follow the amount of bulk inserts handled by ClickHouse. This data looks great on time series graphs. |
| Total written rows and total bytes on disk | Troubleshooting. Review the amount of data ingested for the latest insert queries. |
| Frequency of new part creation | Monitoring and Troubleshooting. When using async_insert you may need to keep an eye on the number of new parts created. The trends from this query allow us to tune the async settings. |
| INSERT query duration | Monitoring. Define an insert SLA and alert if it’s breached. |
| Memory and CPU Usage | Troubleshooting. This helps you to find expensive queries and better understand resource usage. |
| Number of parts per partition | Monitoring and Troubleshooting. This will require ClickHouse knowledge but this is a good way to understand how your cluster is working. |
| Number of parts per partition by table | Mainly Troubleshooting to find hotspots or bottlenecks |
| Parts peak usage of memory by table | Mainly Troubleshooting to find hotspots or bottlenecks |
| Errors in parts | Troubleshooting. A great query to understand if we had errors, which error? When? And how many times? |
Monitoring Asynchronous Inserts #
Asynchronous inserts are the recommended way to insert data into ClickHouse Cloud via the async_insert setting. For further details on how they work and the accompanying best practices, see here.
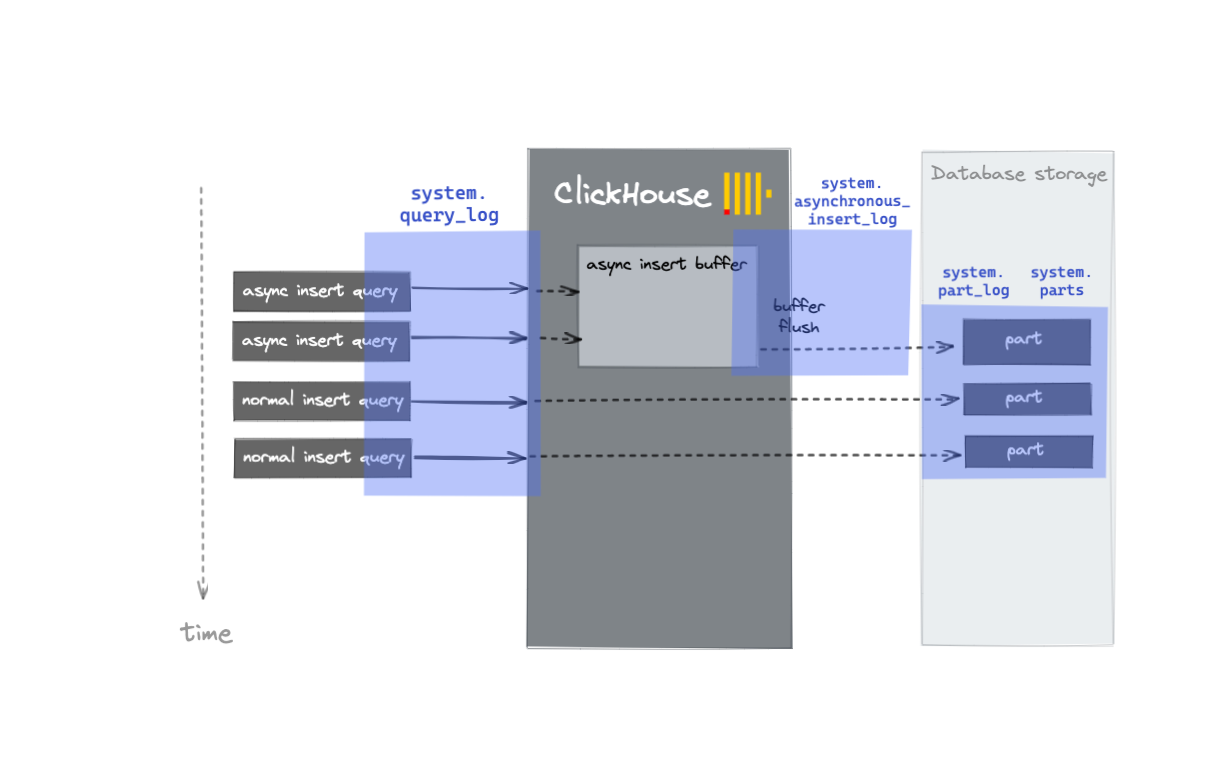
When using async_insert, new parts are not created after each INSERT SQL query, but when either the setting async_insert_busy_timeout_ms or async_insert_max_data_size is exceeded - these settings control the flushing of a buffer.
This process writes to a number of useful log tables with the system database. The insert process is visualized below, with an indication of the relevant log file at each stage.
We can use the query below to review how many (and how often) new parts are created during the last two hours.
SELECT
    count() AS new_parts,
    toStartOfMinute(event_time) AS modification_time_m,
    table,
    sum(rows) AS total_written_rows,
    formatReadableSize(sum(size_in_bytes)) AS total_bytes_on_disk
FROM clusterAllReplicas(default, system.part_log)
WHERE (event_type = 'NewPart') AND (event_time > (now() - toIntervalHour(2)))
GROUP BY
    modification_time_m,
    table
ORDER BY
    modification_time_m ASC,
    table DESC

This first query also applies to synchronous inserts.
We can also use the system.asynchronous_insert_log table to review each async insert's status. The result of the following query is ordered by flush_time with the results allowing us to determine when the data was inserted (multiple lines can belong to the same flush, you can group by flush_query_id in order to have one line per flush).
SELECT
    event_time,
    query,
    database,
    table,
    bytes,
    status,
    flush_time
FROM clusterAllReplicas(default, system.asynchronous_insert_log)
ORDER BY flush_time DESC

Monitoring Synchronous Inserts #
While in most cases, asynchronous inserts are the most practical means of inserting data, users may not be using this approach if they can batch their insert requests client-side or are performing a bulk load.
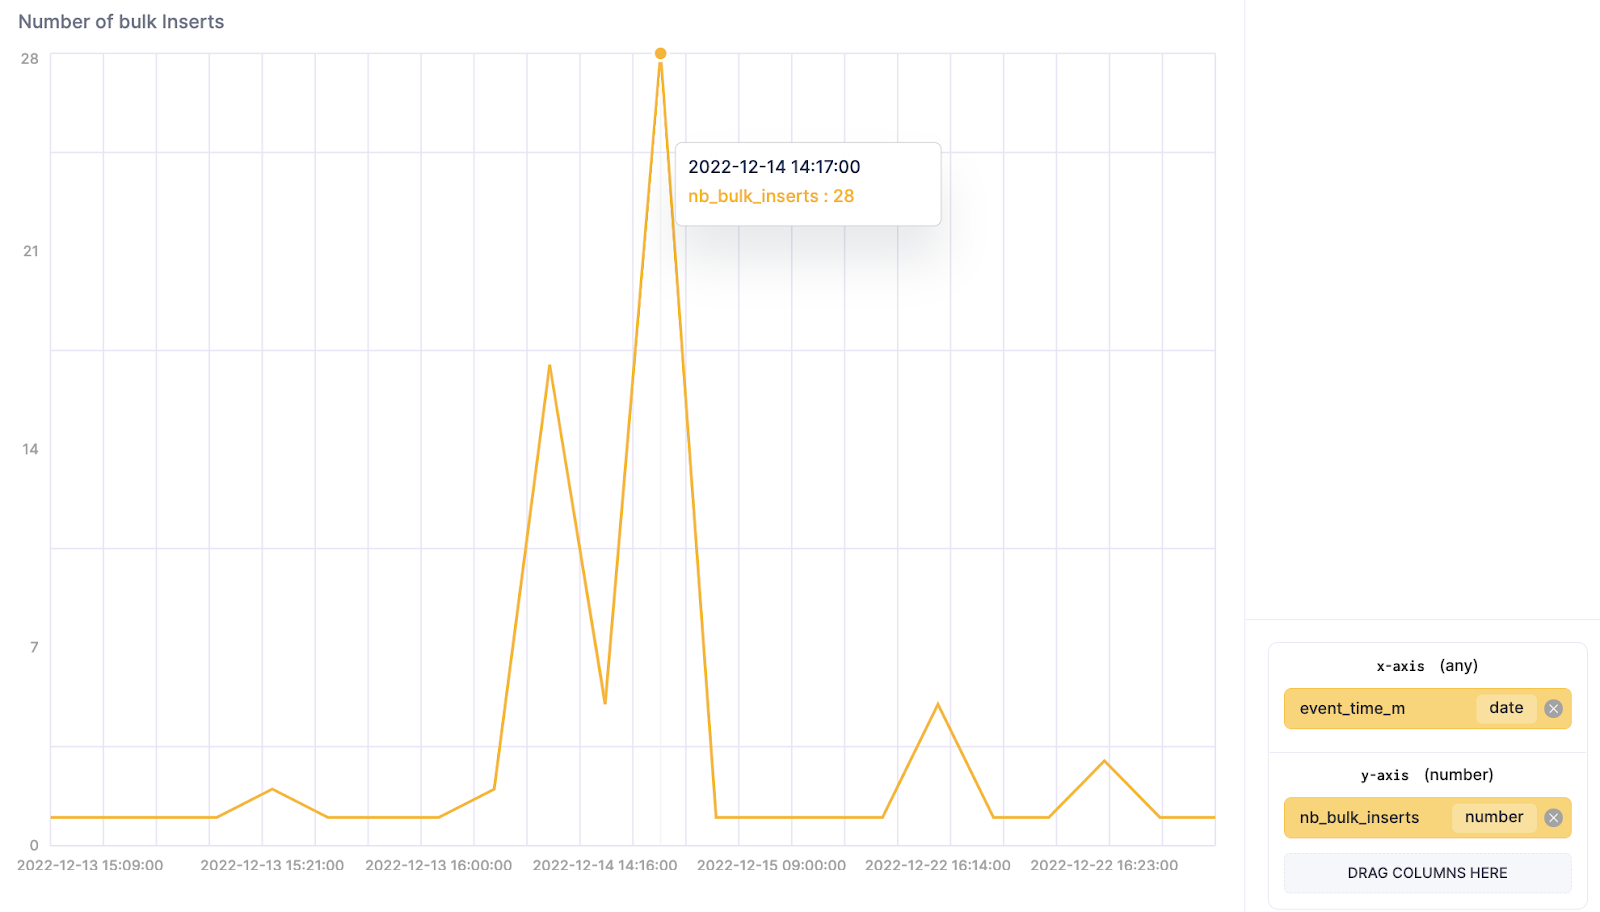
For synchronous inserts, in addition to watching the number of new parts created, users should monitor the number of insert bulk requests that have been processed and the total written rows. There should be a big difference between these metrics. If not, this means you are inserting a small number of rows on each INSERT SQL request which can produce errors such as DB::Exception: Too many parts.
We will use two different system tables to collect these two metrics.
- The table
system.query_logswill provide us with the metric about how many Insert bulk requests have been processed by the ClickHouse service - specifically, for the query below, see the value ofnb_bulk_inserts.
SELECT
    toStartOfMinute(event_time) AS event_time_m,
    count(*) AS nb_bulk_inserts
FROM clusterAllReplicas(default, system.query_log)
WHERE (query ILIKE '%insert%') AND (query_kind = 'Insert') AND (type = 'QueryFinish') AND (NOT (Settings['async_insert']) = '1') AND (event_time > (now() - toIntervalDay(3)))
GROUP BY event_time_m
ORDER BY event_time_m ASC
- The
system.part_logtable provides the important statistic regarding the amount of data written. With this query we will be able to calculate thetotal_written_rows, andtotal_bytes_on_disk. This query will be mainly used for troubleshooting or tuning ingestion strategies.
SELECT
    toStartOfMinute(event_time) AS modification_time_m,
    table,
    sum(rows) AS total_written_rows,
    formatReadableSize(sum(size_in_bytes)) AS total_bytes_on_disk
FROM clusterAllReplicas(default, system.part_log)
WHERE (event_type = 'NewPart') AND (event_time > (now() - toIntervalDay(3)))
GROUP BY
    modification_time_m,
    table
ORDER BY
    modification_time_m ASC,
    table DESC
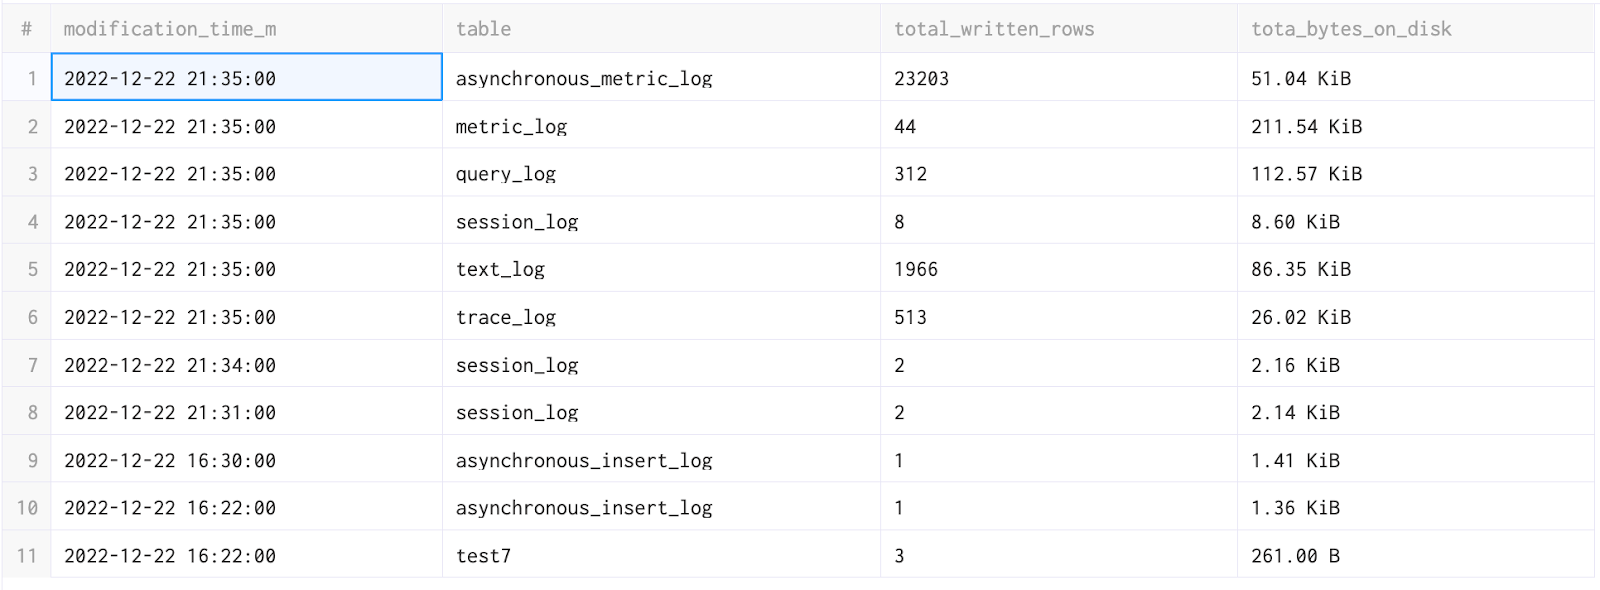
The previous queries will show you data for the last 3 days. Modify this to suit your ingestion rate e.g. a few hours from now (event_time > now() - toIntervalHour(2)).
Average INSERT query duration over time #
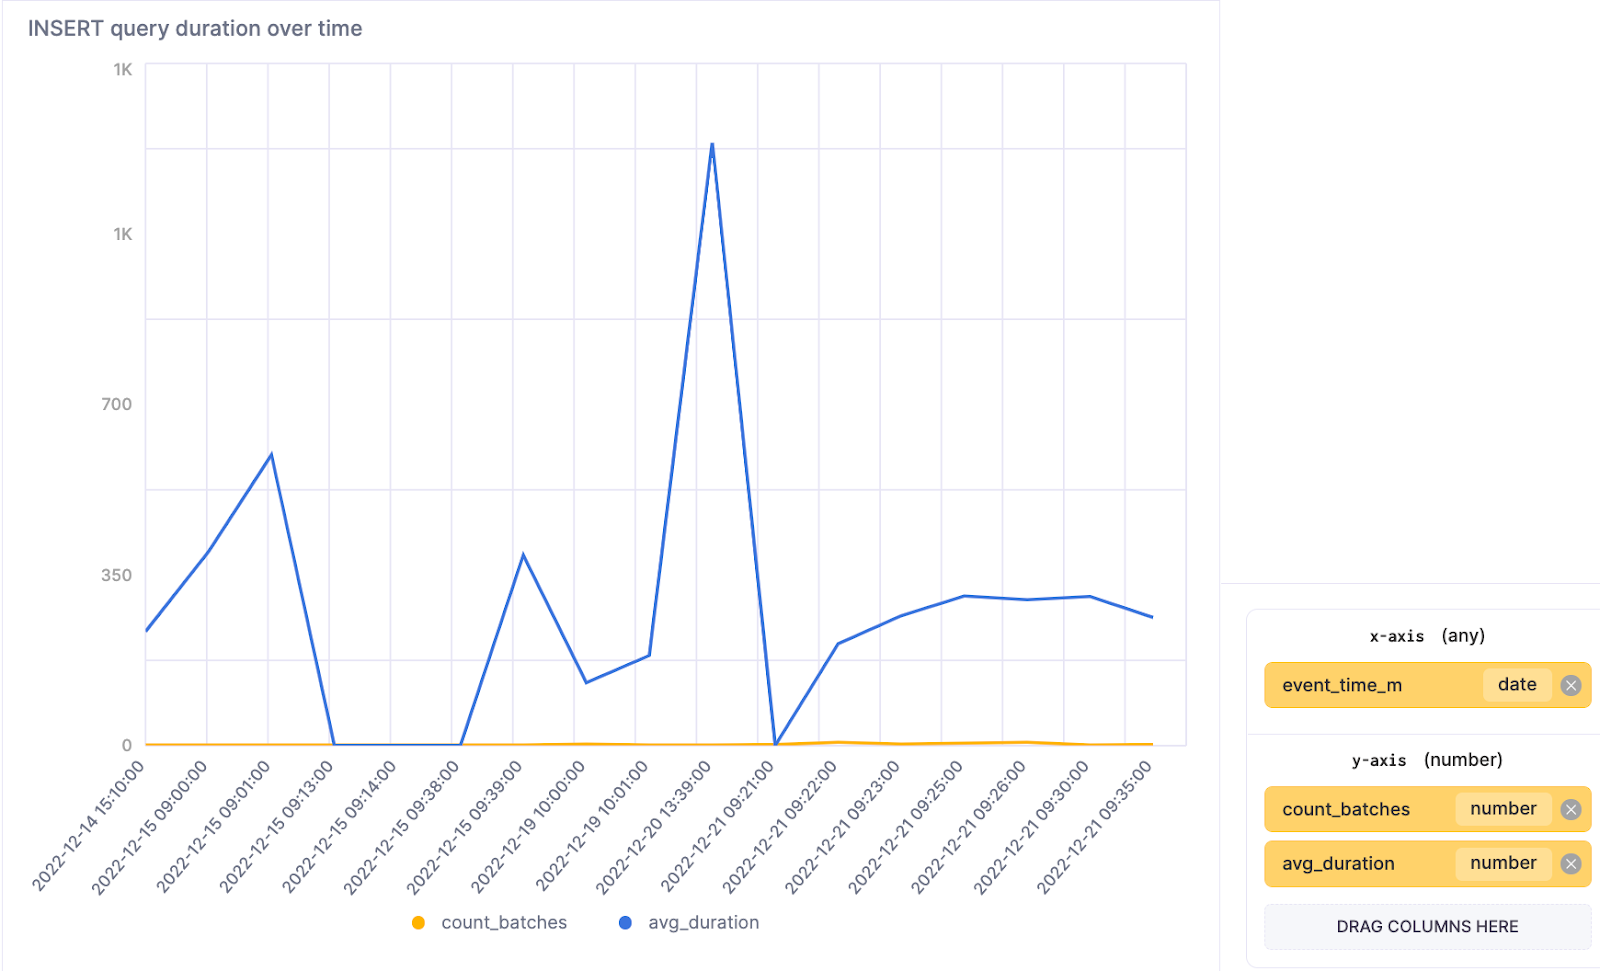
With this query, we aim to measure the performance of insert operations using the number of insert batches and the average duration that it took to complete them. By plotting this data, we can see how a ClickHouse service is performing for these operations. The relation between these two lines allows you to see bottlenecks in your system during periods of heavy load. These will be easier to correlate if all your batches have a consistent size.
This is again only applicable to synchronous inserts since the timing doesn’t capture the entire event for an asynchronous operation - rather just the buffering stage.
SELECT
    toStartOfMinute(event_time) AS event_time_m,
    count() AS count_batches,
    avg(query_duration_ms) AS avg_duration
FROM clusterAllReplicas(default, system.query_log)
WHERE (query_kind = 'Insert') AND (type != 'QueryStart') AND (event_time > (now() - toIntervalDay(2)))
GROUP BY event_time_m
ORDER BY event_time_m ASC
As an alternative to computing the mean, ClickHouse offers the ability to calculate medians via the function quantiles. The new query thus becomes:
SELECT
    toStartOfHour(event_time) AS event_time_h,
    count() AS count_batches,
    quantile(0.25)(query_duration_ms),
    quantile(0.5)(query_duration_ms),
    quantile(0.75)(query_duration_ms),
    quantile(0.95)(query_duration_ms),
    quantile(0.99)(query_duration_ms)
FROM clusterAllReplicas(default, system.query_log)
WHERE (query_kind = 'Insert') AND (type != 'QueryStart') AND (event_time > (now() - toIntervalDay(2)))
GROUP BY event_time_h
ORDER BY event_time_h ASC
Limitation: This information does not reflect the accurate data for async_insert or the Buffer engine.
Memory and CPU usage for Inserts #
To understand the resource consumption of our inserts, we need to go a little deeper. The following query returns the memory and CPU usage for each insert operation. These results allow you to see, for each batch, the amount of resources needed. This can be used to adjust either your service size or throughput.
Again note that this only applies to synchronous inserts.
SELECT
    event_time,
    formatReadableSize(memory_usage) AS memory,
    ProfileEvents['UserTimeMicroseconds'] AS userCPU,
    ProfileEvents['SystemTimeMicroseconds'] AS systemCPU,
    replaceRegexpAll(query, CHAR(10), ''),
    initial_query_id
FROM clusterAllReplicas(default, system.query_log)
WHERE (query_kind = 'Insert') AND (type = 'QueryFinish')
ORDER BY memory_usage DESC
LIMIT 10
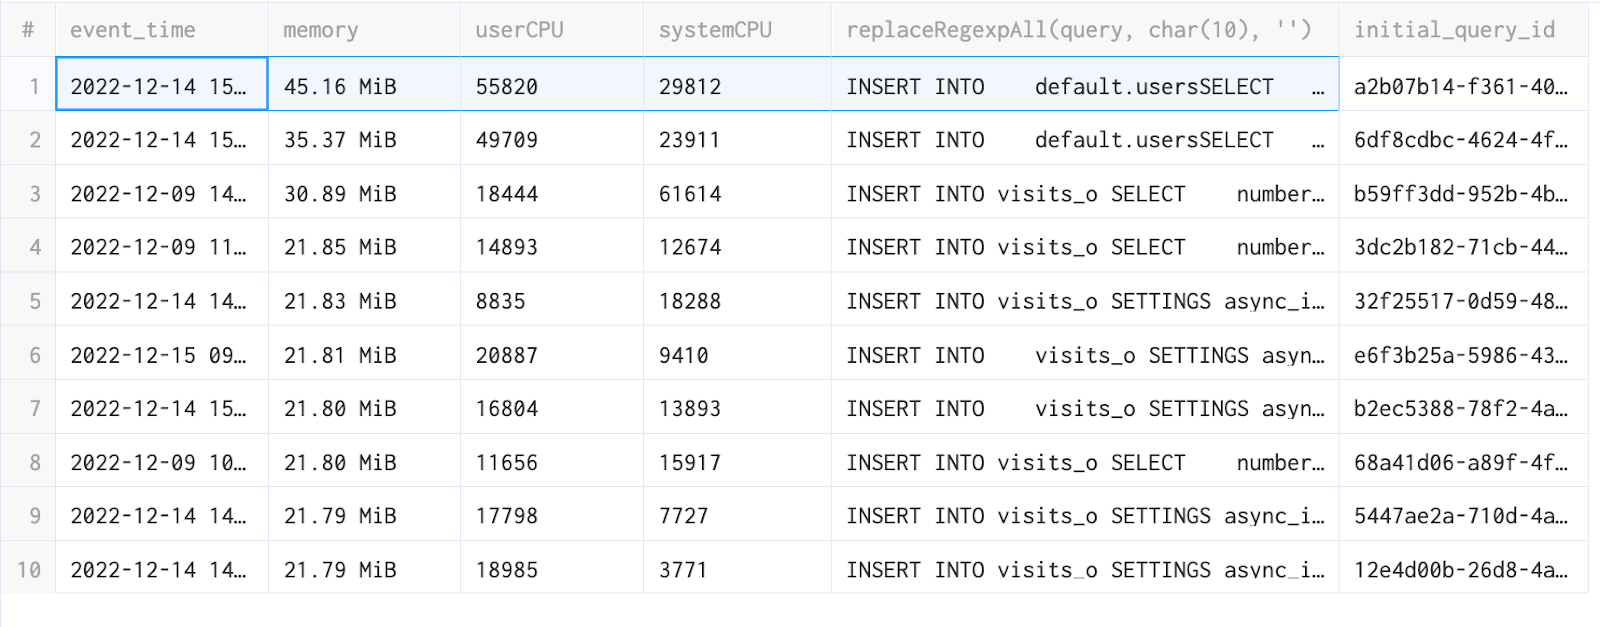
Limitation: This information does not reflect the accurate data for async_insert or the Buffer engine.
Parts and Partitions #
Now that we have a high-level idea about how much data we are ingesting, we can go behind the scenes and learn more about partitions and parts to understand the behavior of our insert operations more deeply.
Let’s start with a definition for both of these terms:
A partition in ClickHouse is an internal split of your data by a field value. Each partition is stored separately to simplify the manipulations of this data. A great example of this is partitioning by month. This will cause the data for each month to be stored in the same partition. This partition information will be captured in the folder name, allowing parts associated with a partition to be identified quickly on disk. This simplifies implementing TTL rules and accelerates SELECT queries when reading a specific month (note it can also slow queries down if querying multiple months).
Here we will extract the month for the VisitDate column and partition our table by the resulting values.
CREATE TABLE visits
(
   VisitDate Date,
   Hour UInt8,
   ClientID UUID
)
ENGINE = MergeTree()
PARTITION BY toYYYYMM(VisitDate)
ORDER BY Hour;
You can read more about Partitions here.
Parts are the chunks associated with each partition. When data is inserted into a table, separate data parts are created, and each of them is lexicographically sorted by the primary key. The primary key allows the part to be efficiently scanned. However, if you have too many parts, then SELECT queries will be slow due to the need to evaluate more indices and read more files.
The common Too many parts issue can be the result of several causes, including:
- Partition key with excessive cardinality,
- Many small inserts,
- Excessive materialized views.
If you are interested to know more about this issue, please review the blog post Getting started with ClickHouse? Here are 13 Deadly Sins and how to avoid them.
Now let’s imagine you are a DevOps engineer. You want to first have a global perspective before digging into specific databases or tables. In this case, you need one query to tell you if you have any hot spots in your partitions and parts.
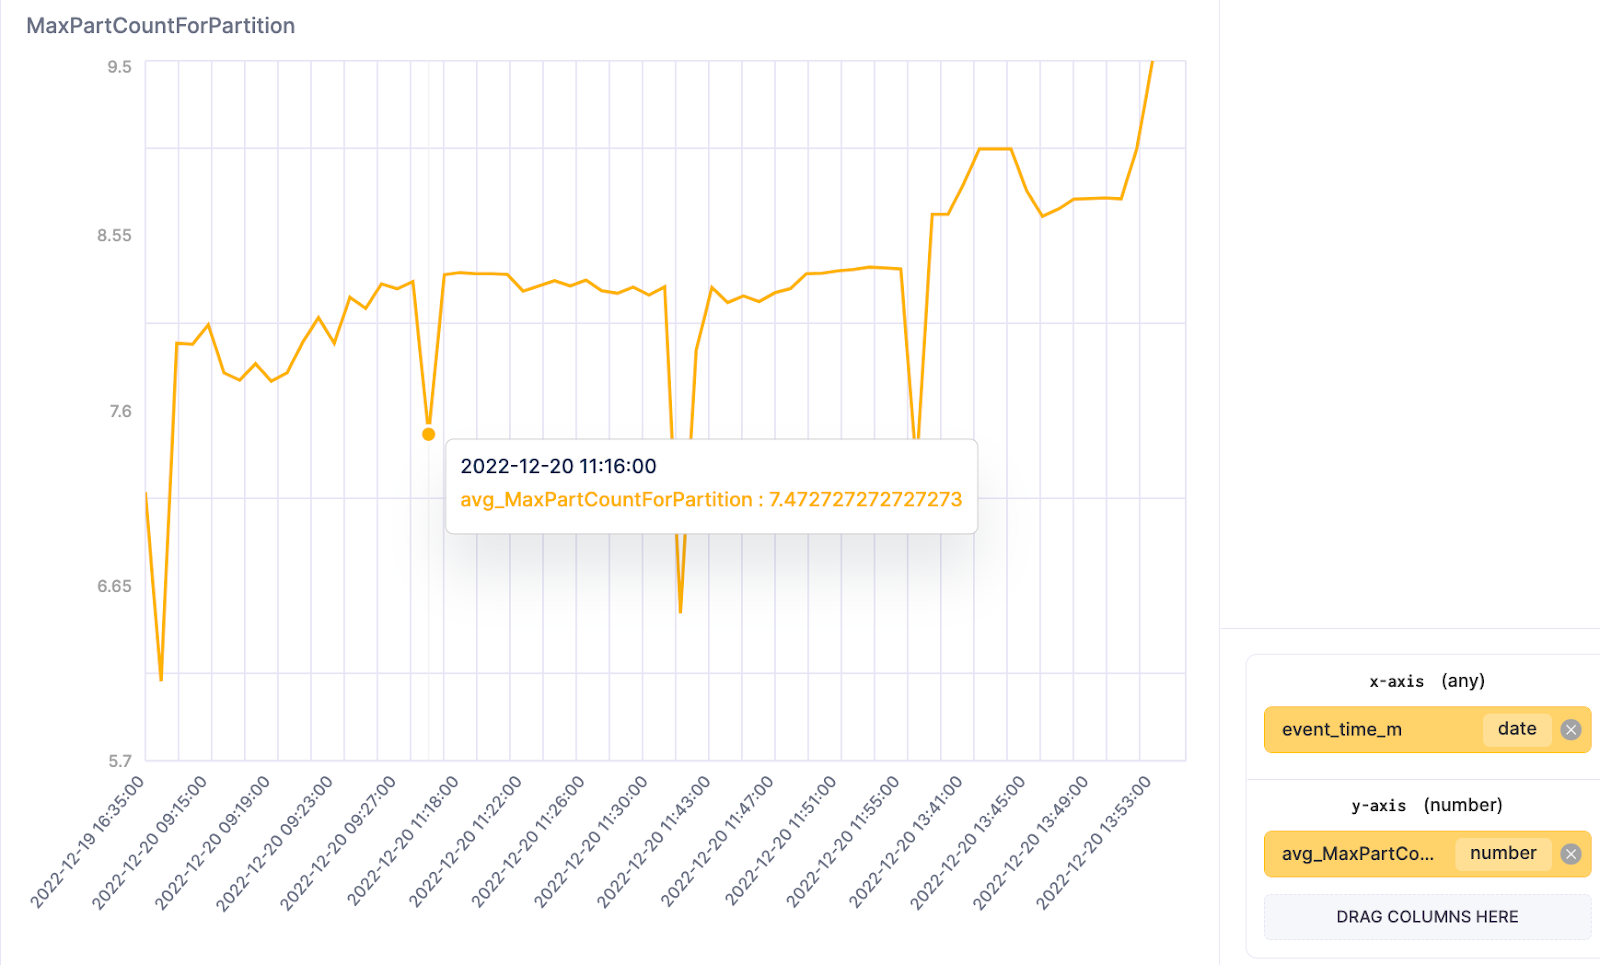
The following query produces a MaxPartCountForPartition value showing your current highest number of parts per partition. If this key metric begins to exceed your normal trend line, you will need to identify the responsible table to reduce its number of parts.
SELECT
    toStartOfMinute(event_time) AS event_time_m,
    avg(value) AS avg_MaxPartCountForPartition
FROM clusterAllReplicas(default, system.asynchronous_metric_log)
WHERE (event_time > (now() - toIntervalDay(1))) AND (metric = 'MaxPartCountForPartition')
GROUP BY event_time_m
ORDER BY event_time_m ASC
Parts per partition #
Suppose the previous query has identified a potential issue. In that case, the following allows you to dig deeper and determine the number of partitions per database table and the number of parts in each partition. Remember that while Clickhouse internally merges parts, too many parts will result in more merge pressure in an attempt to keep the number of parts low. This consumes resources and potentially results in the error highlighted above.
SELECT
    concat(database, '.', table) AS table,
    count() AS parts_per_partition,
    partition_id
FROM clusterAllReplicas(default, system.parts)
WHERE active AND (database != 'system')
GROUP BY
    database,
    table,
    partition_id
HAVING parts_per_partition > 1
ORDER BY parts_per_partition DESC
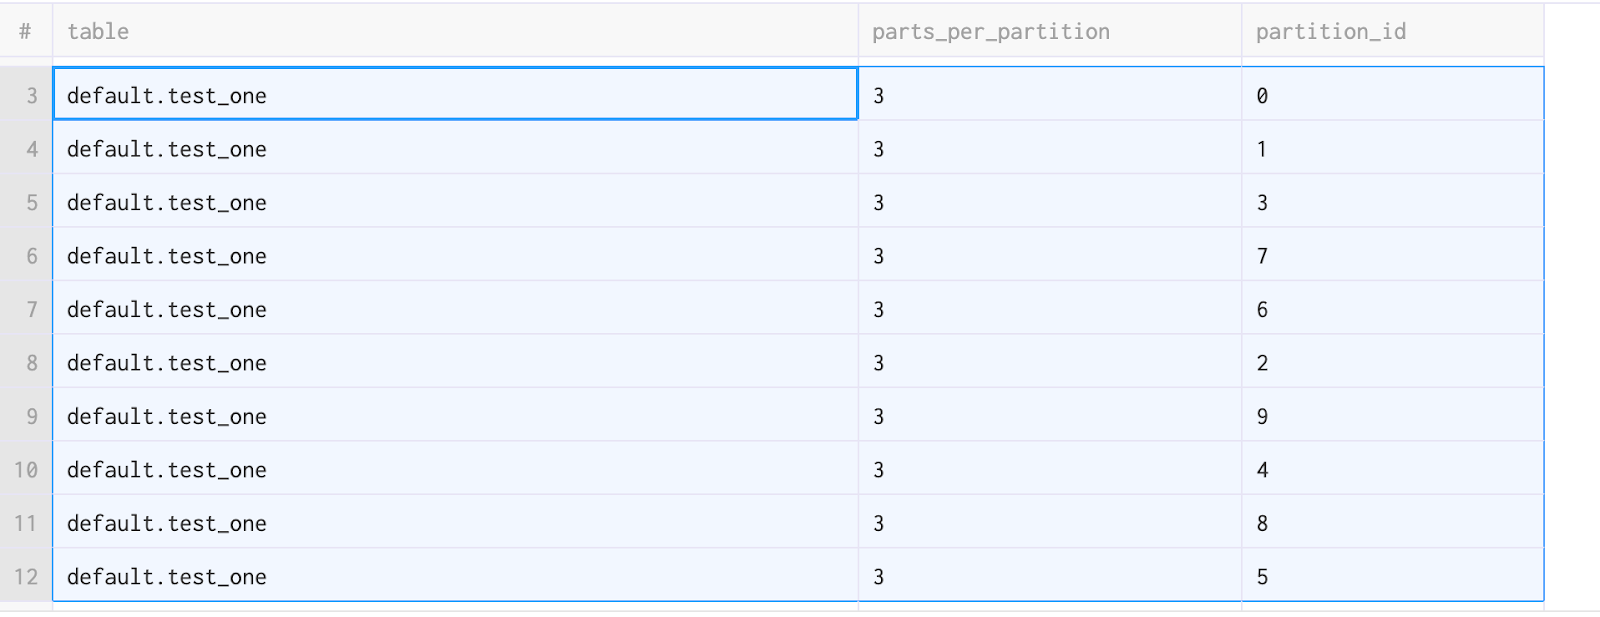
Now that we know which parts and partitions have issues, it is useful to review the peak usage of memory this part has consumed.
SELECT
   event_date,
   argMax(table, peak_memory_usage) AS table,
   argMax(event_time, peak_memory_usage) AS event_time,
   formatReadableSize(MAX(peak_memory_usage)) AS max_peak_memory_usage
FROM
   clusterAllReplicas(default, system.part_log)
WHERE
   peak_memory_usage > 0
GROUP BY
   event_date
ORDER BY
   event_date DESC

Errors in data parts #
The system.part_log table contains all information on the life of a part as a series of events. The event_type column can categorize these events:
NEW_PART- Inserting of a new data part.MERGE_PARTS- Merging of data parts.DOWNLOAD_PART- Downloading a data part.REMOVE_PART- Removing or detaching a data part using DETACH PARTITION.MUTATE_PART- Mutating of a data part.MOVE_PART- Moving the data part from one disk to another one.
The error column captures the success of the execution of each event. The query below will filter and collect only the part events with errors. Using the response, we can see the attempted action, the table's name, and the error's cause.
SELECT
    event_date,
    event_type,
    table,
    error,
    errorCodeToName(error) AS error_code,
    COUNT()
FROM clusterAllReplicas(default, system.part_log)
WHERE (database = 'default') AND (error > 0)
GROUP BY
    event_date,
    event_type,
    error,
    error_code,
    table
In the specific example below, we can see that when a NewPart was created on the tables visits and visits_o, we had deduplicated inserts, prompting us to review our ingest code for why are we sending the same data multiple times.
You could have different errors and different event_types. Feel free to create a case in the ClickHouse Cloud portal if you have any questions about these errors.

Conclusion #
In this blog post we have shown some of the most important queries for monitoring your INSERT operations. We recommend proactively monitoring the results of these queries and alerting if the behavior is usual, potentially using tools such as Grafana which has a mature ClickHouse integration and supports alerting. In next post in this series, we will examine how to monitor your SELECT queries and identify issues early before they are escalated by your users.


