Get started with ClickHouse Cloud today and receive $300 in credits. To learn more about our volume-based discounts, contact us or visit our pricing page.

This blog post is part of a series:
- Join Types supported in ClickHouse
- ClickHouse Joins Under the Hood - Hash Join, Parallel Hash Join, Grace Hash Join
- ClickHouse Joins Under the Hood - Direct Join
- Choosing the Right Join Algorithm
With our previous post we started the exploration of the 6 different join algorithms that have been developed for ClickHouse. As a reminder: These algorithms dictate the manner in which a join query is planned and executed. ClickHouse can be configured to adaptively choose and dynamically change the join algorithm to use at runtime. Depending on resource availability and usage. However, ClickHouse also allows users to specify the desired join algorithm themselves. This chart gives an overview of these algorithms based on their relative memory consumption and execution time:
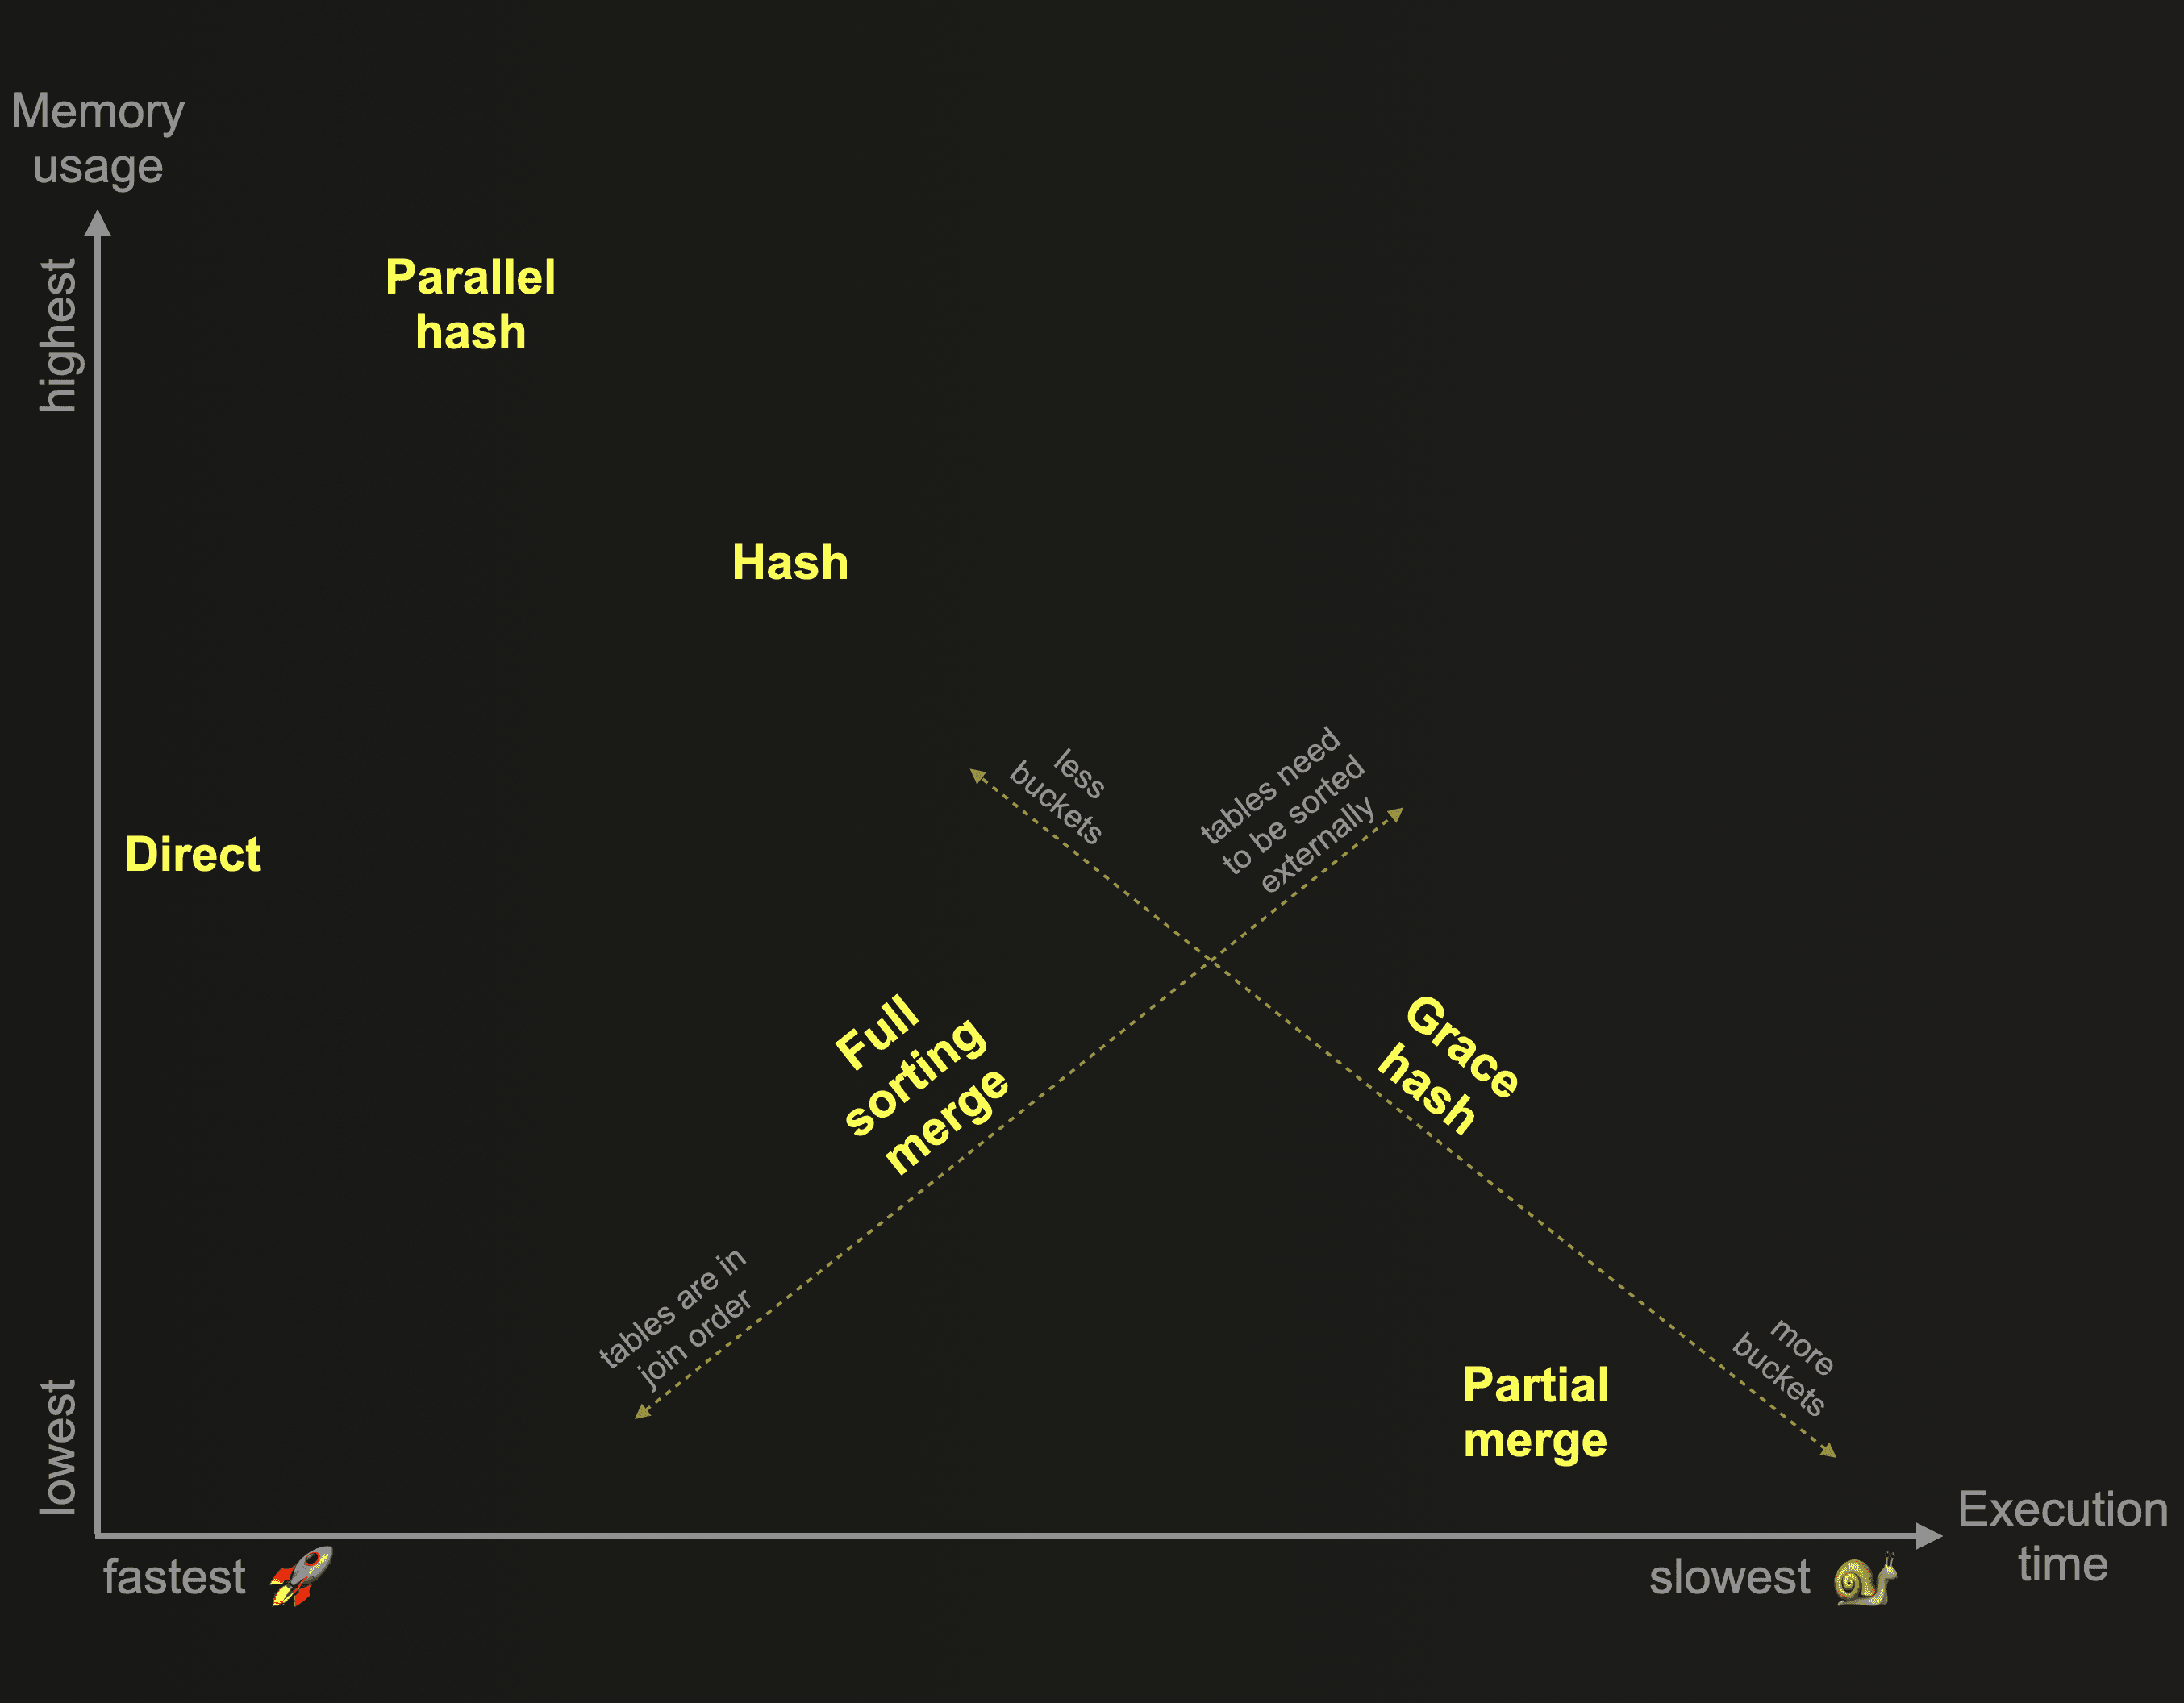
In our previous post, we described and compared in detail the three ClickHouse join algorithms from the chart above that are based on in-memory hash tables:
As a reminder: Hash join and parallel hash join are fast but memory-bound. The joined data from the right-hand side table needs to fit into memory. Grace hash join is a non-memory bound version that spills data temporarily to disk, without requiring any sorting of the data, and therefore overcomes some of the performance challenges of other join algorithms that spill data to disk and require prior sorting of the data. Which brings us to this post.
We’ll continue the exploration of the ClickHouse join algorithms in this post and describe the two algorithms from the chart above that are based on external sorting:
Both algorithms are non-memory bound and use a join strategy that requires the joined data to first be sorted in order of the join keys before join matches can be identified.
With the full sorting merge join the rows from both tables are then joined by interleaved linear scans and merges of the sorted streams of blocks of rows from both tables:
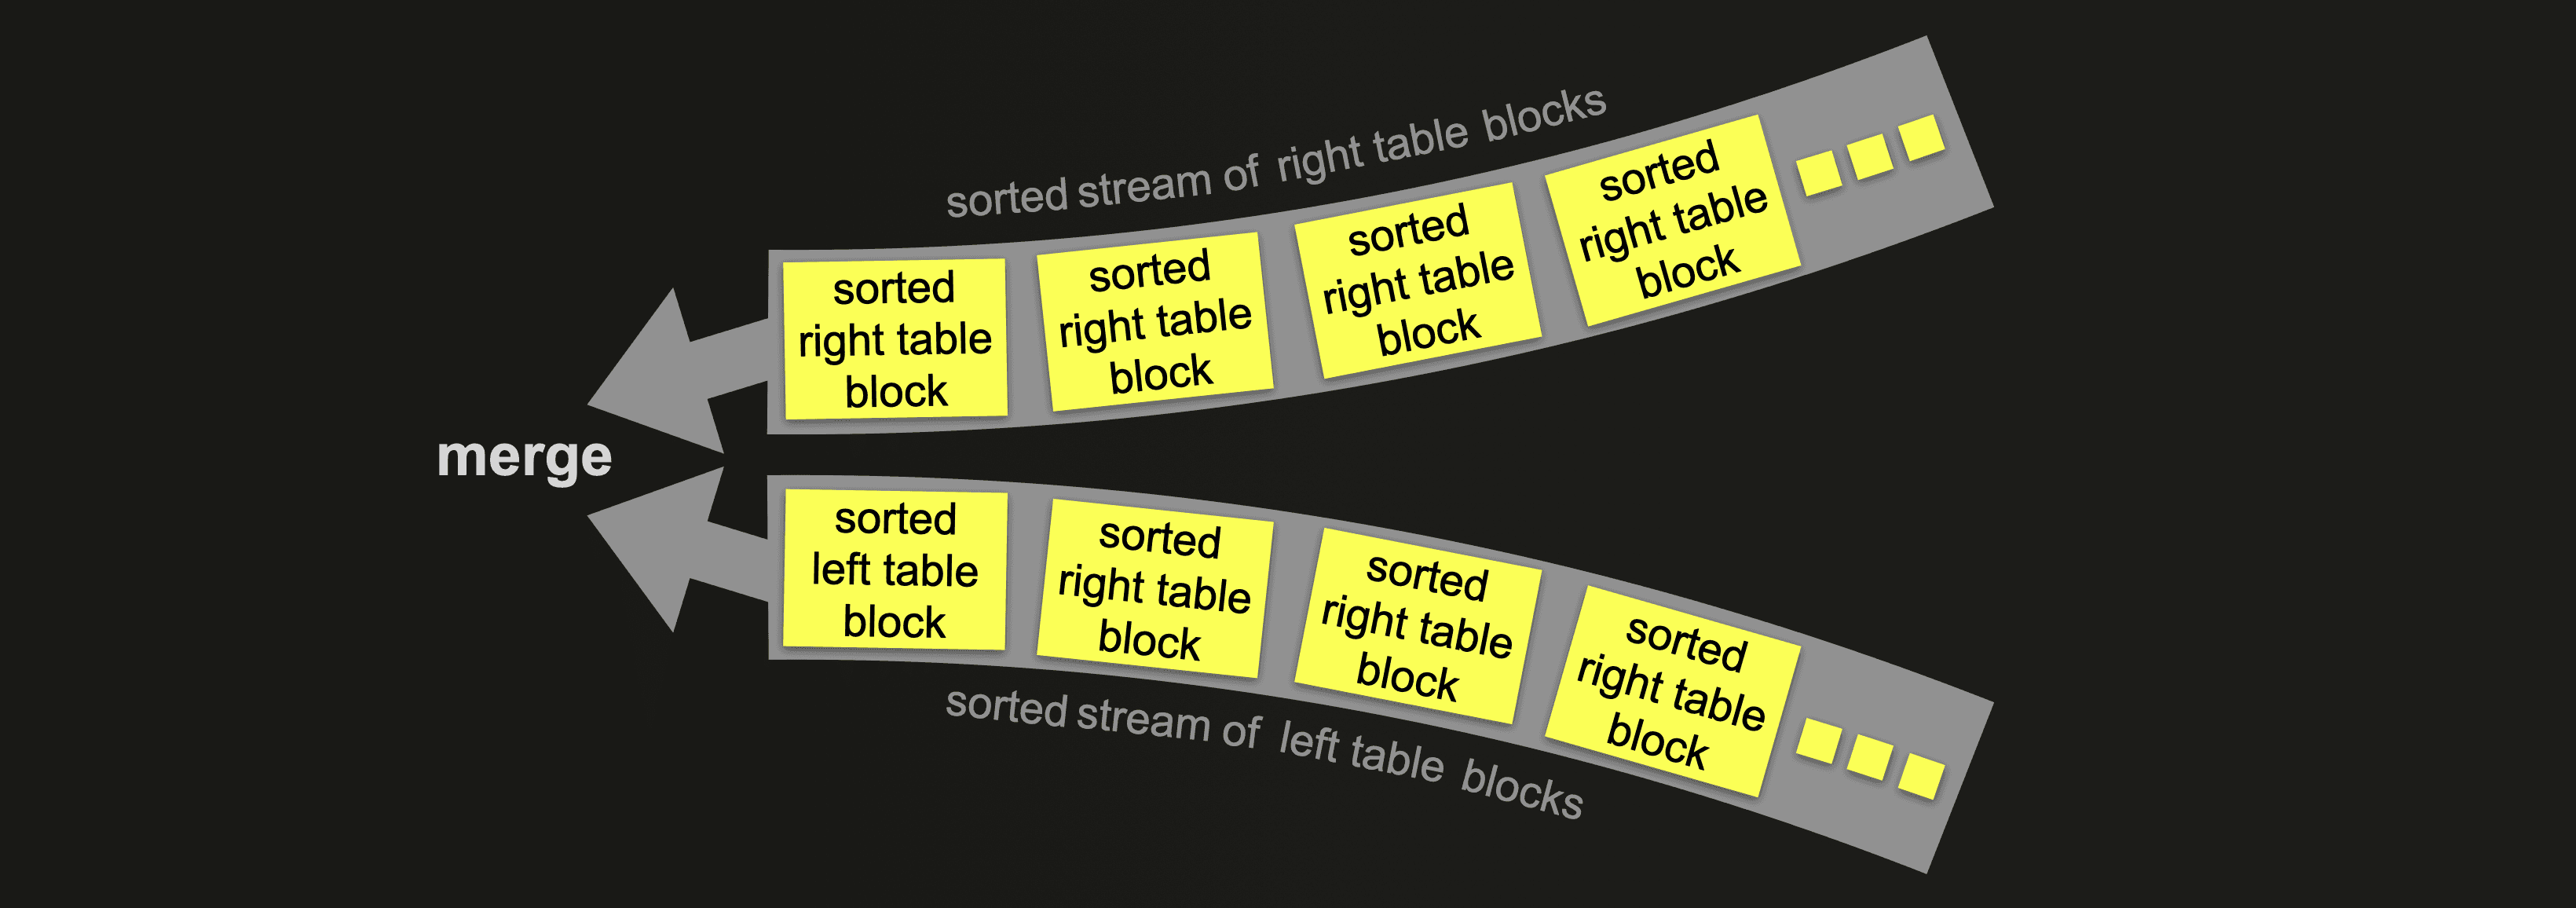
With the partial merge join the rows from both tables are join matched by merging each sorted block of rows from the left table with the sorted blocks of rows from the right table:

The full sorting merge join can take advantage of the physical row order of one or both tables, allowing sorting to be skipped. In such cases, the join performance can be competitive with the hash join algorithms from the chart above, while generally requiring significantly less memory. Otherwise, the full sorting merge join needs to fully sort the rows of the tables prior to identifying join matches. The sorting can take place in memory (if the data fits in) or externally on disk.
The partial merge join is optimized for minimizing memory usage when large tables are joined. The right table is always fully sorted first via external sorting. In order to minimize the amount of data being processed in-memory when join matches are identified, special index structures are created on disk. The left table is always sorted block by block in-memory. But if the physical row order of the left table matches the join key sort order, then the in-memory identification of join matches is more efficient.
We will finish our exploration of the ClickHouse join algorithms in the next post where we will describe ClickHouse’s fastest join algorithm from the chart above:
Test Setup #
We are using the same two tables and ClickHouse Cloud service instance that we introduced in the previous post.
For all example query runs we use the default setting of max_threads. The node executing the queries has 30 CPU cores and therefore a default max_threads setting of 30. For all query pipeline visualizations, in order to keep them succinct and readable, we artificially limit the level of parallelism used within the ClickHouse query pipeline with the setting max_threads = 2.
Let’s now continue exploring ClickHouse join algorithms.
Full sorting merge join #
Description #
The full sorting merge join algorithm is the classical sort-merge join integrated into the ClickHouse query pipeline.
The ClickHouse version of the sort-merge join provides several performance optimizations.
- The joined tables can be filtered by each other's join keys prior to any sort and merge operations, in order to minimize the amount of processed data.
- And if the physical row order of one or both tables matches the join key sort order, then the sorting phase will be skipped for the corresponding table(s).
We will discuss these optimizations in detail later.
The following diagram shows the general version of the full sorting merge join algorithm without any optimization applied:
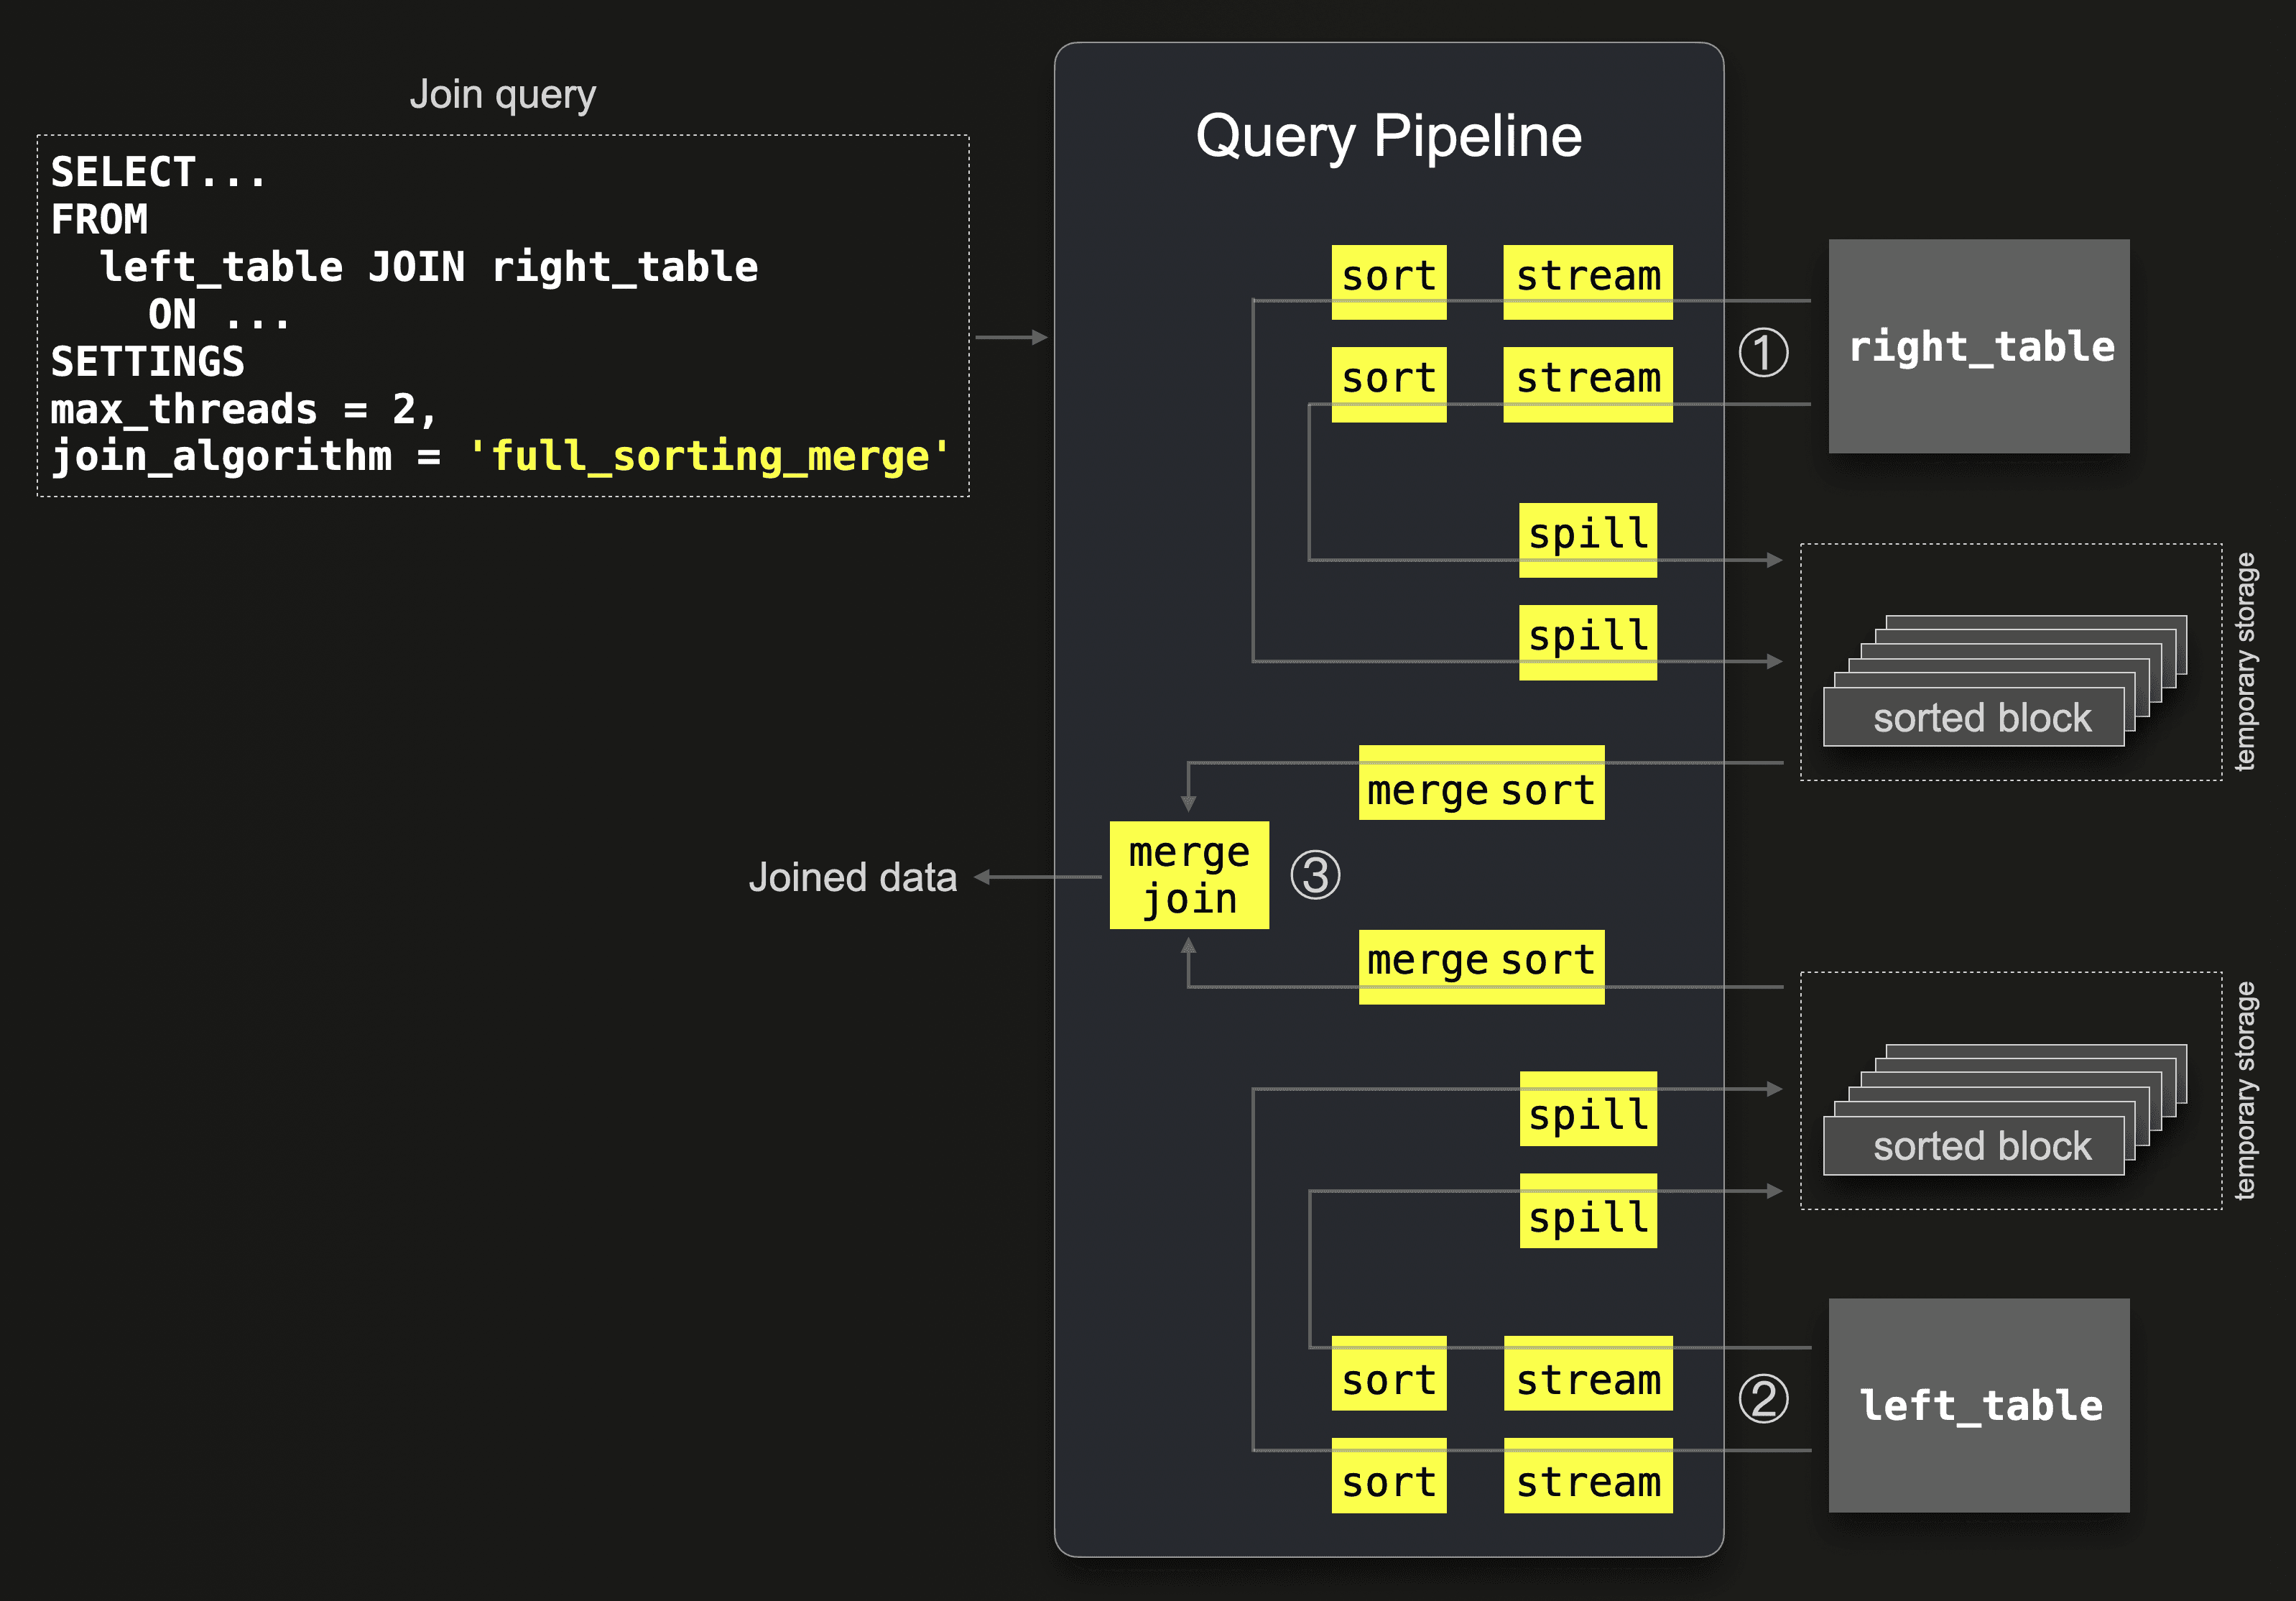
① All data from the right table are streamed block-wise in parallel by 2 stream stages (because max_threads = 2) into memory. Two parallel sort stages sort the rows within each streamed block by the join key column values. These sorted blocks are spilled to temporary storage by two parallel spill stages.
② Concurrently to ①, all data from the left table is streamed block-wise in parallel by 2 threads ( max_threads = 2), and similar to ①, each block is sorted and spilled to disk.
③ With one stream per table, the sorted blocks are read from disk and merge-sorted, with join matches identified by merging (interleaved scanning) the two sorted streams.
Supported join types #
INNER, LEFT, RIGHT, and FULL join types for ALL and ANY strictness are supported.
Examples #
In order to first demonstrate the general version of the full sorting merge join algorithm without any optimizations applied, we use a join query that finds all actors whose first names are used as role names in movies. With the max_rows_in_set_to_optimize_join=0 setting, we disable the optimization that filters the joined tables by each others join keys before joining:
SELECT *
FROM actors AS a
JOIN roles AS r ON a.first_name = r.role
FORMAT `Null`
SETTINGS join_algorithm = 'full_sorting_merge', max_rows_in_set_to_optimize_join = 0;

0 rows in set. Elapsed: 11.559 sec. Processed 101.00 million rows, 3.67 GB (8.74 million rows/s., 317.15 MB/s.)
As usual, we can query the query_log system table in order to check runtime statistics for the last query run. Note that we use some keys from the ProfileEvents column in order to check the amount of data spilled to disk by external sorting during join processing:
SELECT
    query,
    formatReadableTimeDelta(query_duration_ms / 1000) AS query_duration,
    formatReadableSize(memory_usage) AS memory_usage,
    formatReadableQuantity(read_rows) AS read_rows,
    formatReadableSize(read_bytes) AS read_data,
    formatReadableSize(ProfileEvents['ExternalProcessingUncompressedBytesTotal']) AS data_spilled_to_disk_uncompressed,
    formatReadableSize(ProfileEvents['ExternalProcessingCompressedBytesTotal']) AS data_spilled_to_disk_compressed
FROM clusterAllReplicas(default, system.query_log)
WHERE (type = 'QueryFinish') AND hasAll(tables, ['imdb_large.actors', 'imdb_large.roles'])
ORDER BY initial_query_start_time DESC
LIMIT 1
FORMAT Vertical;


Row 1:
──────
query:                             SELECT *
                                   FROM actors AS a
                                   JOIN roles AS r ON a.first_name = r.role
                                   FORMAT `Null`
                                   SETTINGS join_algorithm = 'full_sorting_merge',
                                   max_rows_in_set_to_optimize_join = 0;
query_duration:                    11 seconds
memory_usage:                      4.71 GiB
read_rows:                         101.00 million
read_data:                         3.41 GiB
data_spilled_to_disk_uncompressed: 0.00 B
data_spilled_to_disk_compressed:   0.00 B
We can see that ClickHouse didn’t spill any data to disk, and processed the join completely in-memory with a peak usage of 4.71 GiB.
The ClickHouse node executing the above query has 120 GiB of main memory available:
SELECT formatReadableSize(getSetting('max_memory_usage'));


┌─formatReadableSize(getSetting('max_memory_usage'))─┐
│ 120.00 GiB                                         │
└────────────────────────────────────────────────────┘
And ClickHouse is configured to use external sorting when the volume of data to sort reaches more than half of the available main memory:
SELECT formatReadableSize(getSetting('max_bytes_before_external_sort'));


┌─formatReadableSize(getSetting('max_bytes_before_external_sort'))─┐
│ 60.00 GiB                                                        │
└──────────────────────────────────────────────────────────────────┘
We trigger external sorting for the join example query from above by setting max_bytes_before_external_sort to a lower threshold with the query’s SETTINGS clause:
SELECT *
FROM actors AS a
JOIN roles AS r ON a.first_name = r.role
FORMAT `Null`
SETTINGS join_algorithm = 'full_sorting_merge', max_rows_in_set_to_optimize_join = 0, max_bytes_before_external_sort = '100M';


0 rows in set. Elapsed: 12.267 sec. Processed 132.92 million rows, 4.82 GB (10.84 million rows/s., 393.25 MB/s.)
We check runtime statistics for the last two join examples:
SELECT
    query,
    formatReadableTimeDelta(query_duration_ms / 1000) AS query_duration,
    formatReadableSize(memory_usage) AS memory_usage,
    formatReadableQuantity(read_rows) AS read_rows,
    formatReadableSize(read_bytes) AS read_data,
    formatReadableSize(ProfileEvents['ExternalProcessingUncompressedBytesTotal']) AS data_spilled_to_disk_uncompressed,
    formatReadableSize(ProfileEvents['ExternalProcessingCompressedBytesTotal']) AS data_spilled_to_disk_compressed
FROM clusterAllReplicas(default, system.query_log)
WHERE (type = 'QueryFinish') AND hasAll(tables, ['imdb_large.actors', 'imdb_large.roles'])
ORDER BY initial_query_start_time DESC
LIMIT 2
FORMAT Vertical;


Row 1:
──────
query:                             SELECT *
                                   FROM actors AS a
                                   JOIN roles AS r ON a.first_name = r.role
                                   FORMAT `Null`
                                   SETTINGS join_algorithm = 'full_sorting_merge',
                                   max_rows_in_set_to_optimize_join = 0,
                                   max_bytes_before_external_sort = '100M'
query_duration:                    12 seconds
memory_usage:                      3.49 GiB
read_rows:                         132.92 million
read_data:                         4.49 GiB
data_spilled_to_disk_uncompressed: 1.79 GiB
data_spilled_to_disk_compressed:   866.36 MiB

Row 2:
──────
query:                             SELECT *
                                   FROM actors AS a
                                   JOIN roles AS r ON a.first_name = r.role
                                   FORMAT `Null`
                                   SETTINGS join_algorithm = 'full_sorting_merge',
                                   max_rows_in_set_to_optimize_join = 0
query_duration:                    11 seconds
memory_usage:                      4.71 GiB
read_rows:                         101.00 million
read_data:                         3.41 GiB
data_spilled_to_disk_uncompressed: 0.00 B
data_spilled_to_disk_compressed:   0.00 B
We can see that for the query run with the lowered max_bytes_before_external_sort setting, less memory got used and data was spilled to disk indicating that external sorting was used.
Note that the read_rows metrics for this query is currently not precise for pipelines with external processing.
Query pipeline and trace logs #
As done in the previous part of this blog series, we can introspect the ClickHouse query pipeline for the example join query (with max_threads set to 2) by using the ClickHouse command line client (quick install instructions are here). We use the EXPLAIN statement for printing a graph of the query pipeline described in the DOT graph description language and use Graphviz dot for rendering the graph in pdf format:
clickhouse client --host ekyyw56ard.us-west-2.aws.clickhouse.cloud --secure --port 9440 --password <PASSWORD> --database=imdb_large --query "
EXPLAIN pipeline graph=1, compact=0
SELECT *
FROM actors AS a
JOIN roles AS r ON a.first_name = r.role
SETTINGS max_threads = 2, join_algorithm = 'full_sorting_merge', max_rows_in_set_to_optimize_join = 0
;" | dot -Tpdf > pipeline.pdf
We have annotated the pipeline with the same circled numbers used in the abstract diagram above, slightly simplified the names of the main stages, and added the two joined tables in order to align the two diagrams:
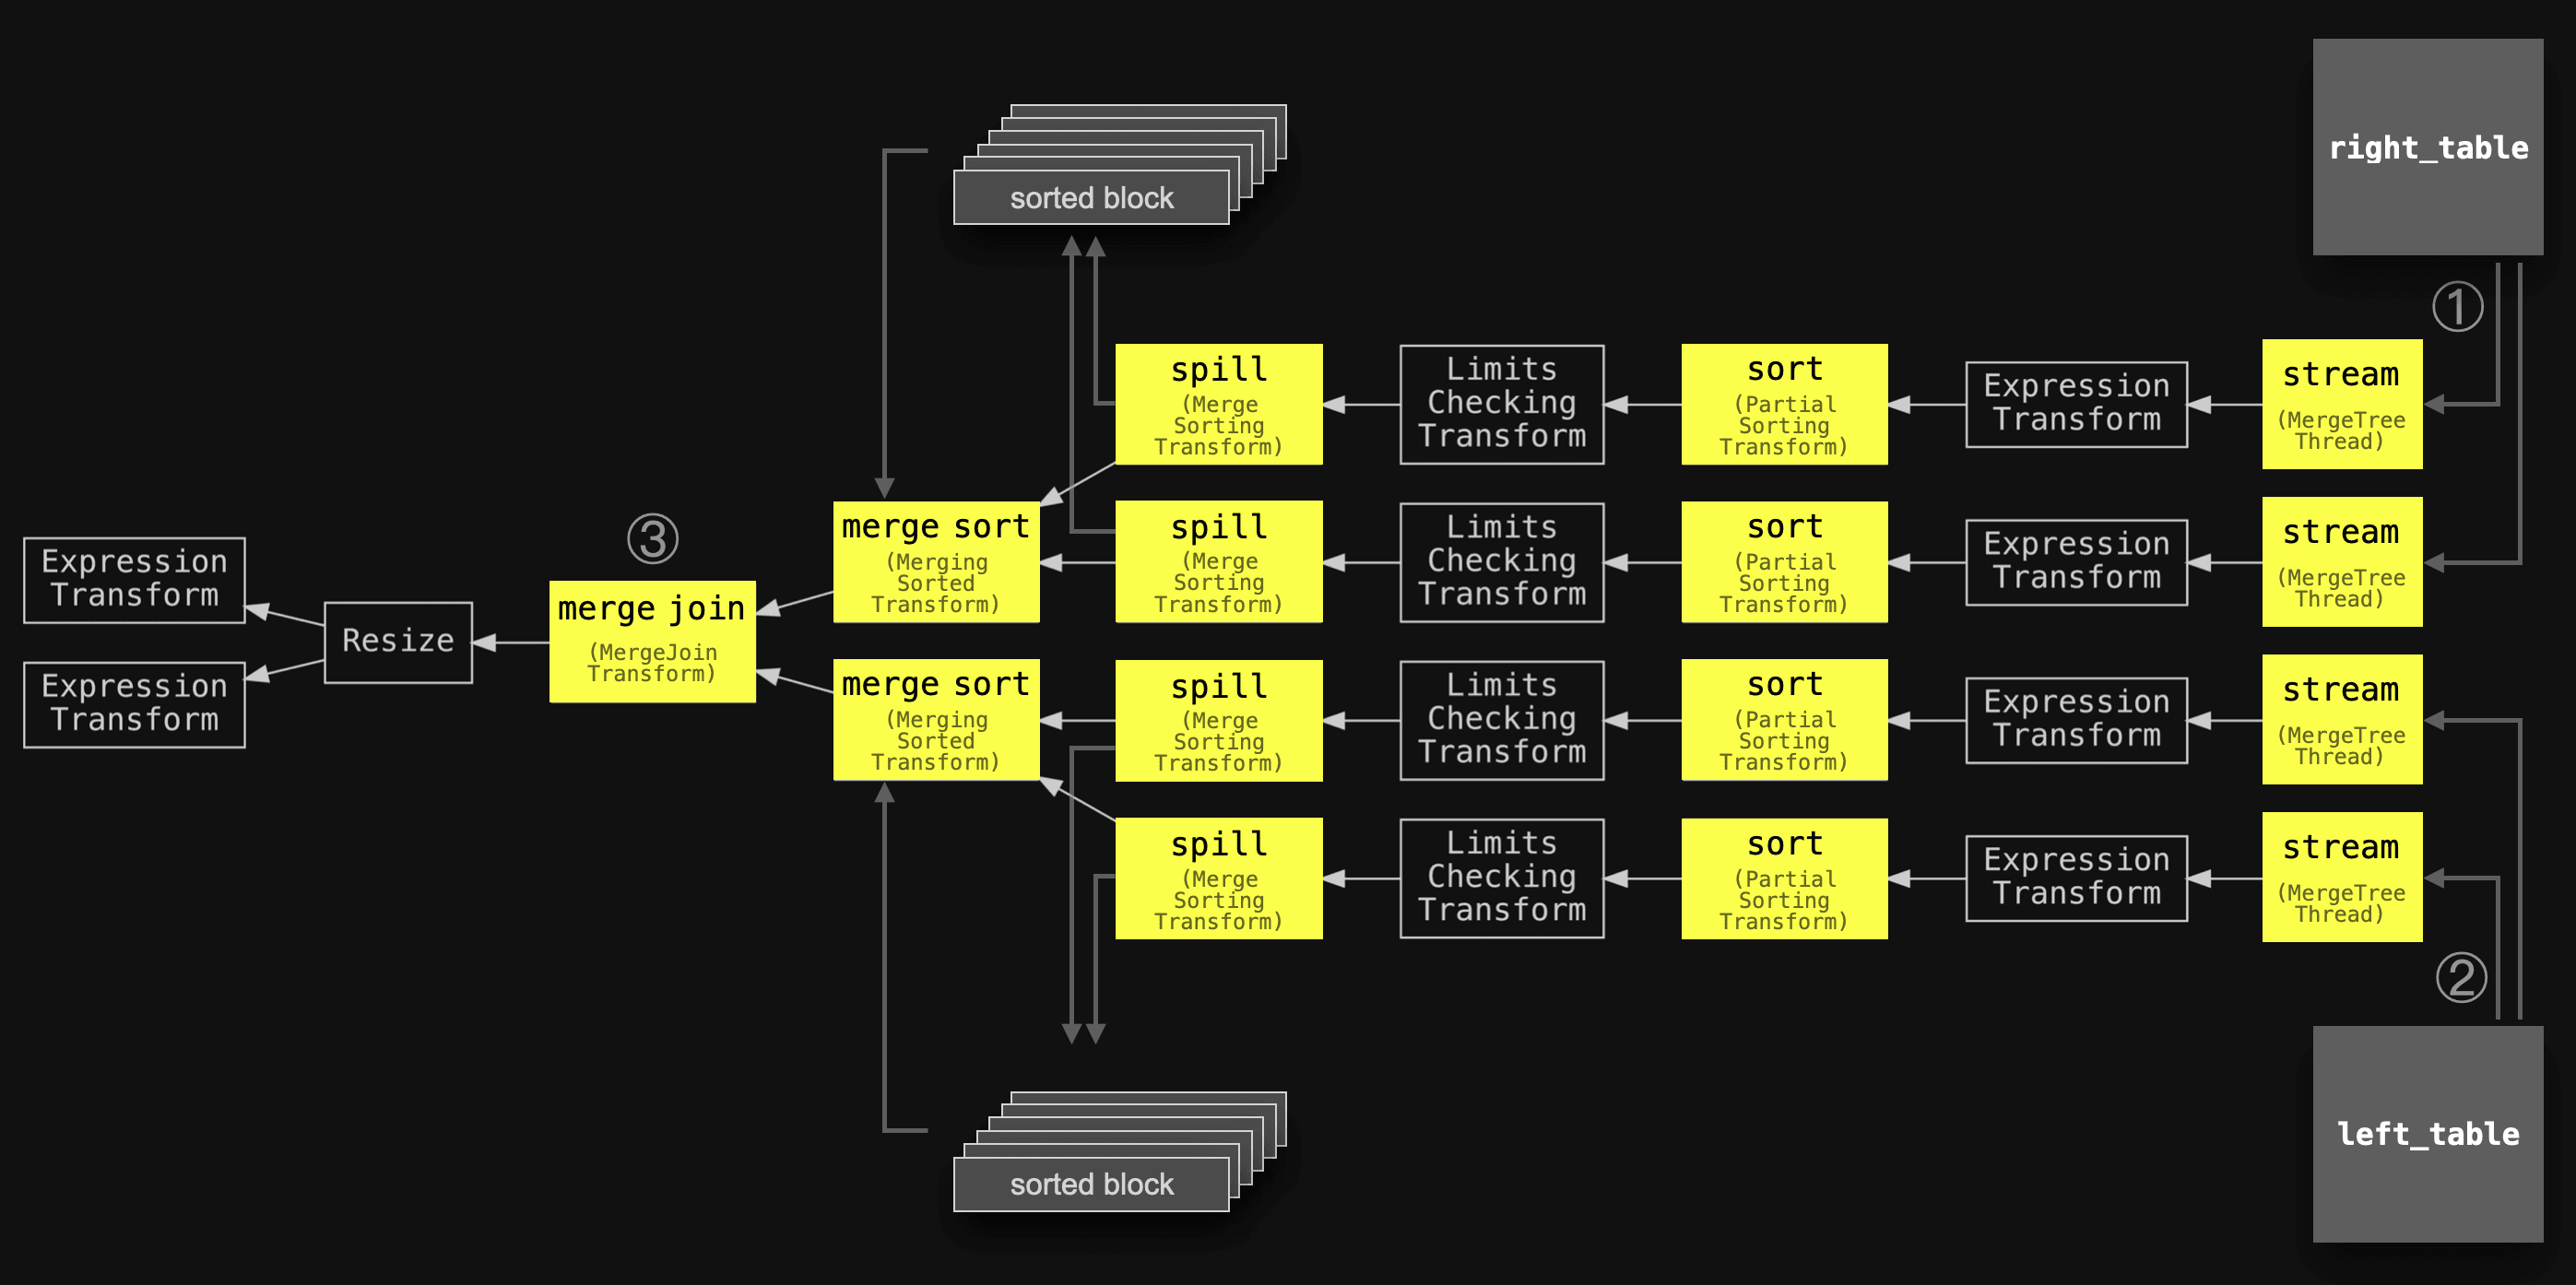
We see that the query pipeline matches our abstract version above.
Note that if the peak in-memory volume of block data to sort stays below the configured threshold for external sorting, the spill stages are ignored, and the sorted blocks are immediately merge-sorted and joined.
Also, note that the peak in-memory volume of block data to sort is only slightly related to the overall amount of data in the two joined tables and is more dependent on the configured level of parallelism within the query pipeline. In general, data is stream processed in ClickHouse: Data is streamed in parallel and block-wise into the (in-memory) query engine. The streamed data blocks are sequentially and in parallel processed by specific query pipeline stages so that as soon as some blocks representing (parts of) the query result are available they are streamed out of memory and back to the sender of the query.
In order to observe external sorting and spilling of data to disk, respectively, we introspect the actual execution of the two example join query runs by asking ClickHouse to send trace-level logs during the execution to the ClickHouse command line client.
First, we get trace logs for the query run with the lowered threshold for external sorting:
clickhouse client --host ea3kq2u4fm.eu-west-1.aws.clickhouse.cloud --secure --password <PASSWORD> --database=imdb_large --send_logs_level='trace' --query "
SELECT *
FROM actors AS a
JOIN roles AS r ON a.first_name = r.role
FORMAT `Null`
SETTINGS join_algorithm = 'full_sorting_merge', max_rows_in_set_to_optimize_join = 0, max_bytes_before_external_sort = '100M';"

    ...
... imdb_large.actors ... : Reading approx. 1000000 rows with 6 streams
    ...
... imdb_large.roles ... : Reading approx. 100000000 rows with 30 streams
    ...
... MergeSortingTransform: ... writing part of data into temporary file …
    ...
... MergingSortedTransform: Merge sorted … blocks, … rows in … sec., … rows/sec., … MiB/sec
    ...
... MergeJoinAlgorithm: Finished processing in … seconds, left: 16 blocks, 1000000 rows; right: 1529 blocks, 100000000 rows, max blocks loaded to memory: 3
    ...
Before we analyze the trace log entries above a quick reminder that we use the default setting of max_threads for all example query runs. That setting controls the level of parallelism within the query pipeline. The node executing the queries has 30 CPU cores and therefore a default max_threads setting of 30. For all query pipeline visualizations, in order to keep them succinct and readable, we artificially limit the level of parallelism used within the ClickHouse query pipeline with the setting max_threads = 2.
We can see how 6 and 30 parallel streams are used for streaming the data from both tables block-wise into the query engine. Because max_threads is set to 30. Note that only 6, instead of 30, parallel streams are used for the actors table containing 1 million rows. The reason for this is the setting merge_tree_min_rows_for_concurrent_read_for_remote_filesystem (for cloud, for OSS the setting is merge_tree_min_rows_for_concurrent_read). This setting configures the minimum number of rows that a single query execution thread should read/process at least. The default value is 163,840 rows. And 1 million rows / 163,840 rows = 6 threads. For the roles table with 100 million rows, the result would be 610 threads, which is above our configured maximum of 30 threads.
Additionally, we see entries for the MergeSortingTransform pipeline stage (whose name is simplified to 'spill' in the diagrams above), indicating that data (of sorted blocks) is spilled to temporary storage on disk. Entries for the MergingSortedTransform stage ('merge sort' in the diagrams above) summarize the merge sorting of the sorted blocks after they were read from temporary storage.
A final MergeJoinAlgorithm entry summarizes the join processing: the 1 million rows from the left table were streamed block-wise (by 6 parallel streams) in the form of 16 blocks (with ~62500 rows per block - close to the default block size). The 100 million rows from the right table were streamed block-wise (by 30 parallel streams) in the form of 1529 blocks (with ~65400 rows per block). During stream processing a maximum of 3 blocks with rows that had the same join key were in memory at the same time during the merge join stage. A cartesian product of these rows is required for the ALL strictness of the INNER join from our example query. This is done in memory.
Next we get trace logs for the query run without the lowered threshold for external sorting:
clickhouse client --host ea3kq2u4fm.eu-west-1.aws.clickhouse.cloud --secure --password <PASSWORD> --database=imdb_large --send_logs_level='trace' --query "
SELECT *
FROM actors AS a
JOIN roles AS r ON a.first_name = r.role
FORMAT `Null`
SETTINGS join_algorithm = 'full_sorting_merge', max_rows_in_set_to_optimize_join = 0;"

    ...
... imdb_large.actors ... : Reading approx. 1000000 rows with 6 streams
    ...
... imdb_large.roles ... : Reading approx. 100000000 rows with 30 streams
    ...
... MergingSortedTransform: Merge sorted … blocks, … rows in … sec., … rows/sec., … MiB/sec
    ...
... MergeJoinAlgorithm: Finished processing in … seconds, left: 16 blocks, 1000000 rows; right: 1529 blocks, 100000000 rows, max blocks loaded to memory: 3
    ...
The log entries look similar to the previous run with the lowered threshold for external sorting. Except that the MergeSortingTransform ('spill') stage is missing because the peak in-memory volume of block data to sort stayed below the default threshold for external sorting. Therefore the spill stages got ignored, and the sorted blocks got immediately merge-sorted and joined.
Scaling #
In the previous post we explained that the max_threads setting controls the level of parallelism within the query pipeline. For readability, we artificially limit the parallelism level with the setting max_threads=2 for the query pipeline visualizations.
Now we introspect the query pipeline for the full sorting merge join query with max_threads set to 4:
clickhouse client --host ekyyw56ard.us-west-2.aws.clickhouse.cloud --secure --port 9440 --password <PASSWORD> --database=imdb_large --query "
EXPLAIN pipeline graph=1, compact=0
SELECT *
FROM actors AS a
JOIN roles AS r ON a.first_name = r.role
SETTINGS max_threads = 4, join_algorithm = 'full_sorting_merge', max_rows_in_set_to_optimize_join = 0
;" | dot -Tpdf > pipeline.pdf
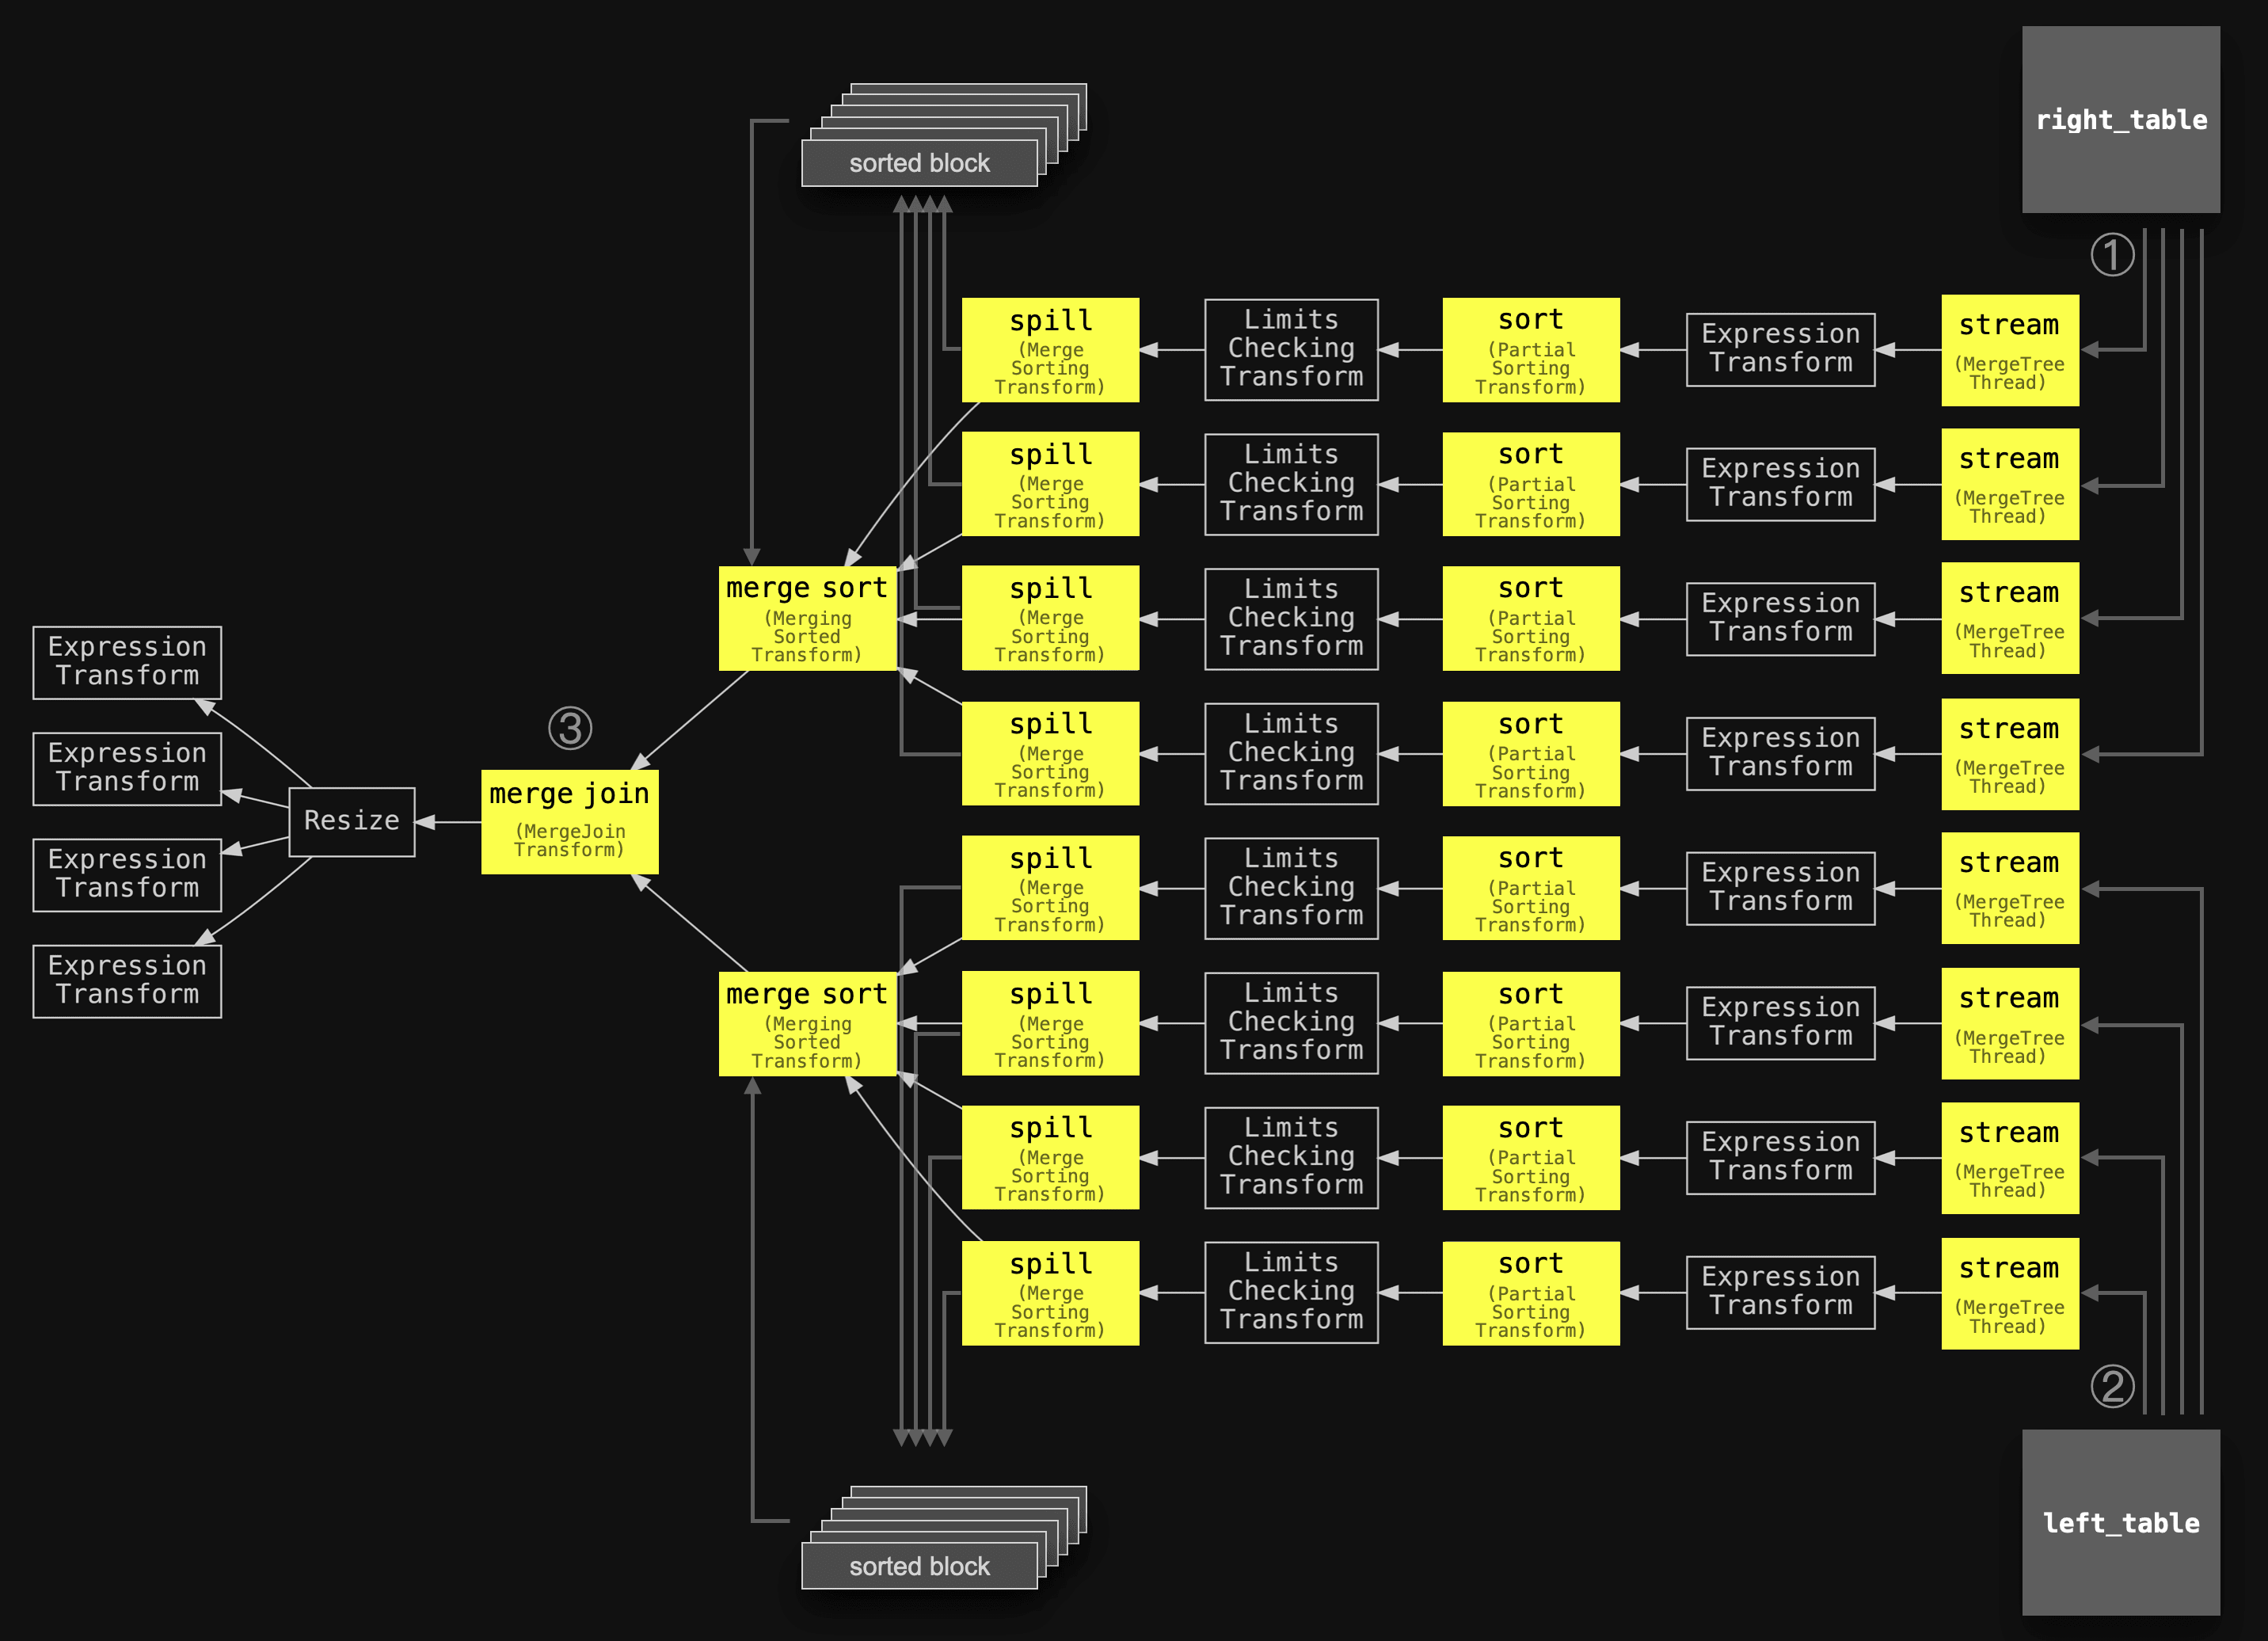
Now four parallel stream, sort, and spill stages are used per table. This speeds up the (external) sorting of the data blocks. The merge sort stage per table and the final merge join stage need to stay single-threaded in order to work correctly, though. However, ClickHouse provides some additional performance optimizations for the sort-merge join. We will discuss these next.
Optimizations #
Filtering tables by each others join key values before joining #
The joined tables can be filtered by each other's join keys prior to any sort and merge operations in order to minimize the amount of data that needs to be sorted and merged. For this, and if possible (see below), ClickHouse builds an in-memory set containing the (unique) join key column values of the right table and uses this set for filtering out all rows from the left table that can’t possibly have join matches. And vice versa. This works especially well if one table is much smaller than the other and the table’s unique join key column values fit in memory.
Hash join also will perform well in such a scenario. But full sorting merge join works for both left and right tables in the same way, and in the case of both tables being larger than the available memory it will just fall back on external sorting automatically. This optimization is an attempt to bring hash join performance to full sorting merge join for this particular use case. The max_rows_in_set_to_optimize_join setting controls the optimization. Setting it to 0 disables it. The default value is 100,000. This value specifies the maximum allowed size (in terms of entries) of both table sets together. This means that if both sets together stay below the threshold, then the optimization will be applied to both tables. If both sets together are above the threshold, then it can still be that one of the two sets is below the threshold, and the optimization will be applied to just one table. As we will see in the trace logs below, ClickHouse will sequentially try to build the sets for both tables and revert and skip building a set if the limit is exceeded.
Our example join query is joining the two tables by the first_name and role columns, respectively:
SELECT *
FROM actors AS a
JOIN roles AS r ON a.first_name = r.role
FORMAT `Null`
SETTINGS join_algorithm = 'full_sorting_merge';
We check the amount of unique join key column values in the (smaller) left table:
SELECT countDistinct(first_name)
FROM actors;


┌─uniqExact(first_name)─┐
│                109993 │
└───────────────────────┘
And we check the amount of unique join key column values in the (larger) right table:
SELECT countDistinct(role)
FROM roles;


┌─uniqExact(role)─┐
│          999999 │
└─────────────────┘
With the default value of 100,000 for the max_rows_in_set_to_optimize_join setting, the optimization would not be applied to either table.
For demonstration, we execute the example query with the default value for max_rows_in_set_to_optimize_join:
SELECT *
FROM actors AS a
JOIN roles AS r ON a.first_name = r.role
FORMAT `Null`
SETTINGS join_algorithm = 'full_sorting_merge';


0 rows in set. Elapsed: 11.602 sec. Processed 101.00 million rows, 3.67 GB (8.71 million rows/s., 315.97 MB/s.)
Now we execute the example query with max_rows_in_set_to_optimize_join set to 200,000. Note that this limit is still too low for building the sets for both tables. But it allows to build the set for the smaller left table, which is the main idea of this optimization i.e. it works especially well if one table is much smaller than the other and the table’s unique join key column values fit in memory:
SELECT *
FROM actors AS a
JOIN roles AS r ON a.first_name = r.role
FORMAT `Null`
SETTINGS join_algorithm = 'full_sorting_merge', max_rows_in_set_to_optimize_join = 200_000;


0 rows in set. Elapsed: 2.156 sec. Processed 101.00 million rows, 3.67 GB (46.84 million rows/s., 1.70 GB/s.)
We can already see a much faster execution time. Let’s check runtime statistics for the two query runs in order to see more details:
SELECT
    query,
    formatReadableTimeDelta(query_duration_ms / 1000) AS query_duration,
    formatReadableSize(memory_usage) AS memory_usage,
    formatReadableQuantity(read_rows) AS read_rows,
    formatReadableSize(read_bytes) AS read_data,
    formatReadableSize(ProfileEvents['ExternalProcessingUncompressedBytesTotal']) AS data_spilled_to_disk_uncompressed,
    formatReadableSize(ProfileEvents['ExternalProcessingCompressedBytesTotal']) AS data_spilled_to_disk_compressed
FROM clusterAllReplicas(default, system.query_log)
WHERE (type = 'QueryFinish') AND hasAll(tables, ['imdb_large.actors', 'imdb_large.roles'])
ORDER BY initial_query_start_time DESC
LIMIT 2
FORMAT Vertical;


Row 1:
──────
query:                             SELECT *
                                   FROM actors AS a
                                   JOIN roles AS r ON a.first_name = r.role
                                   FORMAT `Null`
                                   SETTINGS join_algorithm = 'full_sorting_merge',
                                   max_rows_in_set_to_optimize_join = 200_000;
query_duration:                    2 seconds
memory_usage:                      793.30 MiB
read_rows:                         101.00 million
read_data:                         3.41 GiB
data_spilled_to_disk_uncompressed: 0.00 B
data_spilled_to_disk_compressed:   0.00 B


Row 2:
──────
query:                             SELECT *
                                   FROM actors AS a
                                   JOIN roles AS r ON a.first_name = r.role
                                   FORMAT `Null`
                                   SETTINGS join_algorithm = 'full_sorting_merge';
query_duration:                    11 seconds
memory_usage:                      4.71 GiB
read_rows:                         101.00 million
read_data:                         3.41 GiB
data_spilled_to_disk_uncompressed: 0.00 B
data_spilled_to_disk_compressed:   0.00 B
We can see the effect of the pre-filter optimization: 5 times faster execution time and ~6 times less peak memory consumption.
Now we introspect the query pipeline with the optimization enabled:
clickhouse client --host ekyyw56ard.us-west-2.aws.clickhouse.cloud --secure --port 9440 --password <PASSWORD> --database=imdb_large --query "
EXPLAIN pipeline graph=1, compact=0
SELECT *
FROM actors AS a
JOIN roles AS r ON a.first_name = r.role
SETTINGS max_threads = 2, join_algorithm = 'full_sorting_merge';" | dot -Tpdf > pipeline.pdf
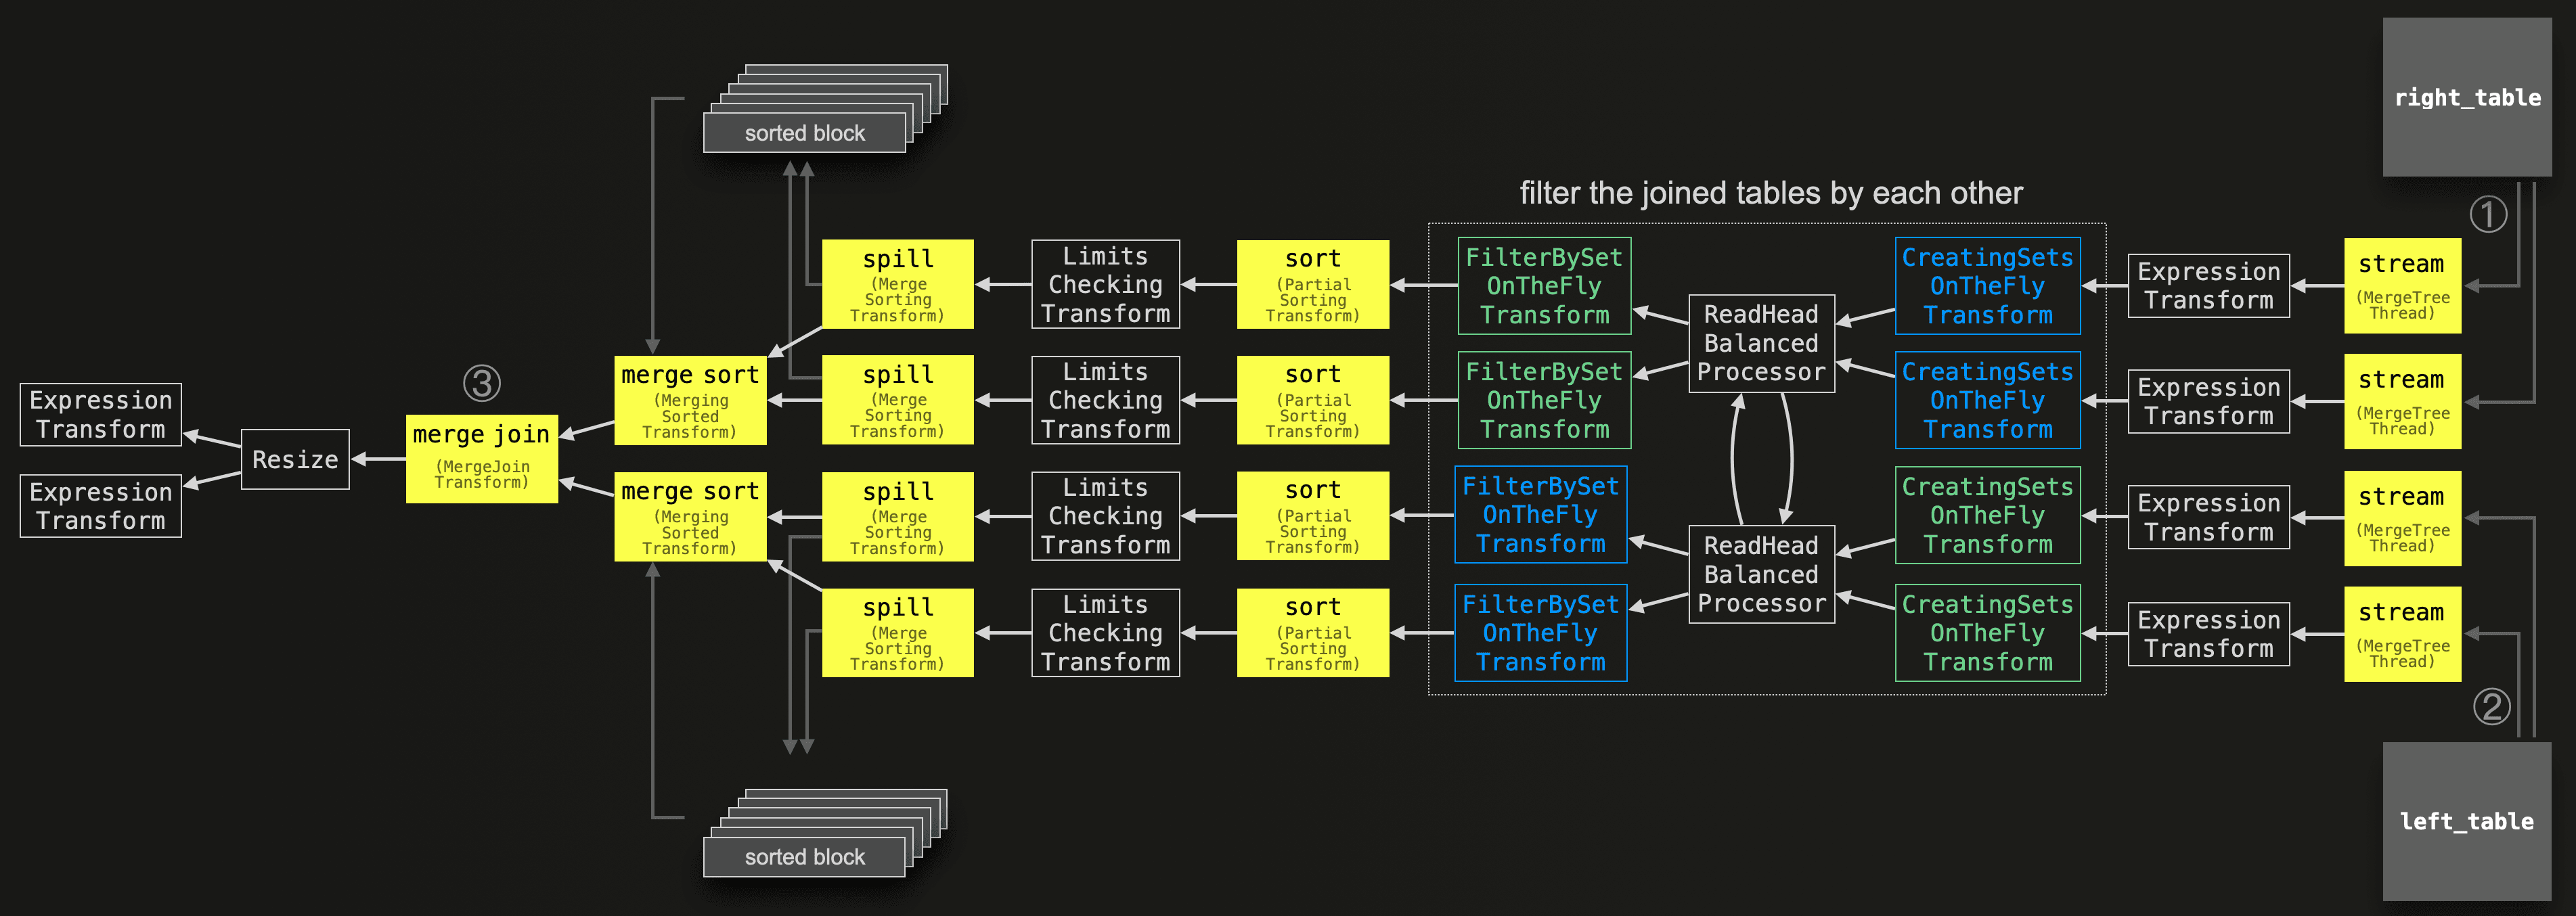
Compared to the pipeline for the general version of the full sorting merge join algorithm, without any optimization applied, we can see additional stages (colored in blue and green in the diagram above). These are responsible for filtering the two tables by each others join key values before joining:
Two parallel blue CreatingSetsOnTheFlyTransform stages are used (if possible) for building an in-memory set containing the (unique) join key column values of the right table.
This set is then used by two (because max_threads is set to two) parallel blue FilterBySetOnTheFlyTransform stages for filtering out all rows from the left table that can’t possibly have join matches.
Two parallel green CreatingSetsOnTheFlyTransform stages are used (if possible) for building an in-memory set containing the (unique) join key column values of the left table.
This set is then used by two parallel green FilterBySetOnTheFlyTransform stages for filtering out all rows from the right table that can’t possibly have join matches.
Before these sets are fully built from the join key columns, in parallel blocks with rows containing all required columns are streamed, bypassing the filter optimization in order to sort the rows within each of these blocks by their join keys and (potentially) spill them to disk. The filter starts to work only when the sets are ready. That’s why there are also two ReadHeadBalancedProcessor stages. These stages ensure that data is streamed from both tables in the beginning (before the sets are ready) proportional to their total size in order to prevent a situation where data from a big table is mostly processed before a small table could be used to filter it.
In order to introspect the execution of these additional stages, we inspect the trace logs for the query execution:
clickhouse client --host ea3kq2u4fm.eu-west-1.aws.clickhouse.cloud --secure --password <PASSWORD> --database=imdb_large --send_logs_level='trace' --query "
SELECT *
FROM actors AS a
JOIN roles AS r ON a.first_name = r.role
FORMAT `Null`
SETTINGS join_algorithm = 'full_sorting_merge', max_rows_in_set_to_optimize_join = 200_000;"


    ...
... imdb_large.actors ... : Reading approx. 1000000 rows with 6 streams
    ...
... imdb_large.roles ... : Reading approx. 100000000 rows with 30 streams
    ...
... CreatingSetsOnTheFlyTransform: Create set and filter Right joined stream: set limit exceeded, give up building set, after reading 577468 rows and using 96.00 MiB
    ...
... CreatingSetsOnTheFlyTransform: Create set and filter Left joined stream: finish building set for [first_name] with 109993 rows, set size is 6.00 MiB
    ...
... FilterBySetOnTheFlyTransform: Finished create set and filter right joined stream by [role]: consumed 3334144 rows in total, 573440 rows bypassed, result 642125 rows, 80.74% filtered
... FilterBySetOnTheFlyTransform: Finished create set and filter right joined stream by [role]: consumed 3334144 rows in total, 573440 rows bypassed, result 642125 rows, 80.74% filtered
    ...
... MergingSortedTransform: Merge sorted … blocks, … rows in … sec., … rows/sec., … MiB/sec
    ...
... MergeJoinAlgorithm: Finished processing in 3.140038835 seconds, left: 16 blocks, 1000000 rows; right: 207 blocks, 13480274 rows, max blocks loaded to memory: 3
    ...
We see how 6 and 30 parallel streams are used for streaming the data from both tables into the query engine.
Next, we see an entry for a CreatingSetsOnTheFlyTransform stage, indicating that the in-memory set containing the (unique) join key column values of the right table couldn’t be built because the number of entries would exceed the configured threshold of 200000 for the max_rows_in_set_to_optimize_join setting.
Another entry for a CreatingSetsOnTheFlyTransform stage shows that the set containing the (unique) join key column values of the left table could be built successfully. This set is used for filtering rows from the right table as indicated by 30 entries (we only show the first two and omit the rest) for the FilterBySetOnTheFlyTransform stage. 30, because ClickHouse streams rows from the right table with 30 parallel stream stages and uses 30 parallel FilterBySetOnTheFlyTransform stages for filtering the 30 streams.
Utilizing physical row order #
If the physical row order of one or both joined tables matches the join key sort order, then the sorting phase of the full sorting merge join algorithm will be skipped for the corresponding table(s).
We can validate this by introspecting the query pipeline for a join query using join keys matching the sorting keys of both tables. First we check the sorting keys from the two joined tables:
SELECT
    name AS table,
    sorting_key
FROM system.tables
WHERE database = 'imdb_large';


┌─table───────┬─sorting_key───────────────────────┐
│ actors      │ id, first_name, last_name, gender │
│ roles       │ actor_id, movie_id                │
└─────────────┴───────────────────────────────────┘
We use a join query that finds all roles for each actor, by joining the two example tables by id for the actors table and by actor_id for the roles table. These join keys are prefixes of the sorting keys of the tables, allowing ClickHouse to skip the sorting stage of the full sorting merge algorithm by reading the rows from both tables in the order they are stored on disk.
We introspect the query pipeline for this query:
clickhouse client --host ekyyw56ard.us-west-2.aws.clickhouse.cloud --secure --port 9440 --password <PASSWORD> --database=imdb_large --query "
EXPLAIN pipeline graph=1, compact=0
SELECT *
FROM actors AS a
JOIN roles AS r ON a.id = r.actor_id
SETTINGS max_threads = 2, join_algorithm = 'full_sorting_merge', max_rows_in_set_to_optimize_join = 0, max_bytes_before_external_sort = '100M';" | dot -Tpdf > pipeline.pdf
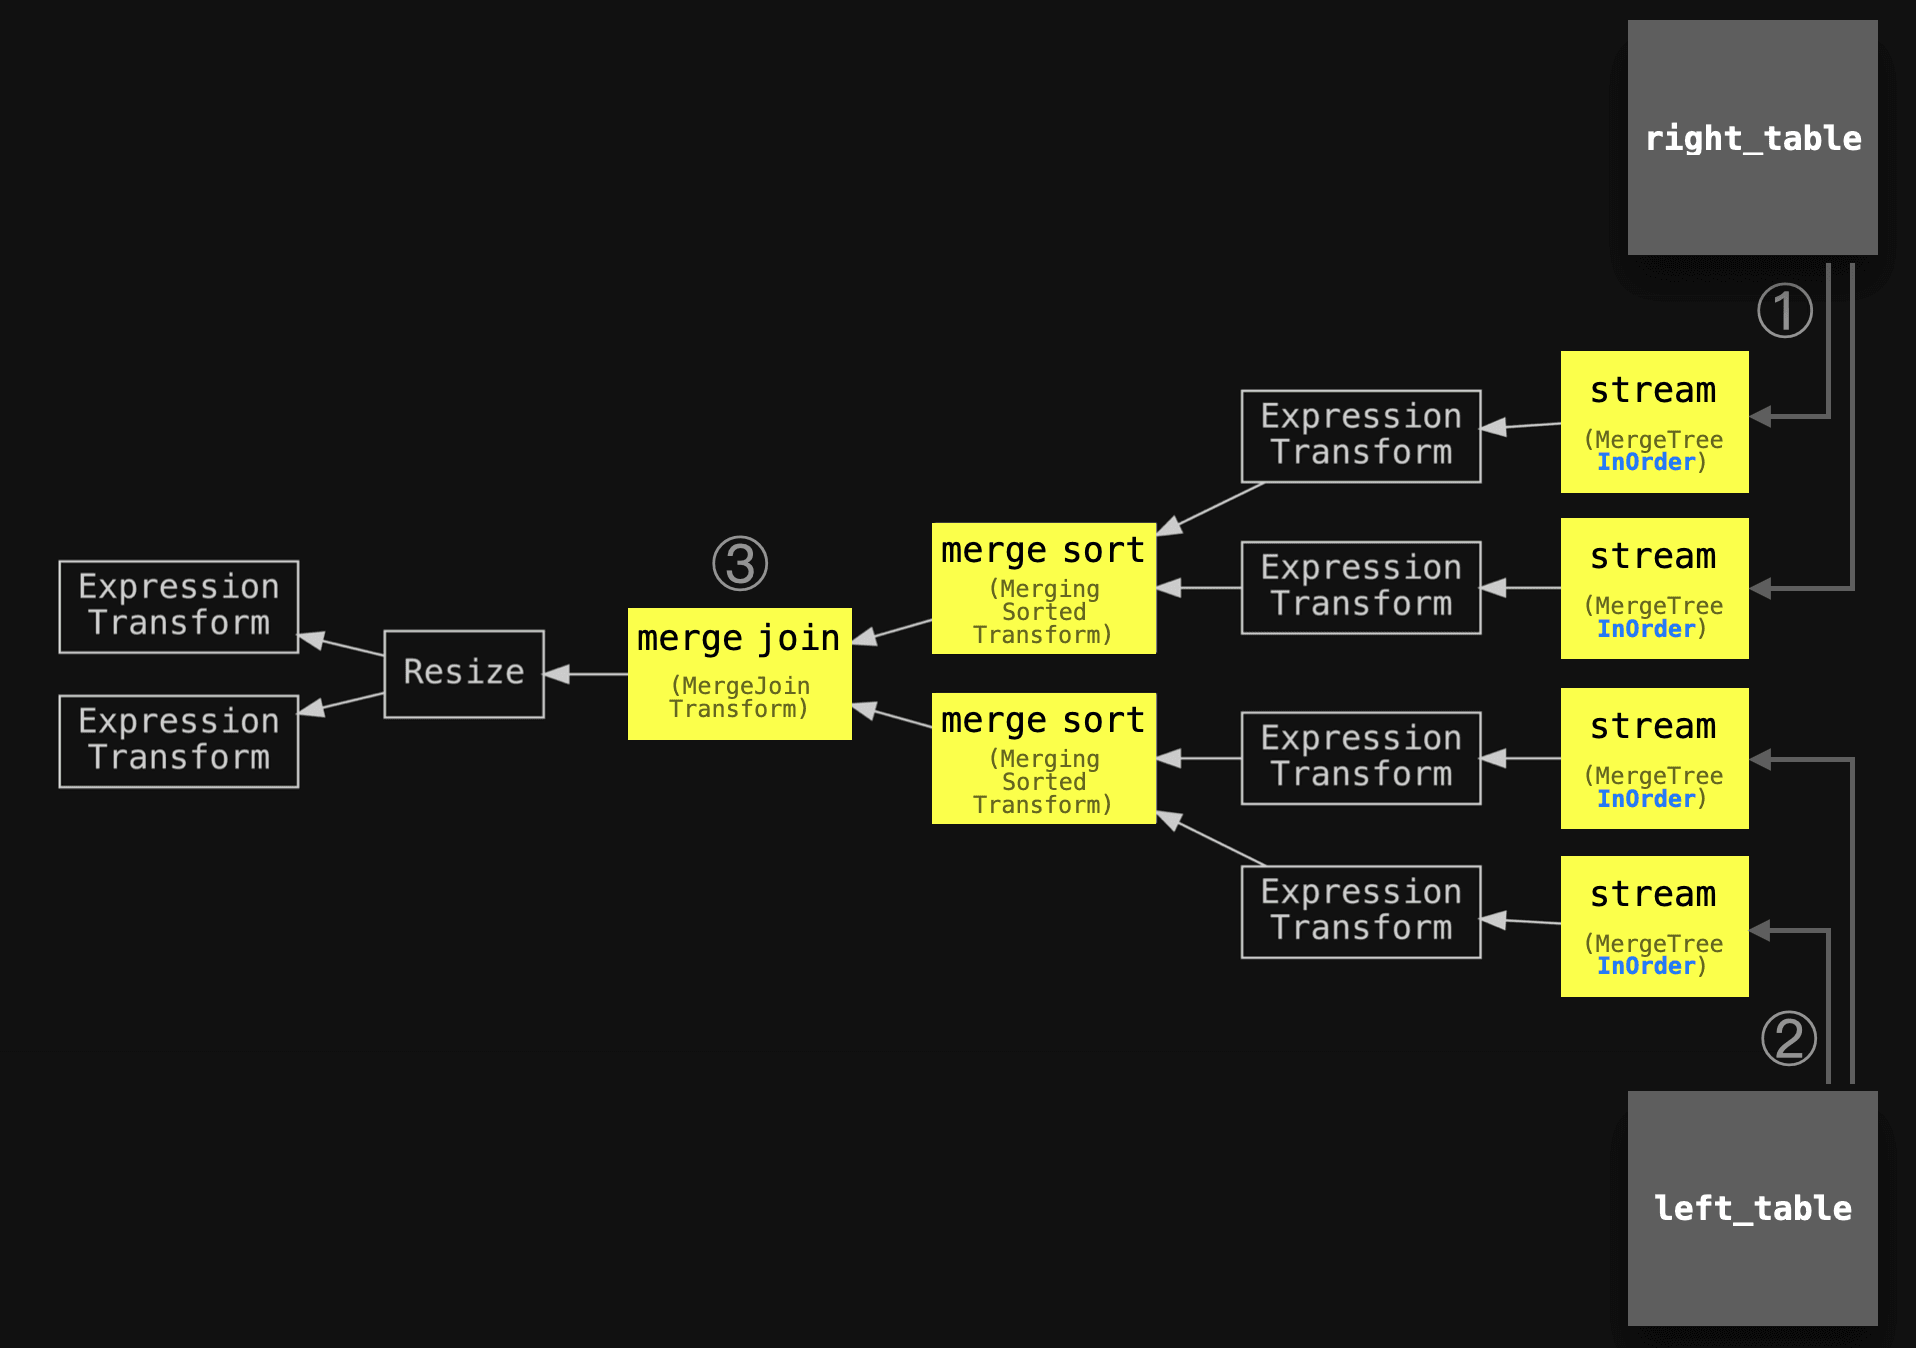
We see that the query pipeline ① ② starts with two parallel stream stages per table (because max_threads is set to 2) that stream the rows block-wise from the two tables in order into the query engine.
Note how sort and spill stages are missing. The already sorted blocks are merge-sorted per table and ③ join matches are identified by merging (interleaved scanning) the two sorted streams.
We run the query where the sorting and spill stages are missing. Note that this read in order optimization is currently only applied with the max_rows_in_set_to_optimize_join setting disabled. There is a pending PR that disables the setting automatically if ClickHouse can read data in order. ClickHouse doesn’t support in order optimization and pre-filtering at the same time. With the PR mentioned above, the in order optimization will be preferred:
SELECT *
FROM actors AS a
JOIN roles AS r ON a.id = r.actor_id
FORMAT `Null`
SETTINGS join_algorithm = 'full_sorting_merge', max_rows_in_set_to_optimize_join = 0;

0 rows in set. Elapsed: 7.280 sec. Processed 101.00 million rows, 3.67 GB (13.87 million rows/s., 503.56 MB/s.)
For comparison we run the same query with enforced sorting by not disabling the max_rows_in_set_to_optimize_join setting:
SELECT *
FROM actors AS a
JOIN roles AS r ON a.id = r.actor_id
FORMAT `Null`
SETTINGS join_algorithm = 'full_sorting_merge';

0 rows in set. Elapsed: 7.542 sec. Processed 101.00 million rows, 3.67 GB (13.39 million rows/s., 486.09 MB/s.)
For further comparison we run the same query with enforced external sorting by not disabling the max_rows_in_set_to_optimize_join setting and by lowering the max_bytes_before_external_sort value:
SELECT *
FROM actors AS a
INNER JOIN roles AS r ON a.id = r.actor_id
FORMAT `Null`
SETTINGS join_algorithm = 'full_sorting_merge', max_bytes_before_external_sort = '100M';

0 rows in set. Elapsed: 8.332 sec. Processed 139.35 million rows, 5.06 GB (16.72 million rows/s., 606.93 MB/s.)
We check runtime statistics for the last three query runs:
SELECT
    query,
    formatReadableTimeDelta(query_duration_ms / 1000) AS query_duration,
    formatReadableSize(memory_usage) AS memory_usage,
    formatReadableQuantity(read_rows) AS read_rows,
    formatReadableSize(read_bytes) AS read_data,
    formatReadableSize(ProfileEvents['ExternalProcessingUncompressedBytesTotal']) AS data_spilled_to_disk_uncompressed,
    formatReadableSize(ProfileEvents['ExternalProcessingCompressedBytesTotal']) AS data_spilled_to_disk_compressed
FROM clusterAllReplicas(default, system.query_log)
WHERE (type = 'QueryFinish') AND hasAll(tables, ['imdb_large.actors', 'imdb_large.roles'])
ORDER BY initial_query_start_time DESC
LIMIT 3
FORMAT Vertical;


Row 1:
──────
query:                             SELECT *
                                   FROM actors AS a
                                   INNER JOIN roles AS r ON a.id = r.actor_id
                                   FORMAT `Null`
                                   SETTINGS join_algorithm = 'full_sorting_merge',
                                   max_bytes_before_external_sort = '100M';
query_duration:                    8 seconds
memory_usage:                      3.56 GiB
read_rows:                         139.35 million
read_data:                         4.71 GiB
data_spilled_to_disk_uncompressed: 1.62 GiB
data_spilled_to_disk_compressed:   1.09 GiB


Row 2:
──────
query:                             SELECT *
                                   FROM actors AS a
                                   JOIN roles AS r ON a.id = r.actor_id
                                   FORMAT `Null`
                                   SETTINGS join_algorithm = 'full_sorting_merge';
query_duration:                    7 seconds
memory_usage:                      5.07 GiB
read_rows:                         101.00 million
read_data:                         3.41 GiB
data_spilled_to_disk_uncompressed: 0.00 B
data_spilled_to_disk_compressed:   0.00 B


Row 3:
──────
query:                             SELECT *
                                   FROM actors AS a
                                   JOIN roles AS r ON a.id = r.actor_id
                                   FORMAT `Null`
                                   SETTINGS join_algorithm = 'full_sorting_merge',
                                   max_rows_in_set_to_optimize_join = 0;
query_duration:                    7 seconds
memory_usage:                      497.88 MiB
read_rows:                         101.00 million
read_data:                         3.41 GiB
data_spilled_to_disk_uncompressed: 0.00 B
data_spilled_to_disk_compressed:   0.00 B
The query run from Row 3, where the sorting and spilling stages are skipped, has the fastest execution time and a very low memory usage. Because the data from both tables is streamed through the query engine block-wise, and in order, just a few data blocks are in memory at the same time and just need to be merged and streamed out to the sender of the query.
We can see for the query run from Row 2 with enforced sorting that the sorting took place in memory, as no data got spilled to disk. This query run uses 10 times more memory than the run from Row 3 without sorting.
And for the query run from Row 1 with enforced external sorting the execution time is the slowest, but the memory usage is lower compared to the query run from Row 2 with enforced in-memory sorting.
The stream in order optimization is also applied when only one of the tables' physical row order matches the join key sort order. We can demonstrate this by introspecting the query pipeline for a join query where the left table is joined by a column that matches the table’s physical row order on disk, but where this isn’t the case for the right table:
clickhouse client --host ekyyw56ard.us-west-2.aws.clickhouse.cloud --secure --port 9440 --password <PASSWORD> --database=imdb_large --query "
EXPLAIN pipeline graph=1, compact=0
SELECT *
FROM actors AS a
JOIN roles AS r ON a.id = r.movie_id
SETTINGS max_threads = 2, join_algorithm = 'full_sorting_merge', max_rows_in_set_to_optimize_join = 0;" | dot -Tpdf > pipeline.pdf
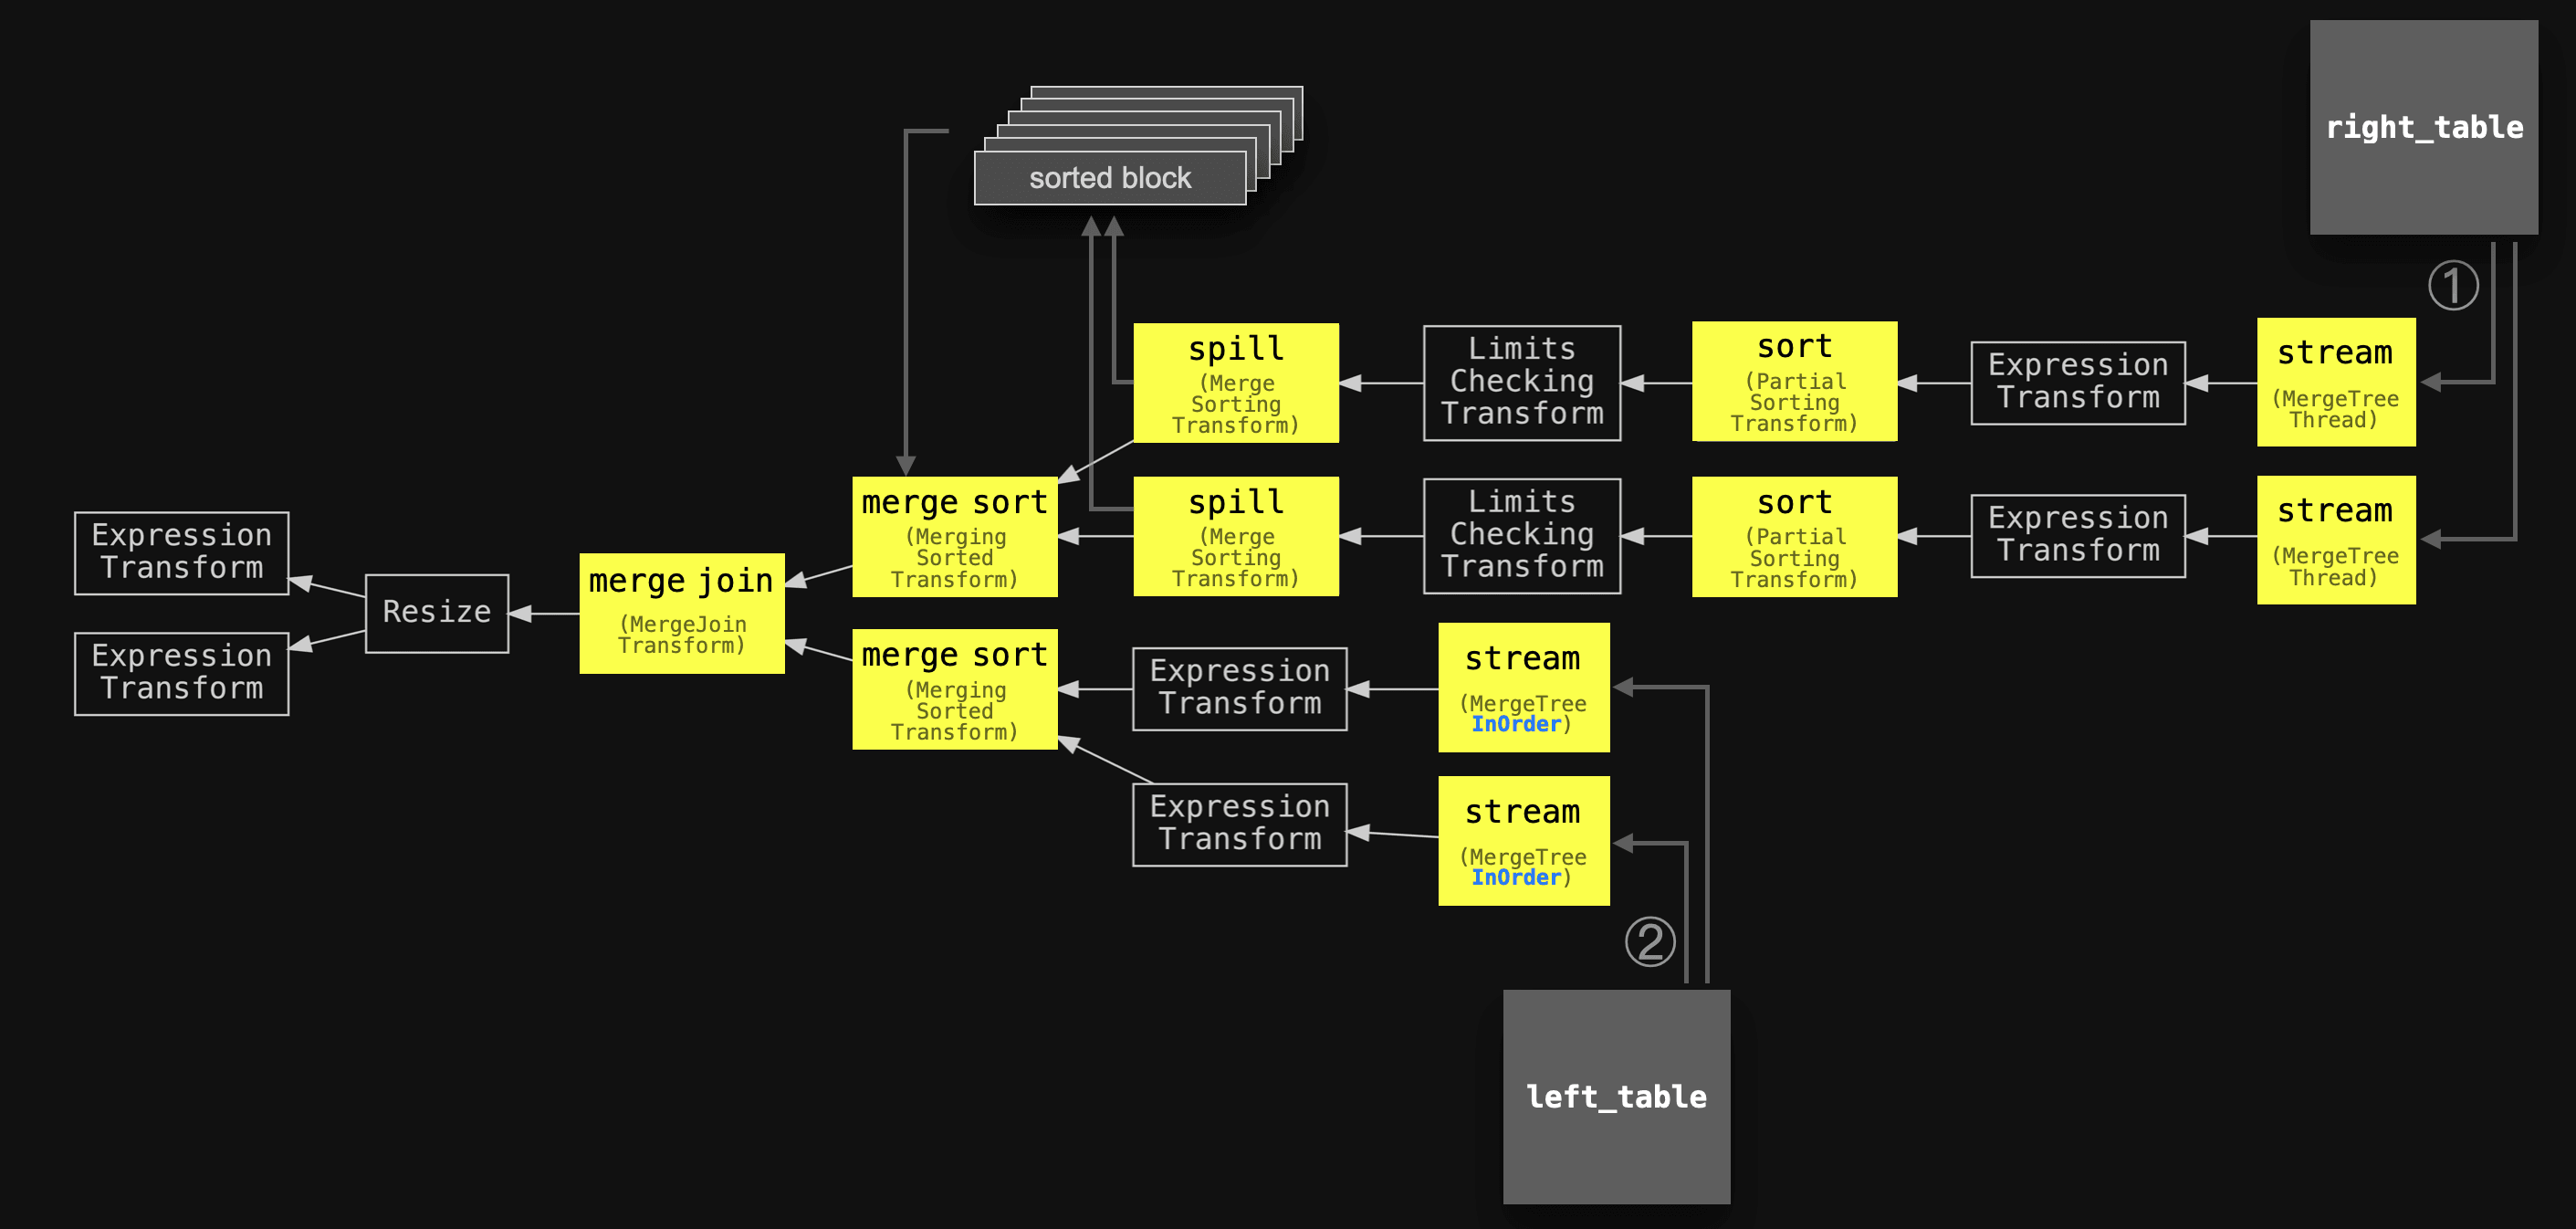
The rows from the left table are streamed in parallel by two streams in order into the query engine. The sort and spill stages for these already ordered streams are missing. Conversely, the stages for the right table indicate sorting and (potentially) spilling though.
Partial merge join #
Description #
The partial merge join is a variant of the sort-merge join integrated into the ClickHouse query pipeline. The classical sort-merge join fully sorts both joined tables by join keys first and then merges the sorted results. The ClickHouse partial merge join is optimized for minimizing memory usage when large tables are joined and only fully sorts the right table first via external sorting. In order to minimize the amount of data being processed in memory, it creates min-max indexes on disk. The left table is always sorted, block-wise and in-memory. But if the physical row order of the left table matches the join key sort order, then the in-memory identification of join matches is more efficient.
This diagram sketches the details of how ClickHouse implements the partial merge join:
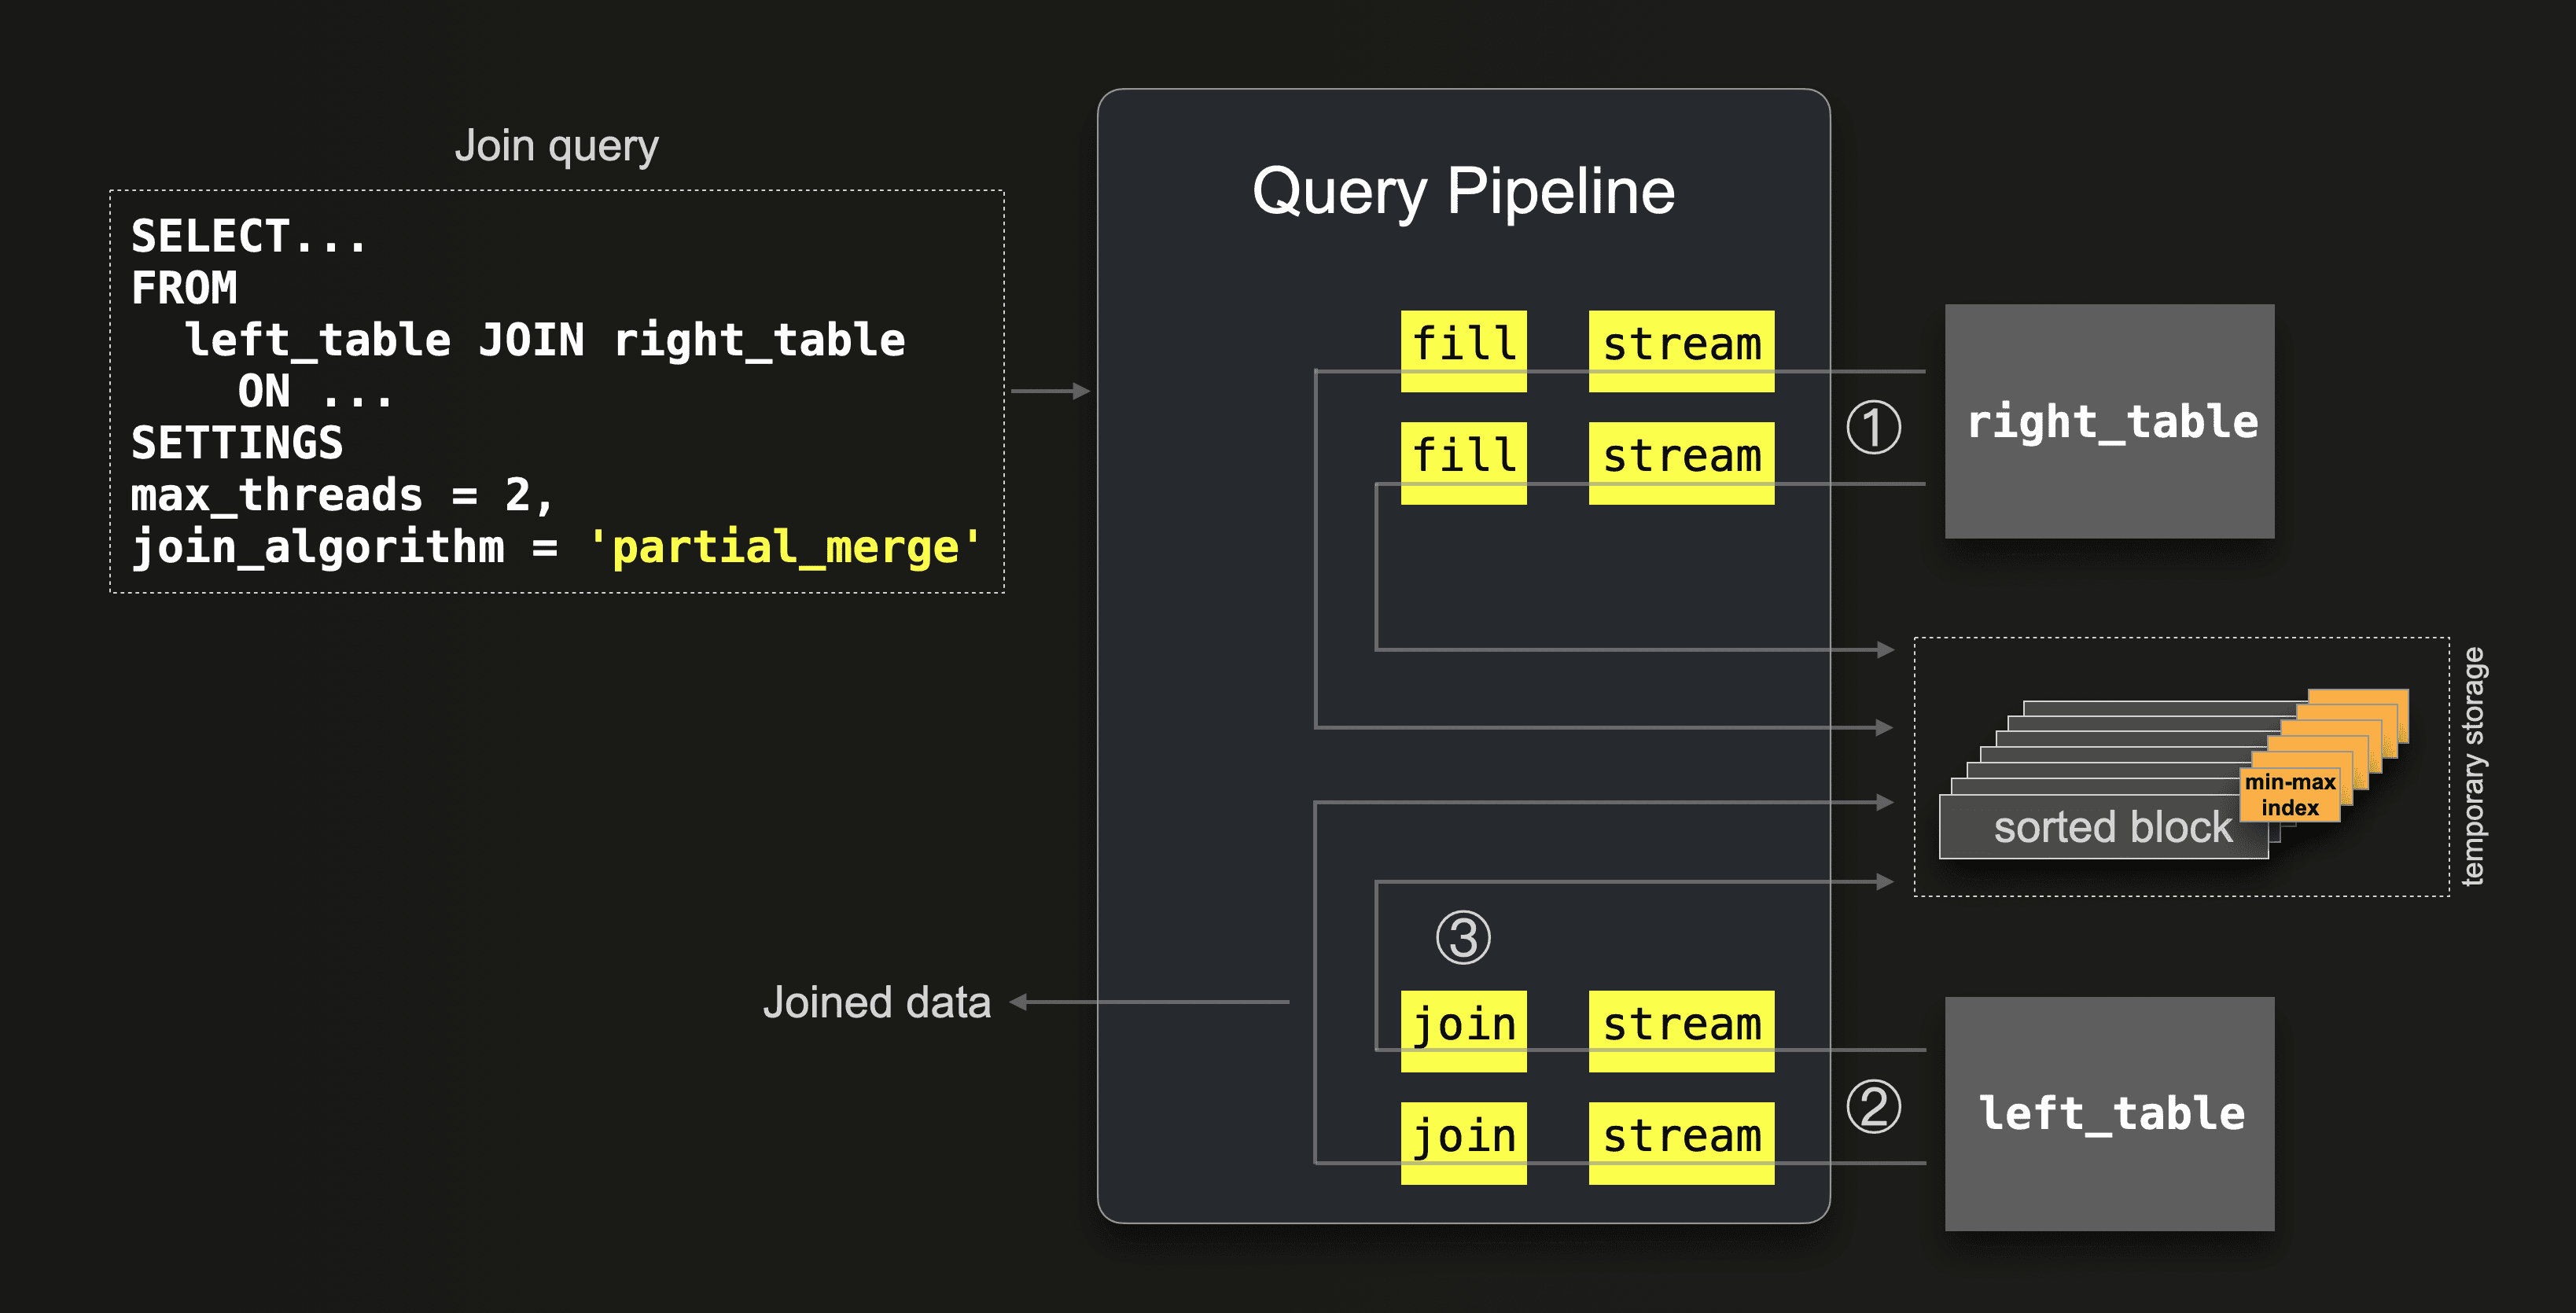
The query pipeline looks very similar to the pipeline of the ClickHouse hash join algorithm. This is no coincidence. The partial merge join is reusing the hash join pipeline because, as the hash join, it has a build and a scan phase. Remember that the hash join first builds a hash table from the right table and then scans the left table. Similarly, the partial merge join first builds a sorted version of the right table and then scans the left table:
① First, all data from the right table is streamed block-wise in parallel by 2 streams (because max_threads = 2) into the memory. Via fill stages, the rows within each streamed block are sorted by the join key column values and spilled to temporary storage together with a min-max index for each sorted block. A min-max index stores, for each sorted block, the minimum and maximum join key values that the block contains. These min-max indexes are used in step ② for minimizing the amount of data being processed in-memory when join matches are identified.
② Then all data from the left table is streamed block-wise in parallel by 2 streams (max_threads = 2). Each block is sorted on the fly by the join keys and then ③ matched against the sorted blocks on disk from the right table. The min-max indexes are used for loading only right table blocks from disk that can possibly contain join matches.
This join processing strategy is very memory efficient. Regardless of the size and physical row order of the joined tables. In step ① above only a few blocks from the right table are streamed through memory at the same time before being written to temporary storage. In step ② only a few blocks from the left table are streamed through memory at the same time. The min-max indexes created in step ① help minimize the number of right table blocks that are loaded into memory from temporary storage for identifying join matches.
Note that if the physical row order of the left table matches the join key sort order, then this min-max index based skipping of non-matching right table blocks is most effective.
However, it is most expensive to use the partial merge join algorithm when the data blocks of the left table have some general distribution of join key values. Because if each block of the left table contains a large subset of generally distributed join key values, then the min-max indexes of the sorted blocks from the right table don’t help, and effectively a cross product is created between the blocks of both tables: for each block of the left table, a large set of sorted blocks from the right table is loaded from disk.
Supported join types #
INNER, LEFT, RIGHT, FULL join types with ALL strictness and INNER, LEFT join types with ANY and SEMI strictness are supported.
Examples #
We run our example join query (using join keys which are prefixes of the joined table’s sorting keys to benefit from the above min-max index based performance optimization) with the partial merge algorithm:
SELECT *
FROM actors AS a
INNER JOIN roles AS r ON a.id = r.actor_id
FORMAT `Null`
SETTINGS join_algorithm = 'partial_merge';

0 rows in set. Elapsed: 33.796 sec. Processed 101.00 million rows, 3.67 GB (2.99 million rows/s., 108.47 MB/s.)
Now we run the same query but with a left table that has a different physical order on disk. We created a copy of the actors table sorted by non join key columns. Meaning that the rows are in random join key order. This is, as explained above, the worst scenario for the partial merge join’s execution time:
SELECT *
FROM actors_unsorted AS a
INNER JOIN roles AS r ON a.id = r.actor_id
FORMAT `Null`
SETTINGS join_algorithm = 'partial_merge';


0 rows in set. Elapsed: 44.872 sec. Processed 101.00 million rows, 3.67 GB (2.25 million rows/s., 81.70 MB/s.)
The execution time is 36% slower compared to the previous run.
For further comparison, we run the same query with the full sorting merge algorithm. For a fair comparison with the partial merge algorithm, we enforce external sorting. By disabling the 'stream in order optimization' of the full sorting merge algorithm (by not setting max_rows_in_set_to_optimize_join to 0). And by lowering the max_bytes_before_external_sort value:
SELECT *
FROM actors AS a
INNER JOIN roles AS r ON a.id = r.actor_id
FORMAT `Null`
SETTINGS join_algorithm = 'full_sorting_merge', max_bytes_before_external_sort = '100M';

0 rows in set. Elapsed: 7.381 sec. Processed 139.35 million rows, 5.06 GB (18.88 million rows/s., 685.11 MB/s.)
We check runtime statistics for the last three query runs:
SELECT
    query,
    formatReadableTimeDelta(query_duration_ms / 1000) AS query_duration,
    formatReadableSize(memory_usage) AS memory_usage,
    formatReadableQuantity(read_rows) AS read_rows,
    formatReadableSize(read_bytes) AS read_data,
    formatReadableSize(ProfileEvents['ExternalProcessingUncompressedBytesTotal']) AS data_spilled_to_disk_uncompressed,
    formatReadableSize(ProfileEvents['ExternalProcessingCompressedBytesTotal']) AS data_spilled_to_disk_compressed
FROM clusterAllReplicas(default, system.query_log)
WHERE (type = 'QueryFinish') AND (hasAll(tables, ['imdb_large.actors', 'imdb_large.roles']) OR hasAll(tables, ['imdb_large.actors_unsorted', 'imdb_large.roles']))
ORDER BY initial_query_start_time DESC
LIMIT 3
FORMAT Vertical;


Row 1:
──────
query:                             SELECT *
                                   FROM actors AS a
                                   INNER JOIN roles AS r ON a.id = r.actor_id
                                   FORMAT `Null`
                                   SETTINGS join_algorithm = 'full_sorting_merge',
                                   max_bytes_before_external_sort = '100M';
query_duration:                    7 seconds
memory_usage:                      3.54 GiB
read_rows:                         139.35 million
read_data:                         4.71 GiB
data_spilled_to_disk_uncompressed: 1.62 GiB
data_spilled_to_disk_compressed:   1.09 GiB

Row 2:
──────
query:                             SELECT *
                                   FROM actors_unsorted AS a
                                   INNER JOIN roles AS r ON a.id = r.actor_id
                                   FORMAT `Null`
                                   SETTINGS join_algorithm = 'partial_merge';
query_duration:                    44 seconds
memory_usage:                      2.20 GiB
read_rows:                         101.00 million
read_data:                         3.41 GiB
data_spilled_to_disk_uncompressed: 5.27 GiB
data_spilled_to_disk_compressed:   3.52 GiB

Row 3:
──────
query:                             SELECT *
                                   FROM actors AS a
                                   INNER JOIN roles AS r ON a.id = r.actor_id
                                   FORMAT `Null`
                                   SETTINGS join_algorithm = 'partial_merge';
query_duration:                    33 seconds
memory_usage:                      2.21 GiB
read_rows:                         101.00 million
read_data:                         3.41 GiB
data_spilled_to_disk_uncompressed: 5.27 GiB
data_spilled_to_disk_compressed:   3.52 GiB
We can see in Row 2 and Row 3 that the two runs of the partial merge join have the same amount of used memory and data spilled to disk. However, as explained in detail above, the execution speed is faster for the run in Row 3 where the physical row order of the left table matches the join key order.
Even with (artificially enforced) full external sorting of the joined tables, the execution speed of the full sorting merge join in Row 1 is almost 5 times faster than the execution speed of the partial merge join in Row 3. The partial merge join uses less memory though as intended in its design
Query pipeline and trace logs #
We introspect the query pipeline for the partial merge join example with max_threads set to 2:
clickhouse client --host ekyyw56ard.us-west-2.aws.clickhouse.cloud --secure --port 9440 --password <PASSWORD> --database=imdb_large --query "
EXPLAIN pipeline graph=1, compact=0
SELECT *
FROM actors AS a
JOIN roles AS r ON a.first_name = r.role
SETTINGS max_threads = 2, join_algorithm = 'partial_merge';" | dot -Tpdf > pipeline.pdf
The circled numbers, slightly simplified names of the main stages and added two joined tables are used for aligning with the abstract diagram above:
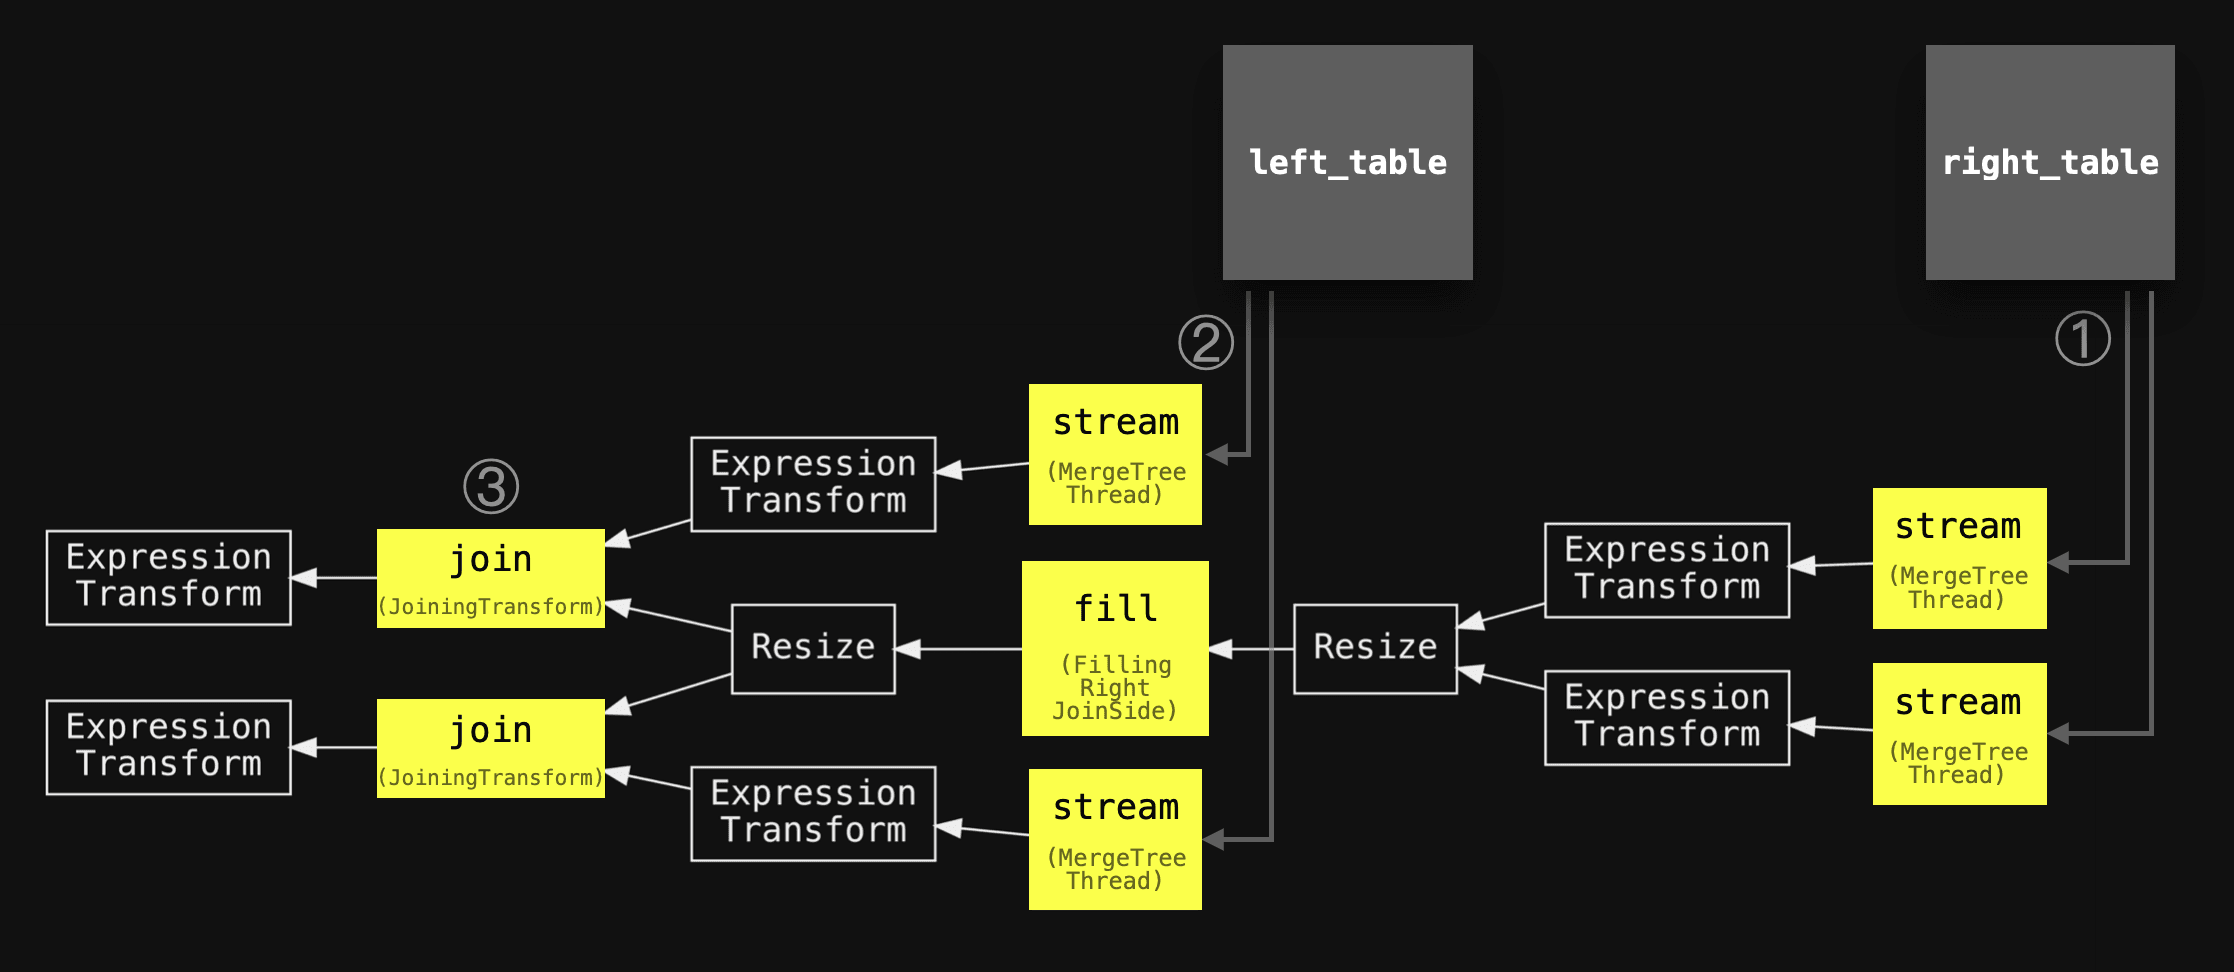
The real query pipeline reflects our abstract version above. As mentioned before, the partial sorting merge join is reusing the hash join pipeline because, like the hash join, it has a build and a scan phase: The partial merge join first builds a sorted version of the right table, and then scans the left table.
The sorting of the blocks from the right table, and the sort-merging with the blocks from the left table, are not directly visible in the pipeline due to the above mentioned pipeline reuse.
In order to introspect the execution of these stages, we inspect the trace logs for the query execution:
clickhouse client --host ea3kq2u4fm.eu-west-1.aws.clickhouse.cloud --secure --password <PASSWORD> --database=imdb_large --send_logs_level='trace' --query "
SELECT *
FROM actors AS a
JOIN roles AS r ON a.first_name = r.role
FORMAT `Null`
SETTINGS join_algorithm = 'partial_merge';"


    ...
... imdb_large.actors ... : Reading approx. 1000000 rows with 6 streams
    ...
... imdb_large.roles ... : Reading approx. 100000000 rows with 30 streams
    ...
... MergingSortedTransform: Merge sorted 1528 blocks, 100000000 rows …
    ...
We can see how 6 and 30 parallel streams are used for streaming the data from both tables block-wise into the query engine.
A MergingSortedTransform entry summarizes the join processing: The 1528 data blocks from the right table with 100 million rows got sorted and later merge-joined with the blocks from the left table. Note that 1528 data blocks for 100 million rows is equivalent to ~65445 rows per block which corresponds to the default block size.
Summary #
This blog post described and compared in detail the two ClickHouse join algorithms that are based on external sorting.
The Full sorting merge join is non-memory bound and based on in-memory or external sorting, and can take advantage of the physical row order of the joined tables and skip the sorting phase. In such cases, the join performance can be competitive with hash join algorithms, while generally requiring significantly less main memory.
The partial merge join is optimized for minimizing memory usage when large tables are joined, and always fully sorts the right table first via external sorting. The left table is also always sorted, block-wise in-memory. The join matching process runs more efficiently if the physical row order of the left table matches the join key sorting order.
This chart summarizes and compares the memory usage and execution times of some of this post’s join query runs. We ran always the same join query joining the same data, with the larger table on the right-hand side on a node with 30 CPU cores (and therefore max_threads set to 30):
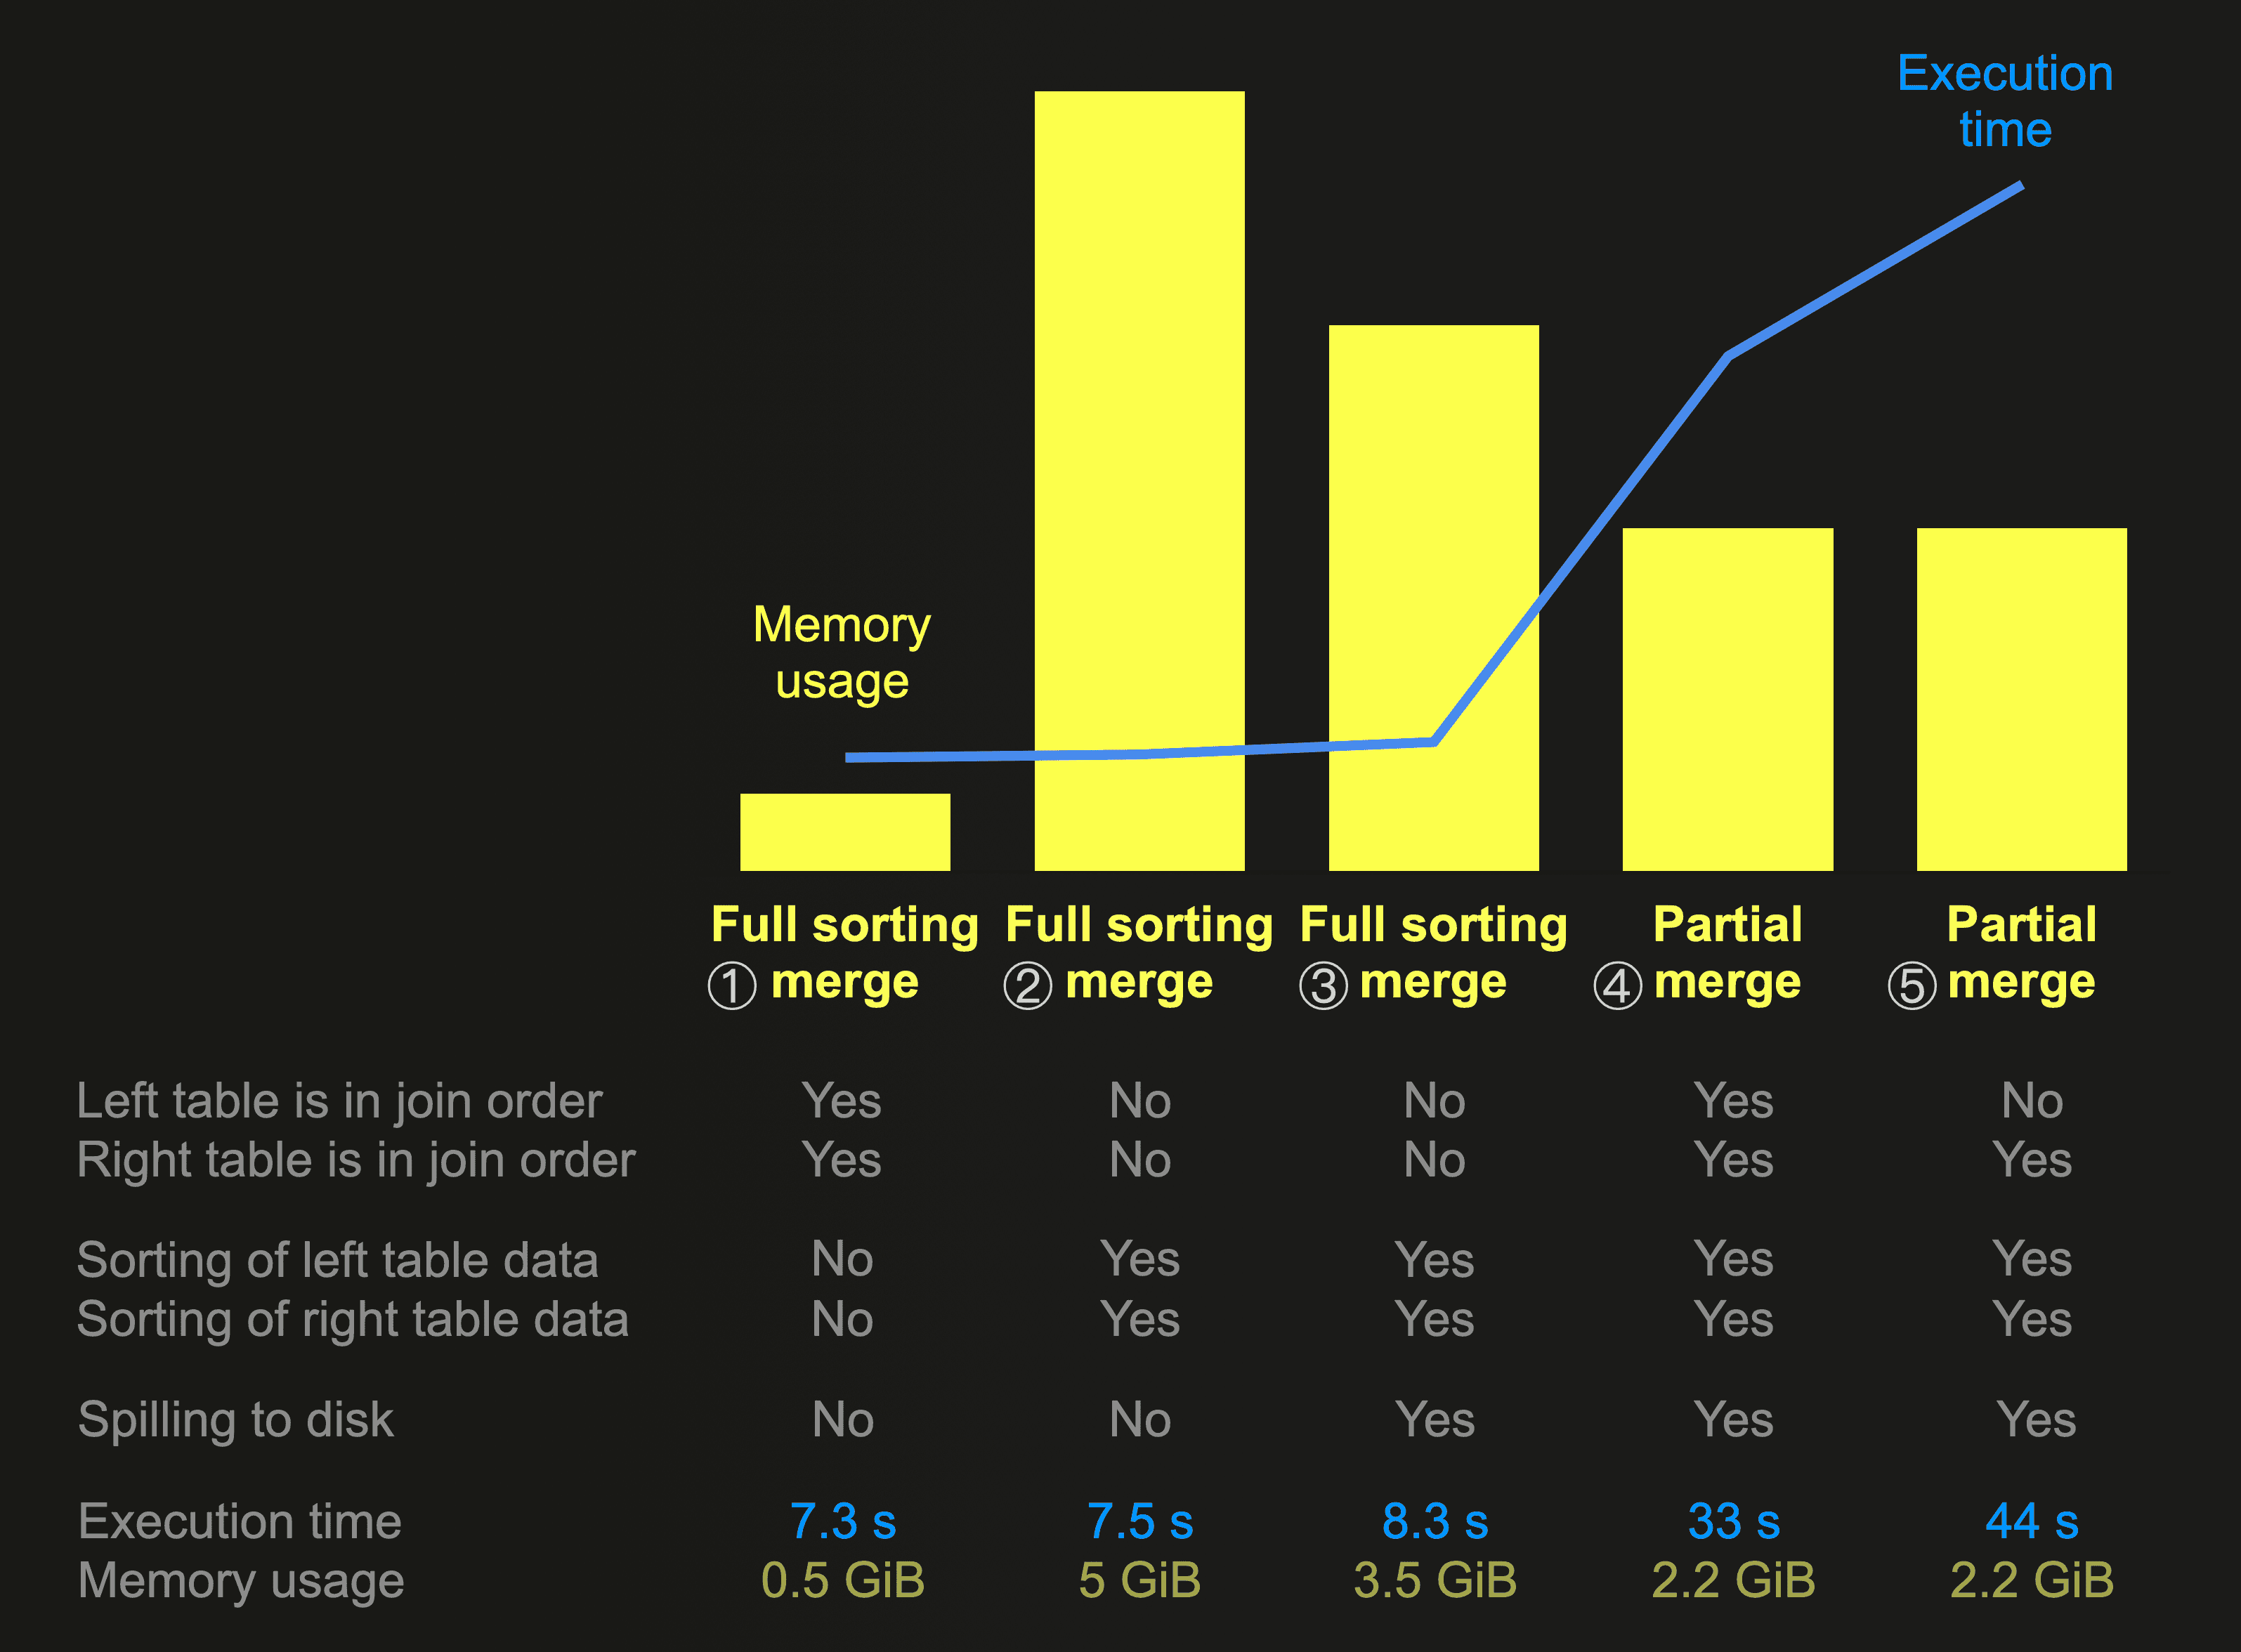
① In this run the full sorting merge join skips the sorting and spilling stages because the physical row order of both joined tables matches the join key sort order. Resulting in the fastest execution time and significantly the lowest memory usage. ② With in-memory sorting of both joined tables the full sorting merge join has the highest memory consumption and with ③ external sorting instead of in-memory sorting the memory consumption is reduced for the sacrifice of reduced execution speed. ④ The partial merge join always sorts the data of the right table via external sorting. We see that this algorithm has the lowest memory usage from all the join query runs with external sorting. This is what this algorithm is optimized for at the expense of relatively low execution speed. The left table data is also always sorted block-wise and in-memory. But ⑤ we can see that the execution speed is worst if the physical row order of the left table does not match the join key order.
In our next post, we will describe ClickHouse’s fastest join algorithm: Direct join.
Stay tuned!
Get started with ClickHouse Cloud today and receive $300 in credits. At the end of your 30-day trial, continue with a pay-as-you-go plan, or contact us to learn more about our volume-based discounts. Visit our pricing page for details.


