ClickHouse Cloud Dashboards are now Generally Available. Last December, we announced the beta release of Dashboards in the ClickHouse Cloud console, a feature that allows users to create visual dashboards, collect insights, and share visualizations from saved queries. Over the six months following launch, we've been actively collecting user feedback, analyzing feature adoption, and shipping additional features like sharing.
In this blog post, I'll share how we used our own dashboards feature to track the feature's adoption and outline our vision for the future of ClickHouse Cloud Dashboards.
The problem we solved #
ClickHouse is an exceptional database for analytics, and ClickHouse Cloud provides the best way to deploy it. While the ClickHouse Cloud console has featured a SQL console for several years, it had one significant limitation: users needed to write and execute SQL queries to access their data.
This created a barrier for wider adoption within organizations. Internally at ClickHouse, we use ClickHouse Cloud as our data warehouse, but many team members, particularly in non-technical roles, didn't want to write SQL or even see SQL code to view data. To address this, we deployed Superset on top of our ClickHouse Cloud service and created dashboards for the team's consumption.
The core issues were clear: many users aren't comfortable writing SQL and expect dashboard-based data access. Additionally, our SQL console made it impossible to view results from multiple queries side-by-side.
How Dashboards work #
At their foundation, dashboards are visual representations of SELECT queries, we designed our dashboards feature with this principle at its core. To create a dashboard, users simply SELECT data from a table and save the query. Through Dashboards, users can select saved queries (or write new ones) and create visualizations from these queries.

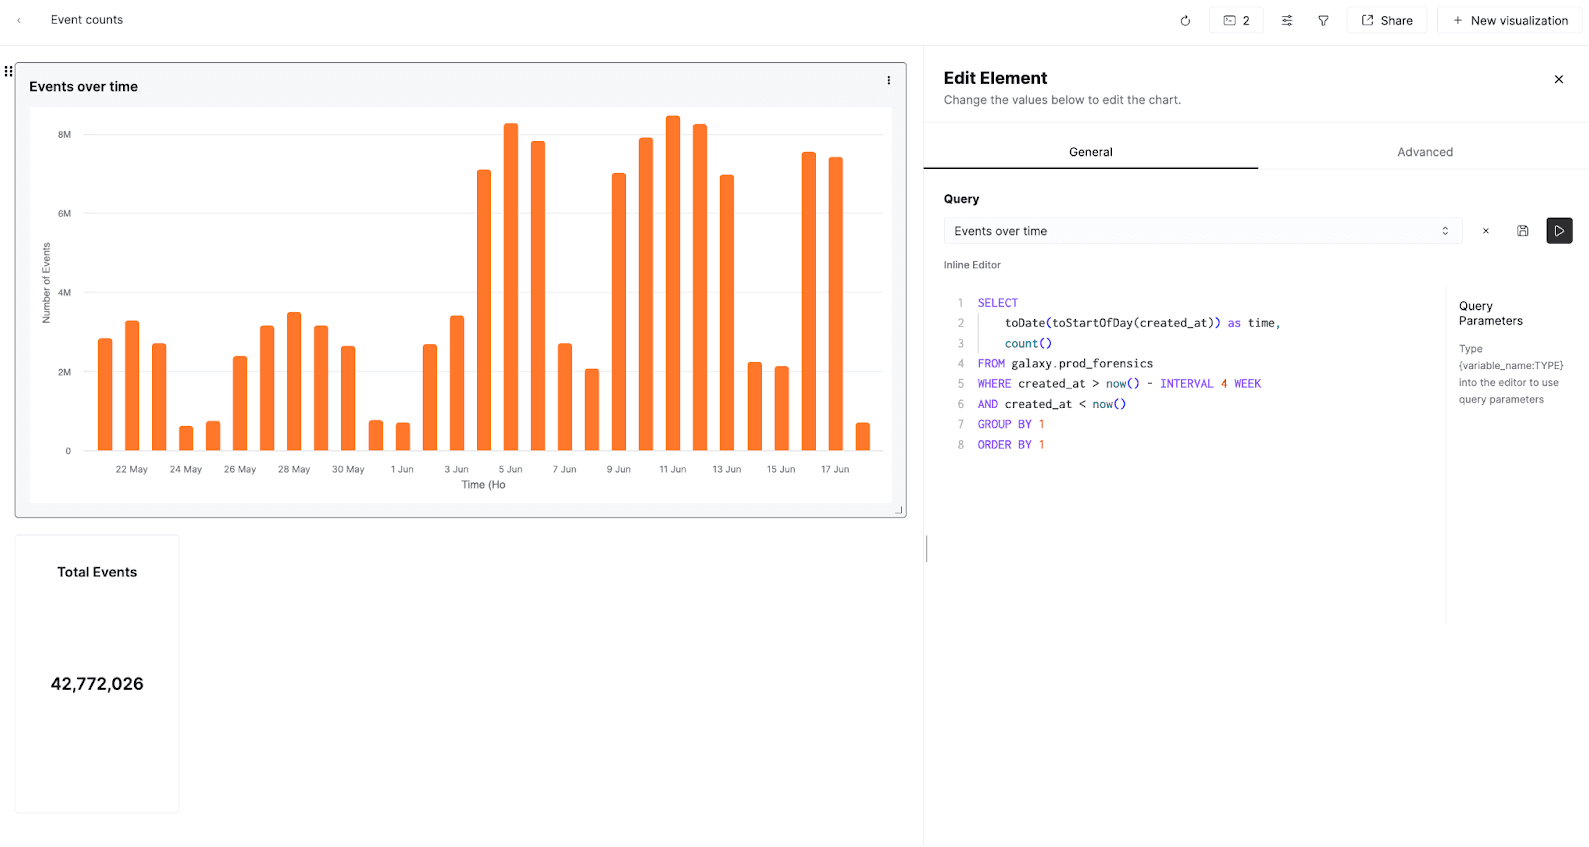
A dashboard powered by the "Events over time" query
Dashboards leverage Vizhouse, the charting library powering all ClickHouse Cloud frontend applications. Vizhouse supports multiple visualization types including tables, bar charts, line charts, pie charts, and more. We also added helper elements like spacer bars and text boxes to help users organize and annotate their dashboards.
Using ClickHouse Query Parameters, dashboards can be made interactive. In addition, after significant user demand, we introduced three permission levels, allowing dashboard creators to share their work with view-only users.
Tracking launch and adoption #
When we launched Dashboards, we prioritized detailed telemetry to understand user behavior. We accomplished this with just two tables.
We use ClickHouse to store frontend logs, capturing clicks, query runs, dashboard creations, visualization creations, and more. All events are stored in a single ClickHouse table called forensics_v2:
1CREATE TABLE forensics_v2
2(
3    `created_at` DateTime('UTC') DEFAULT now(),
4    `environment` LowCardinality(String),
5    `session_id` Nullable(String),
6    `request_id` Nullable(String),
7    `server_ip` Nullable(IPv4),
8    `org_id` Nullable(UUID),
9    `user_id` Nullable(String),
10    `namespace` Nullable(String),
11    `component` Nullable(String),
12    `event` String,
13    `interaction` LowCardinality(String),
14    `payload` Nullable(String),
15    `message` Nullable(String)
16)
17ORDER BY created_at;
A separate table stores demographic information about each organization, which we join to the events table for enrichment with customer names, cohorts, and other attributes. Our product analytics for this feature launch relied primarily on these two tables.
The scale of our analysis demonstrates ClickHouse's power. Our query tracking dashboard query scans 144 million rows in under 1.5 seconds. The only ETL required was importing frontend logs into ClickHouse – all further processing of the data was accomplished via simple SELECT queries that are run every time the dashboard is loaded.
1SELECT uniq(user_id)
2FROM forensics_v2
3WHERE namespace = 'dashboards'
4AND component = 'general'
5AND event = 'createDashboard';
Query to calculate total number of users who created a dashboard. Read: 18,992,795,602 rows (254.48 GB); Elapsed: 3.748s.
We identified a couple key performance indicators to track, including the number of users creating dashboards, users viewing dashboards, and query runs. We defined these KPIs using SQL and saved them as queries to support our data model.
With our queries in place, I created a dashboard to visualize these KPIs and identify our most active dashboard users. This data helped us prioritize our roadmap and collect targeted feedback by proactively reaching out to power users.
Common use cases #
During our six-month beta period, three primary use cases emerged:
-
Simple Visualizations: Dashboards enable users to create straightforward data views, often with just one or two visualizations. Users found dashboards provided easier data access compared to running queries in the SQL console.
-
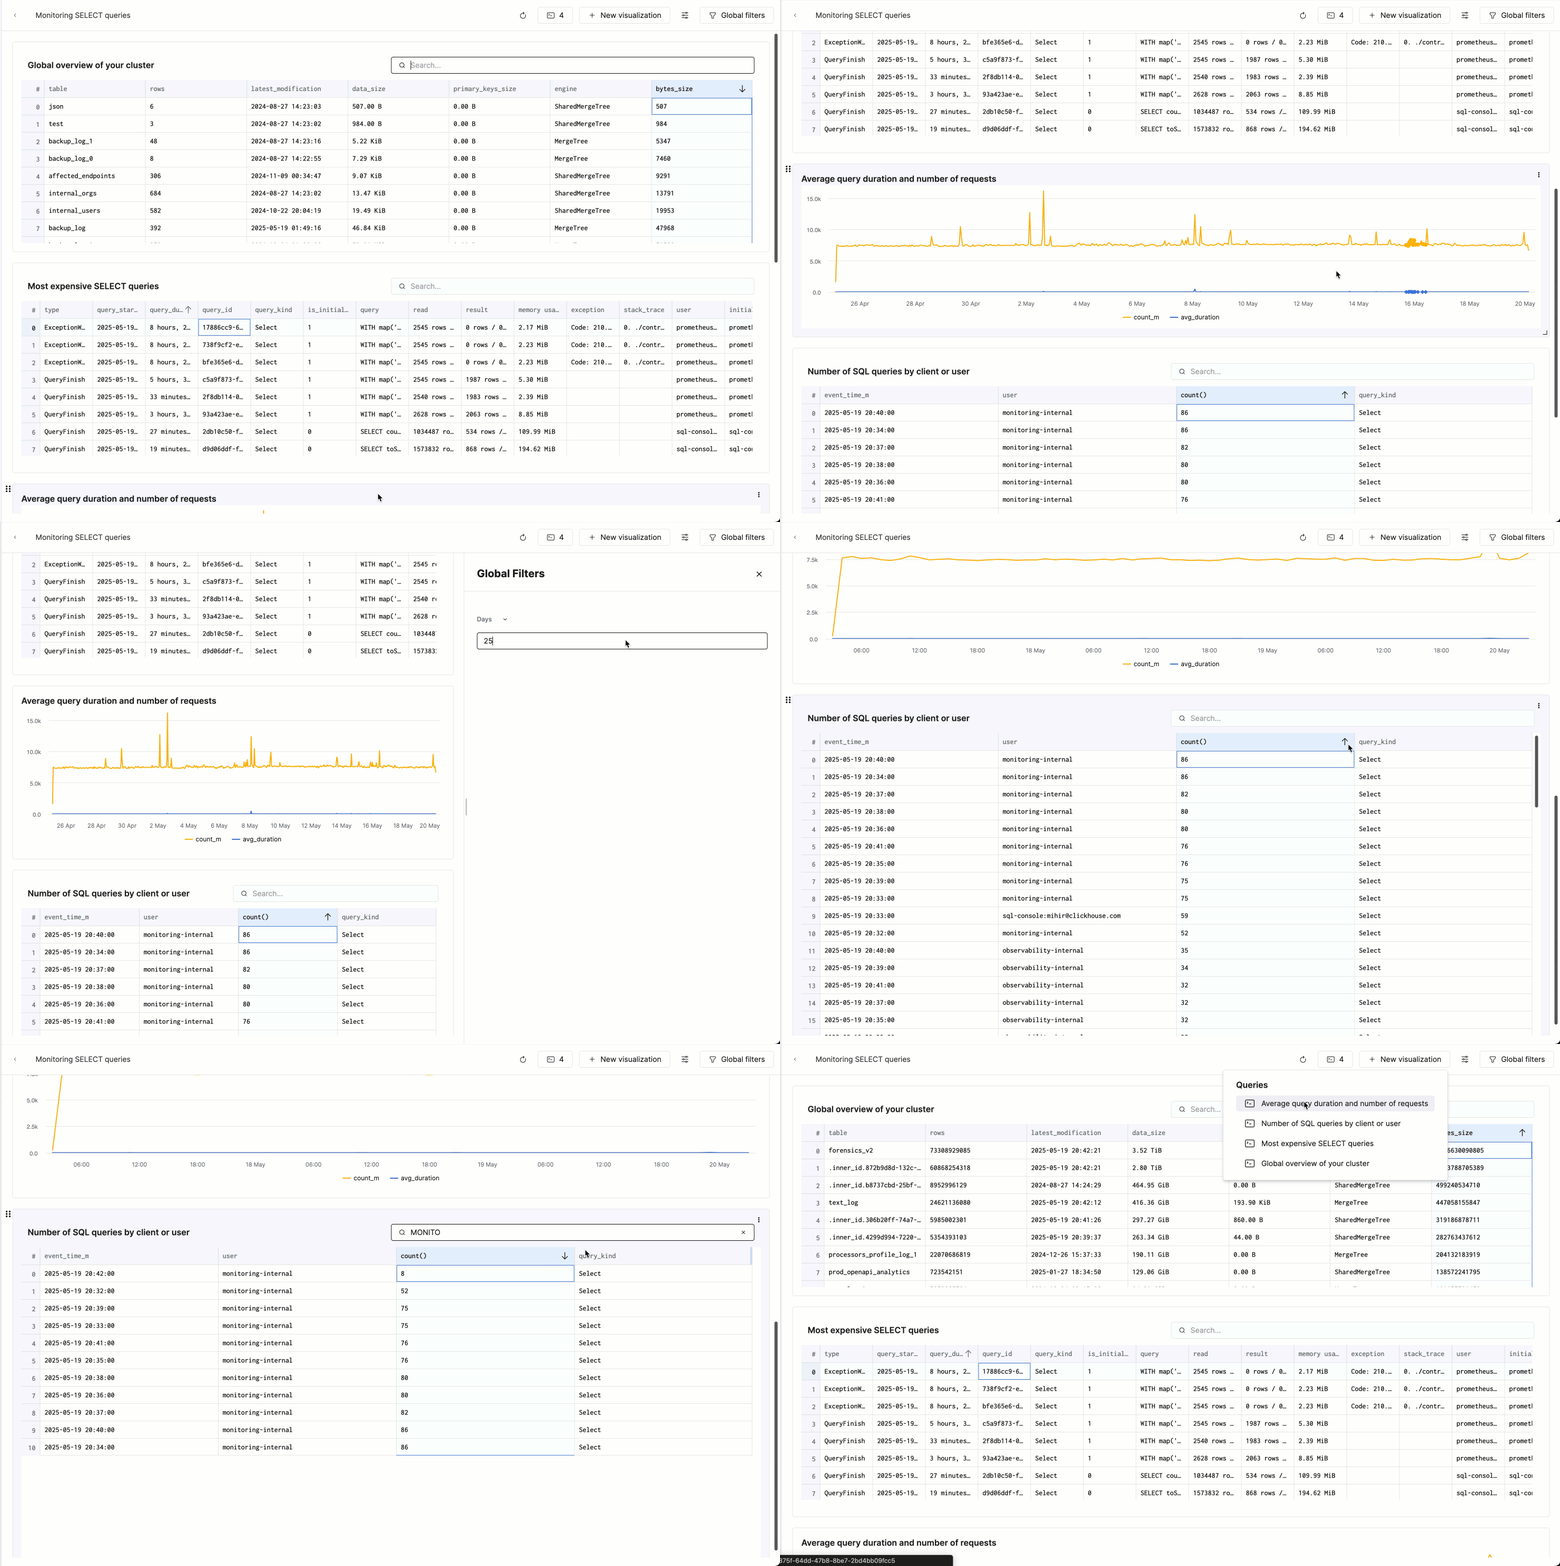
Monitoring: ClickHouse's system tables are powerful monitoring tools. Many users created queries against these system tables to build monitoring dashboards for their ClickHouse services, supplementing existing monitoring tools.

- Feature Usage Analytics: Similar to our own adoption analysis, many users leveraged Dashboards for product analytics on logs and events data. Users who were comfortable writing SQL found it easier to share insights with teammates who were less comfortable with SQL.
Future roadmap #
Looking ahead, our dashboard roadmap focuses on three key areas:
-
Enhanced Visualizations: We're improving the core dashboard experience by adding visualization options like dimensions and expanding chart types.
-
AI Integration: Given AI's proficiency with SQL and the existing possibility of using MCP with ClickHouse, we plan to integrate an intelligent "business analyst" capability that can create and analyze dashboards within the SQL console.
-
Embeddable/Public Dashboards: We're developing functionality to allow users to embed dashboards directly into their applications.


