Core concepts
Query sharing
To share your dashboard with colleagues, be sure to share the underlying saved query. To view a visualization, you must have, at a minimum, read-only access to the underlying saved query.Interactivity
Use query parameters to make your dashboard interactive. For instance, you can add a query parameter to aWHERE clause to function as a filter.
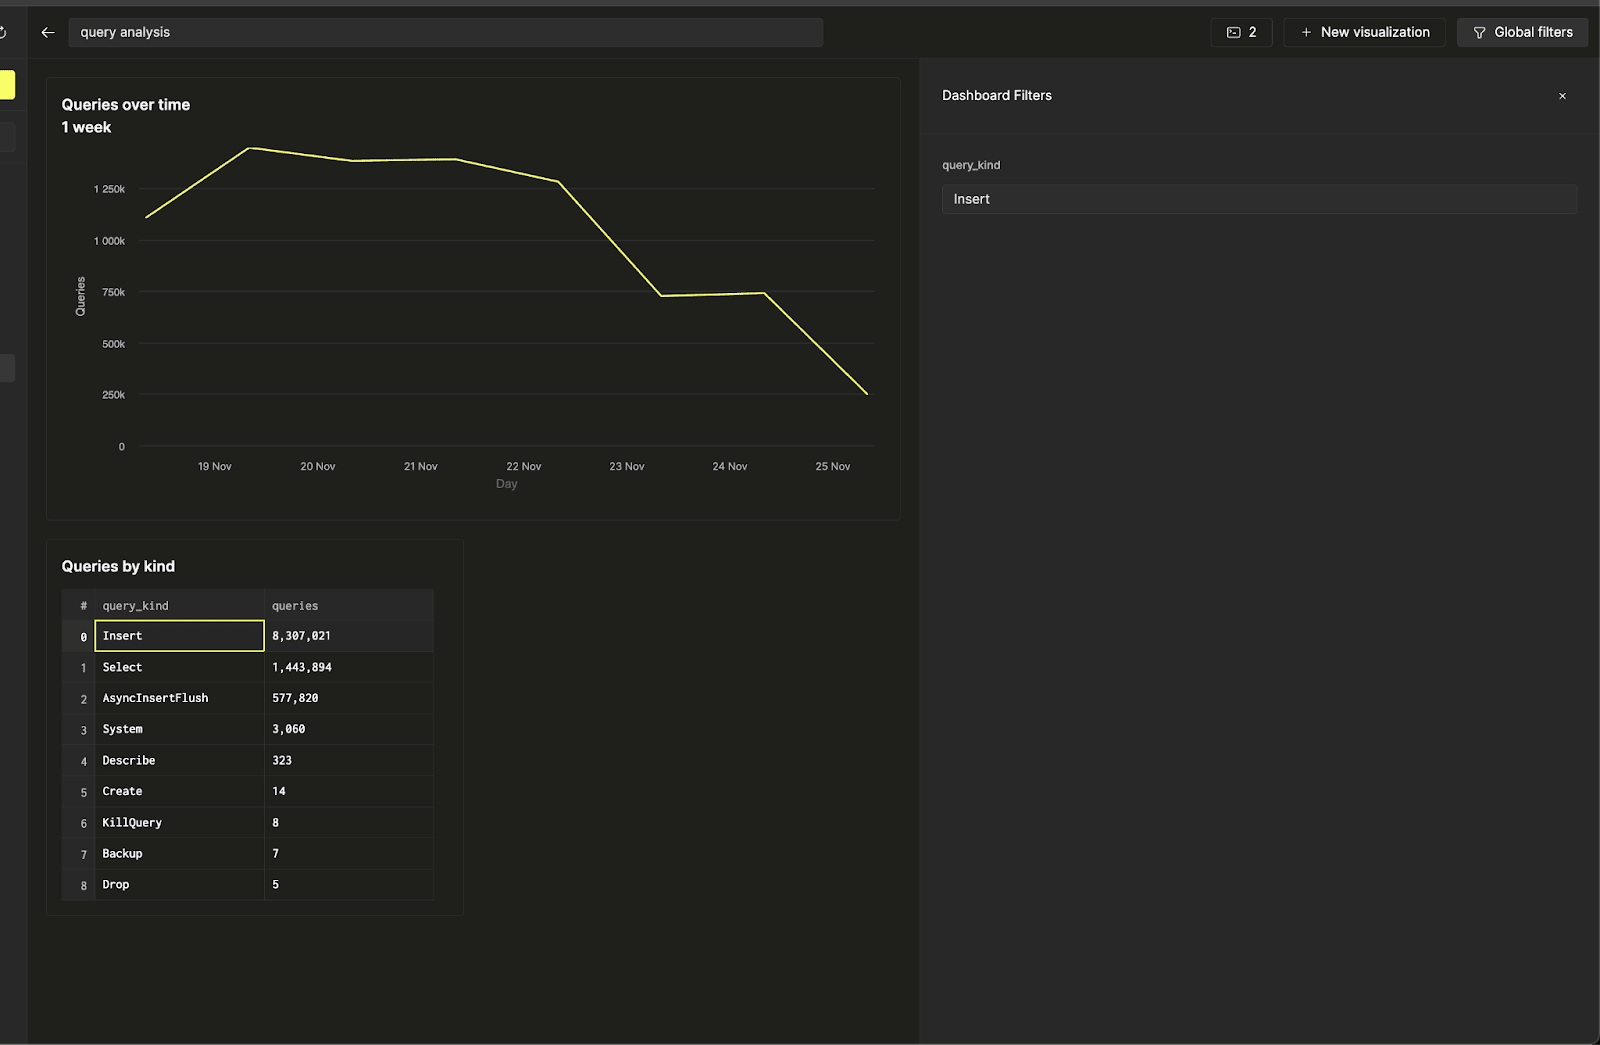
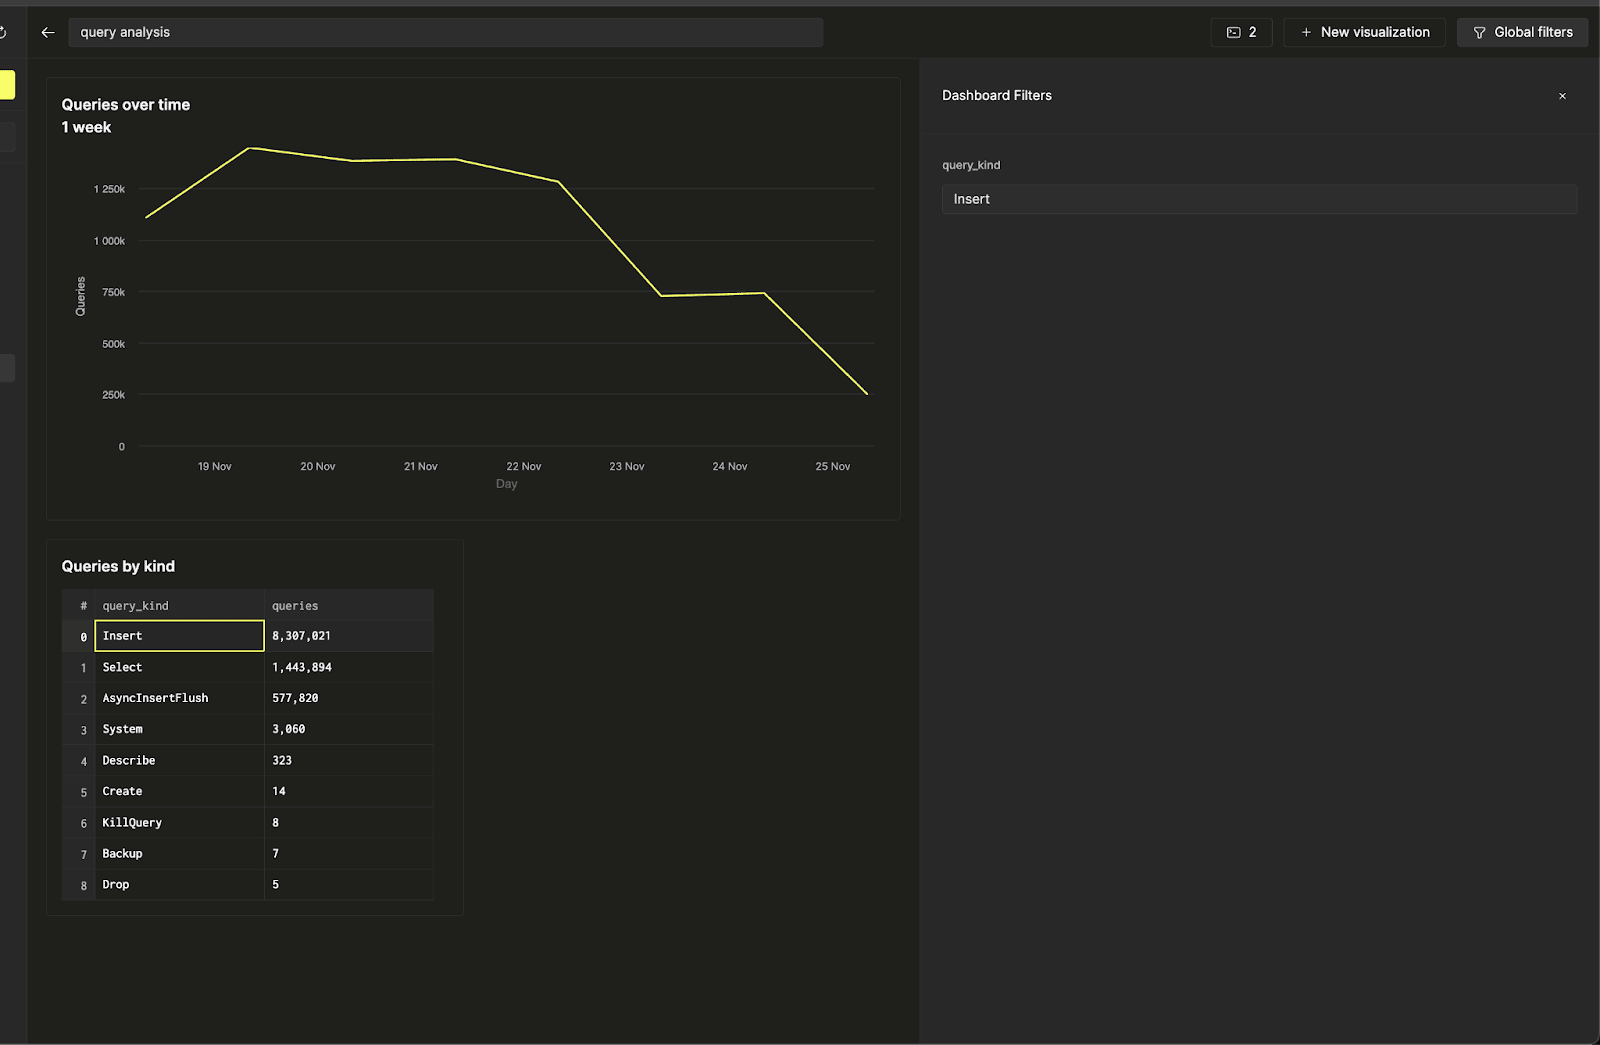
You can toggle the query parameter input via the Global filters side pane by selecting a “filter” type in the visualization settings. You can also toggle the query parameter input by linking to another object (like a table) on the dashboard. Please see the “configure a filter” section of the quick start guide below.
Quick start
Let’s create a dashboard to monitor our ClickHouse service using the query_log system table.Quick start
Create a saved query
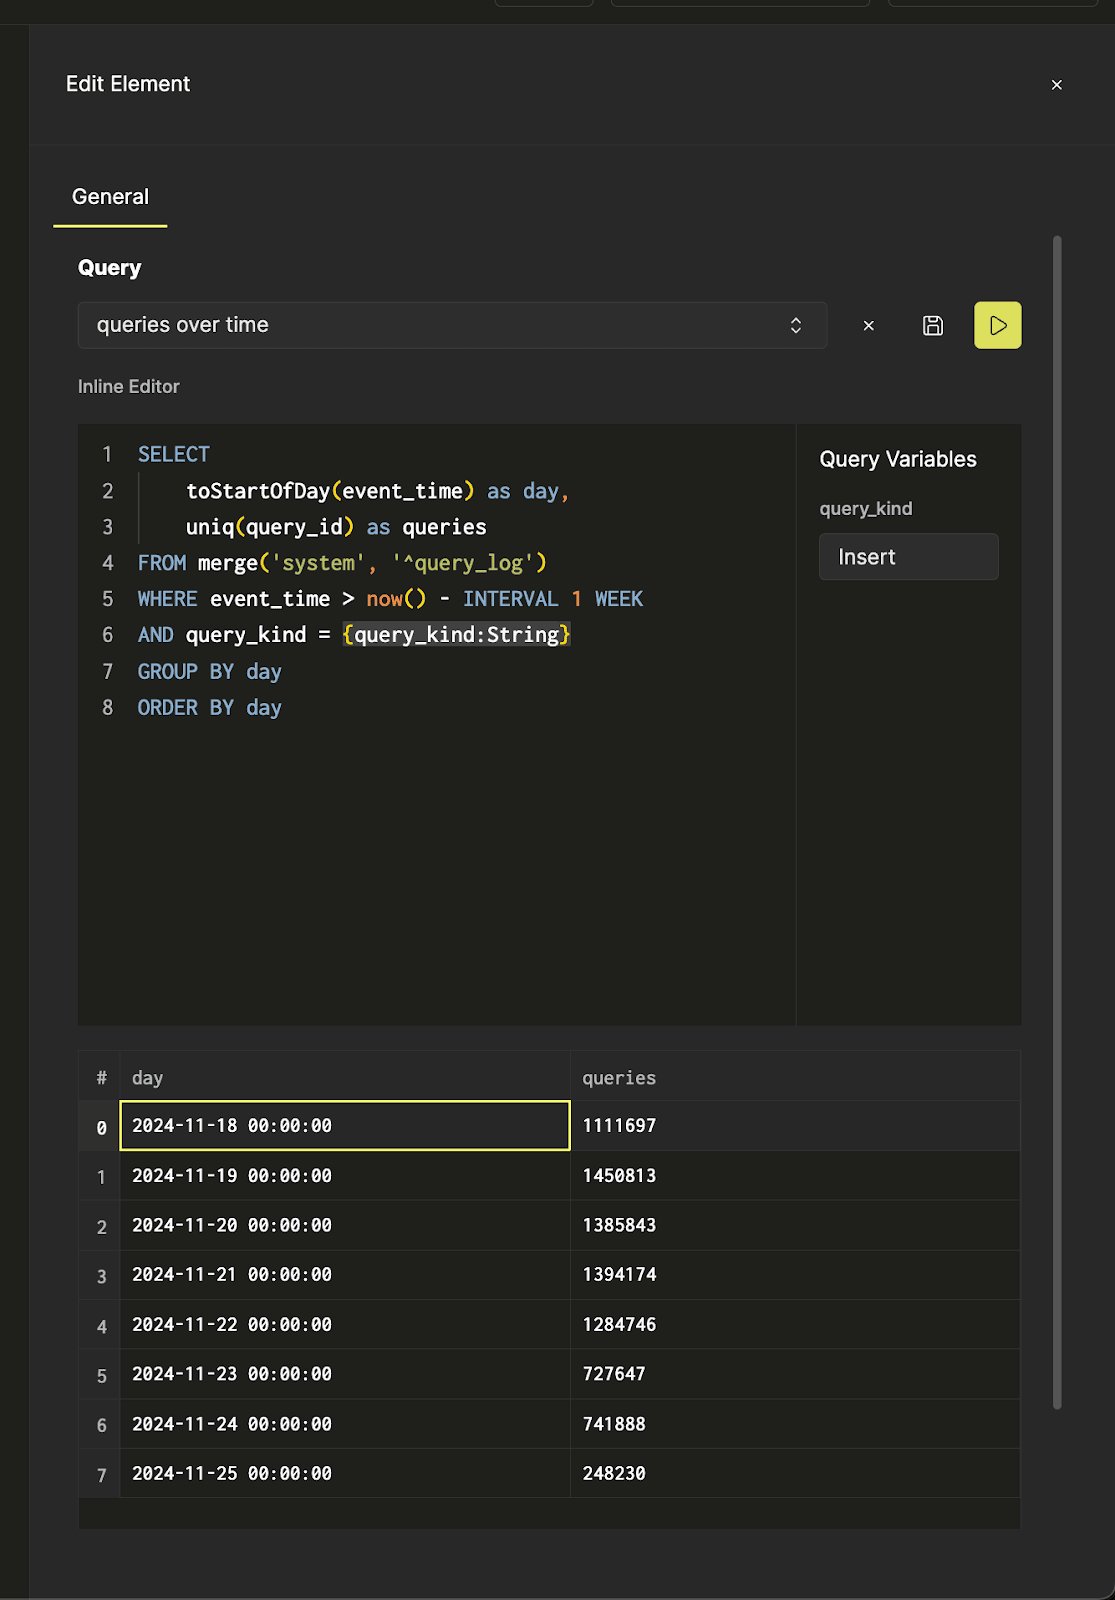
If you already have saved queries to visualize, you can skip this step. Open a new query tab. Let’s write a query to count query volume by day on a service using ClickHouse system tables: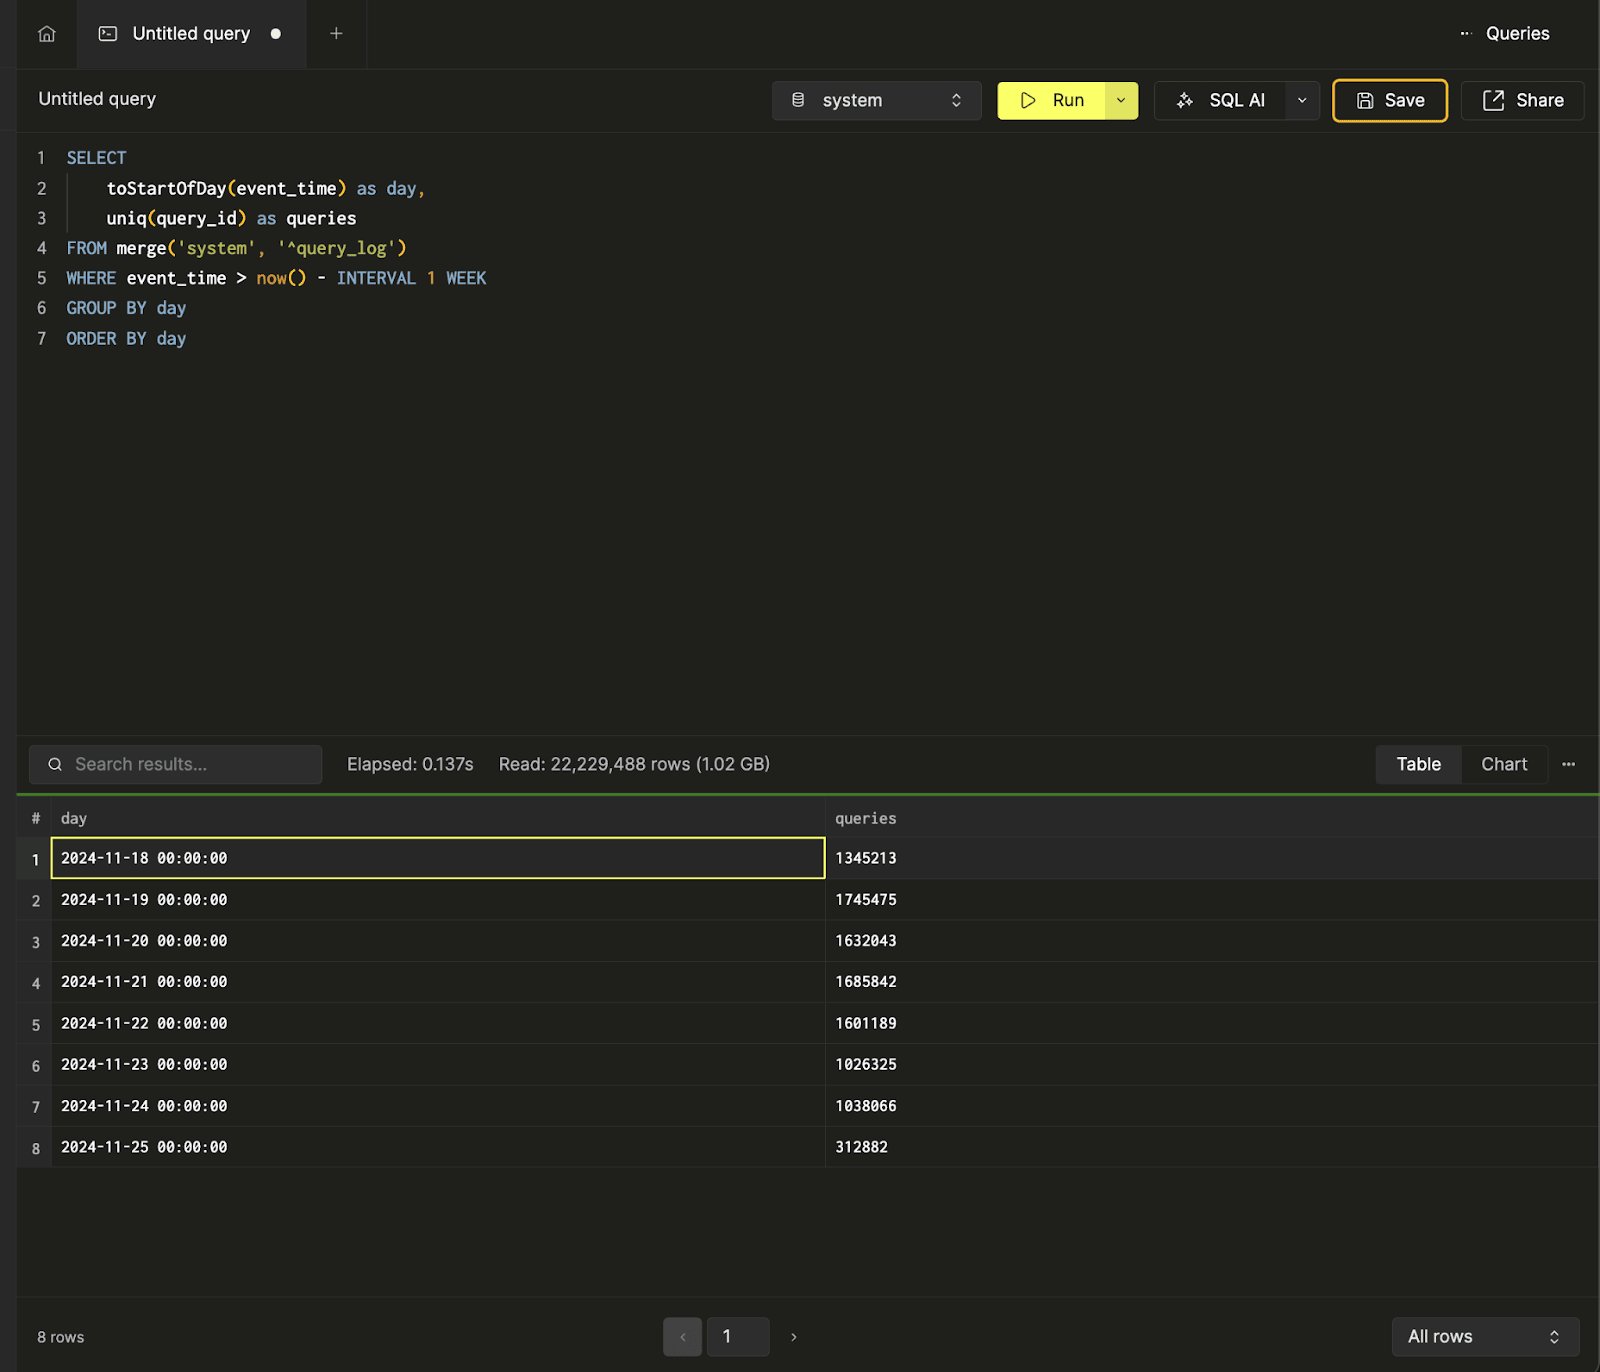
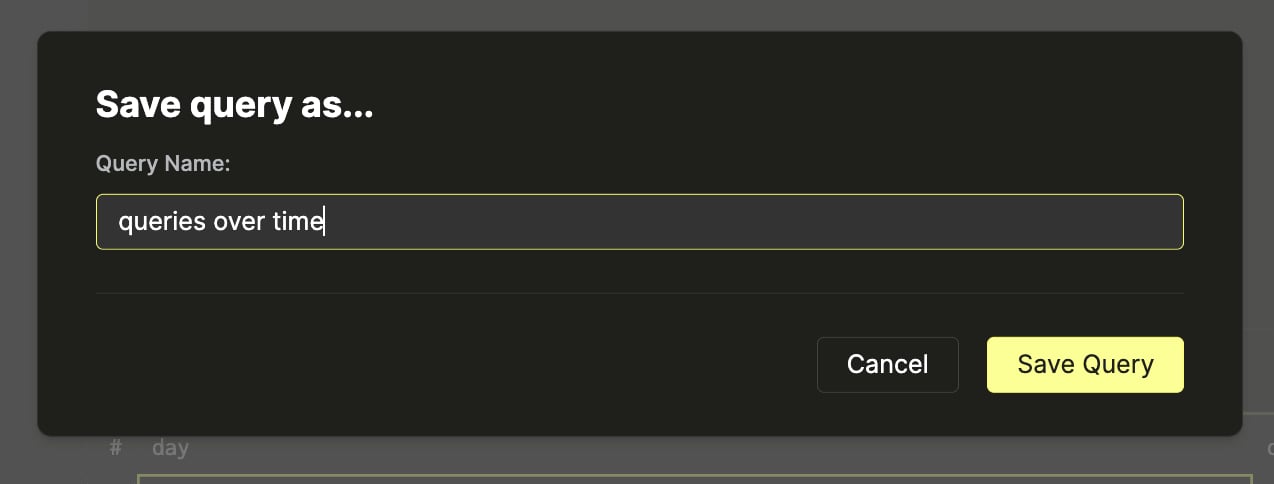
queries over time:
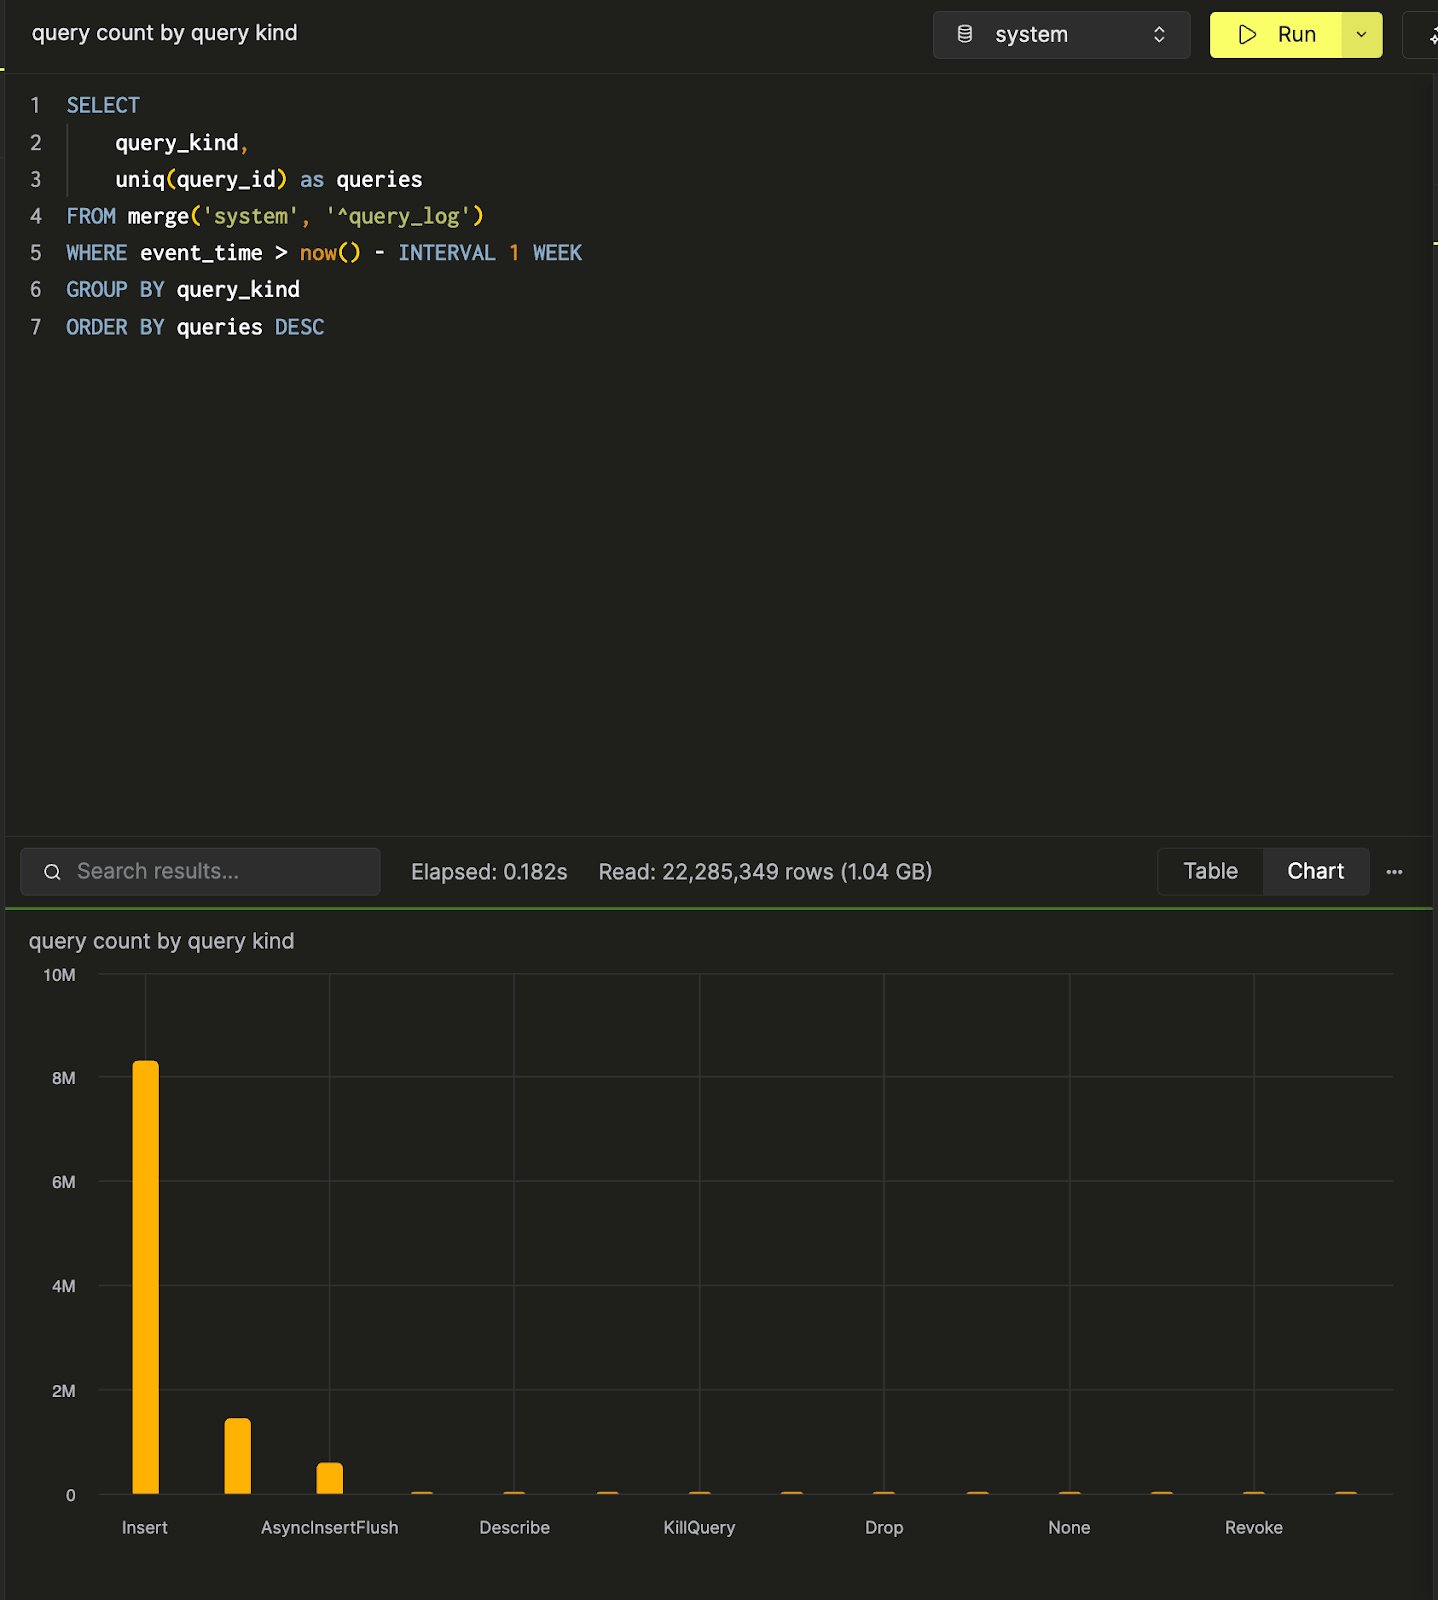
query count by query kind, to count the number of queries by query kind. Here’s a bar chart visualization of the data in the SQL console.
Create a dashboard
Navigate to the Dashboards panel, and hit “New Dashboard”. After you assign a name, you’ll have successfully created your first dashboard!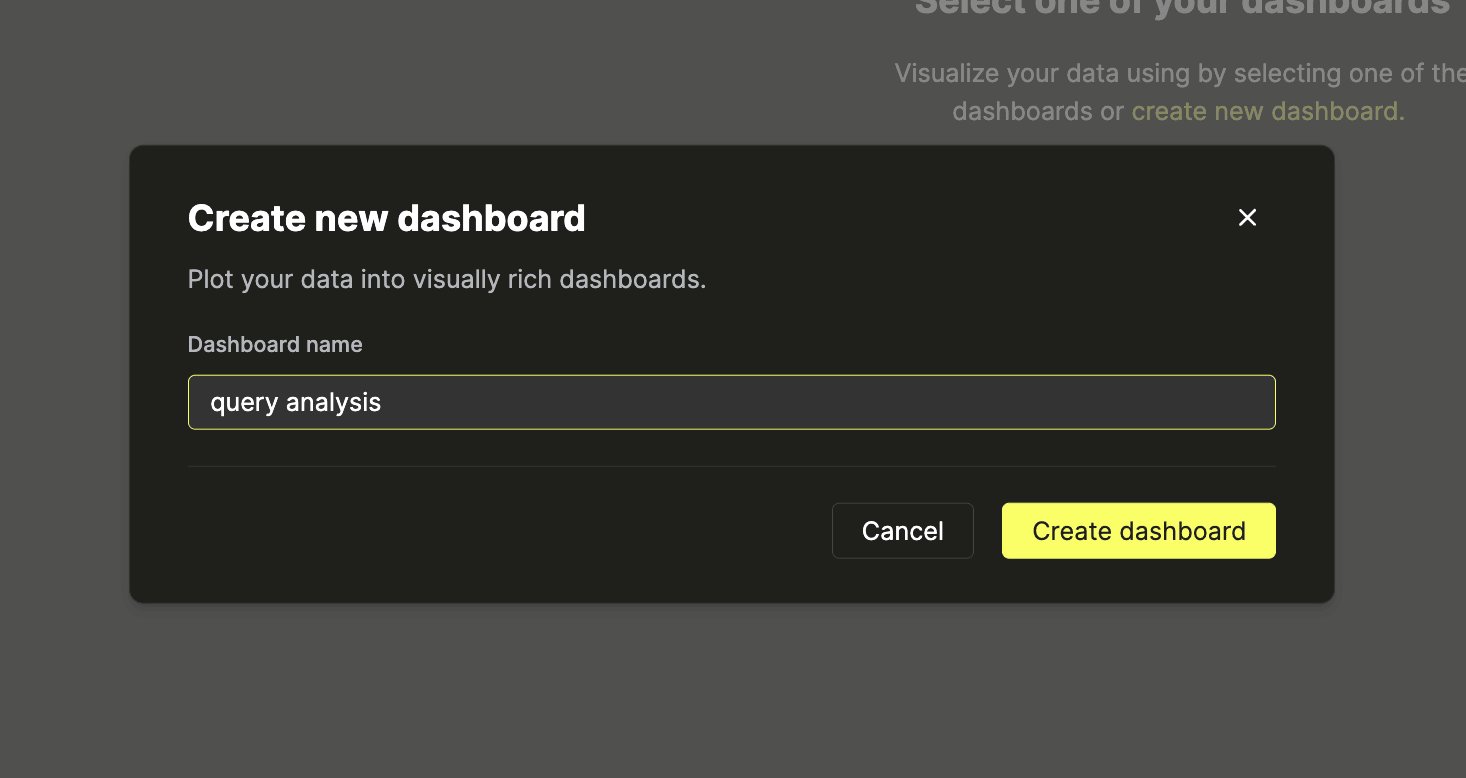
Add a visualization
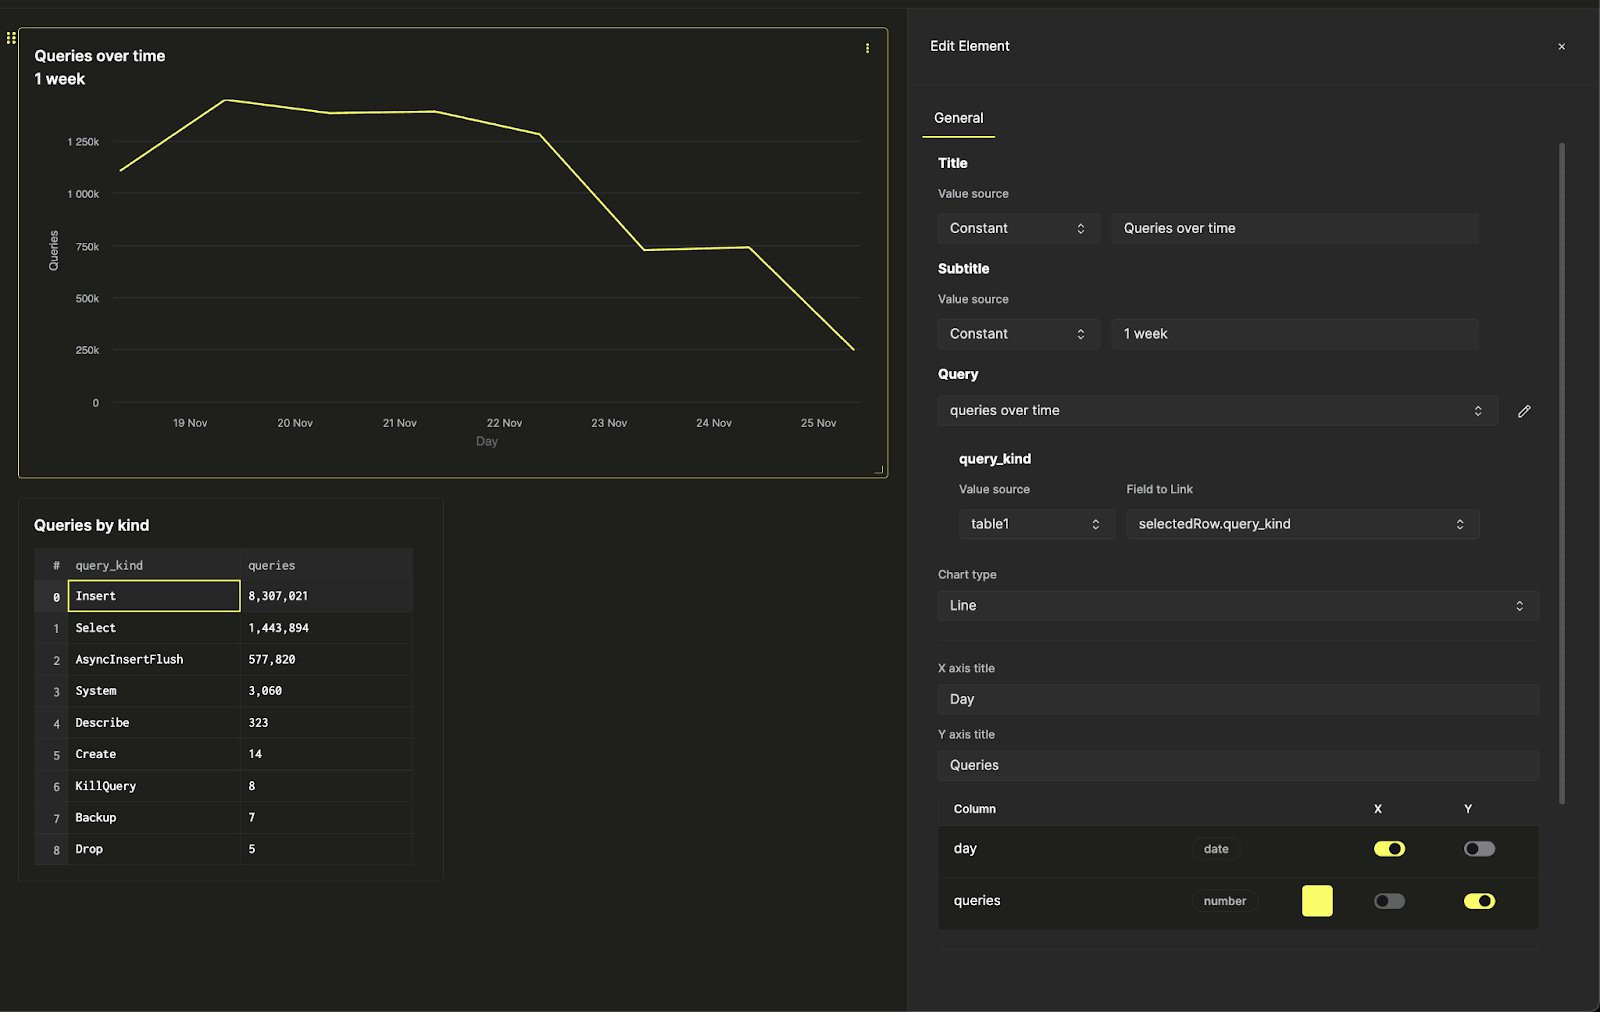
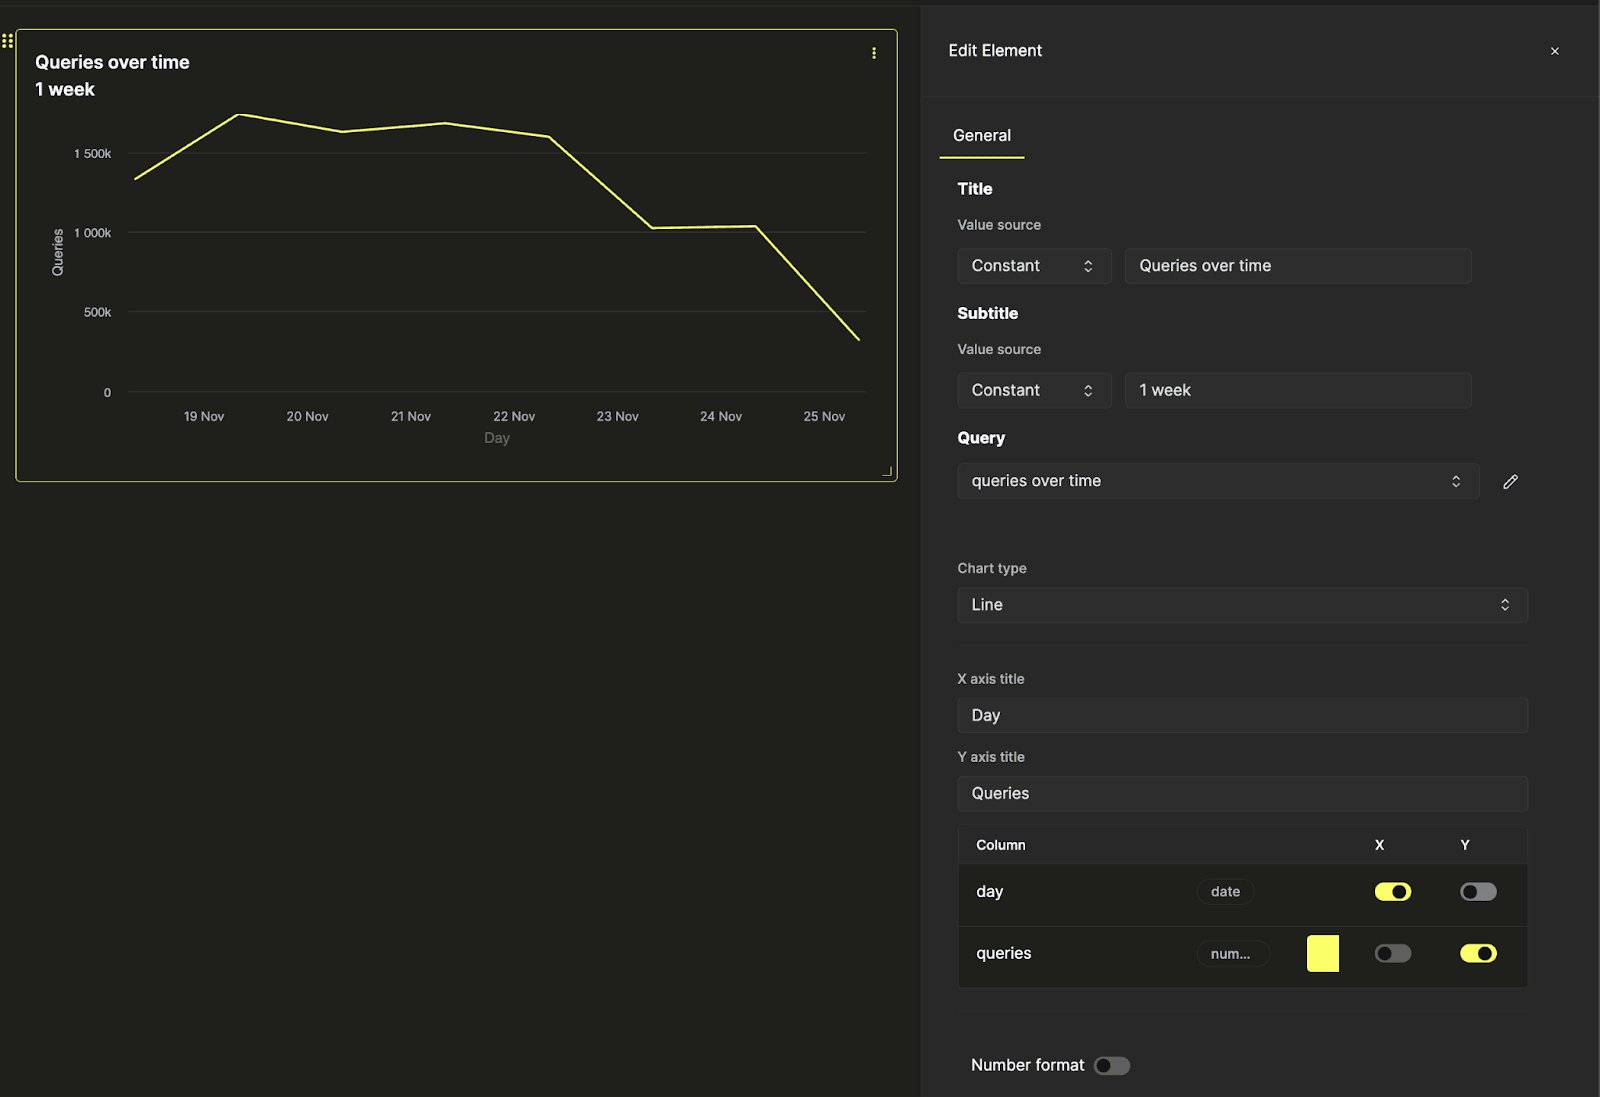
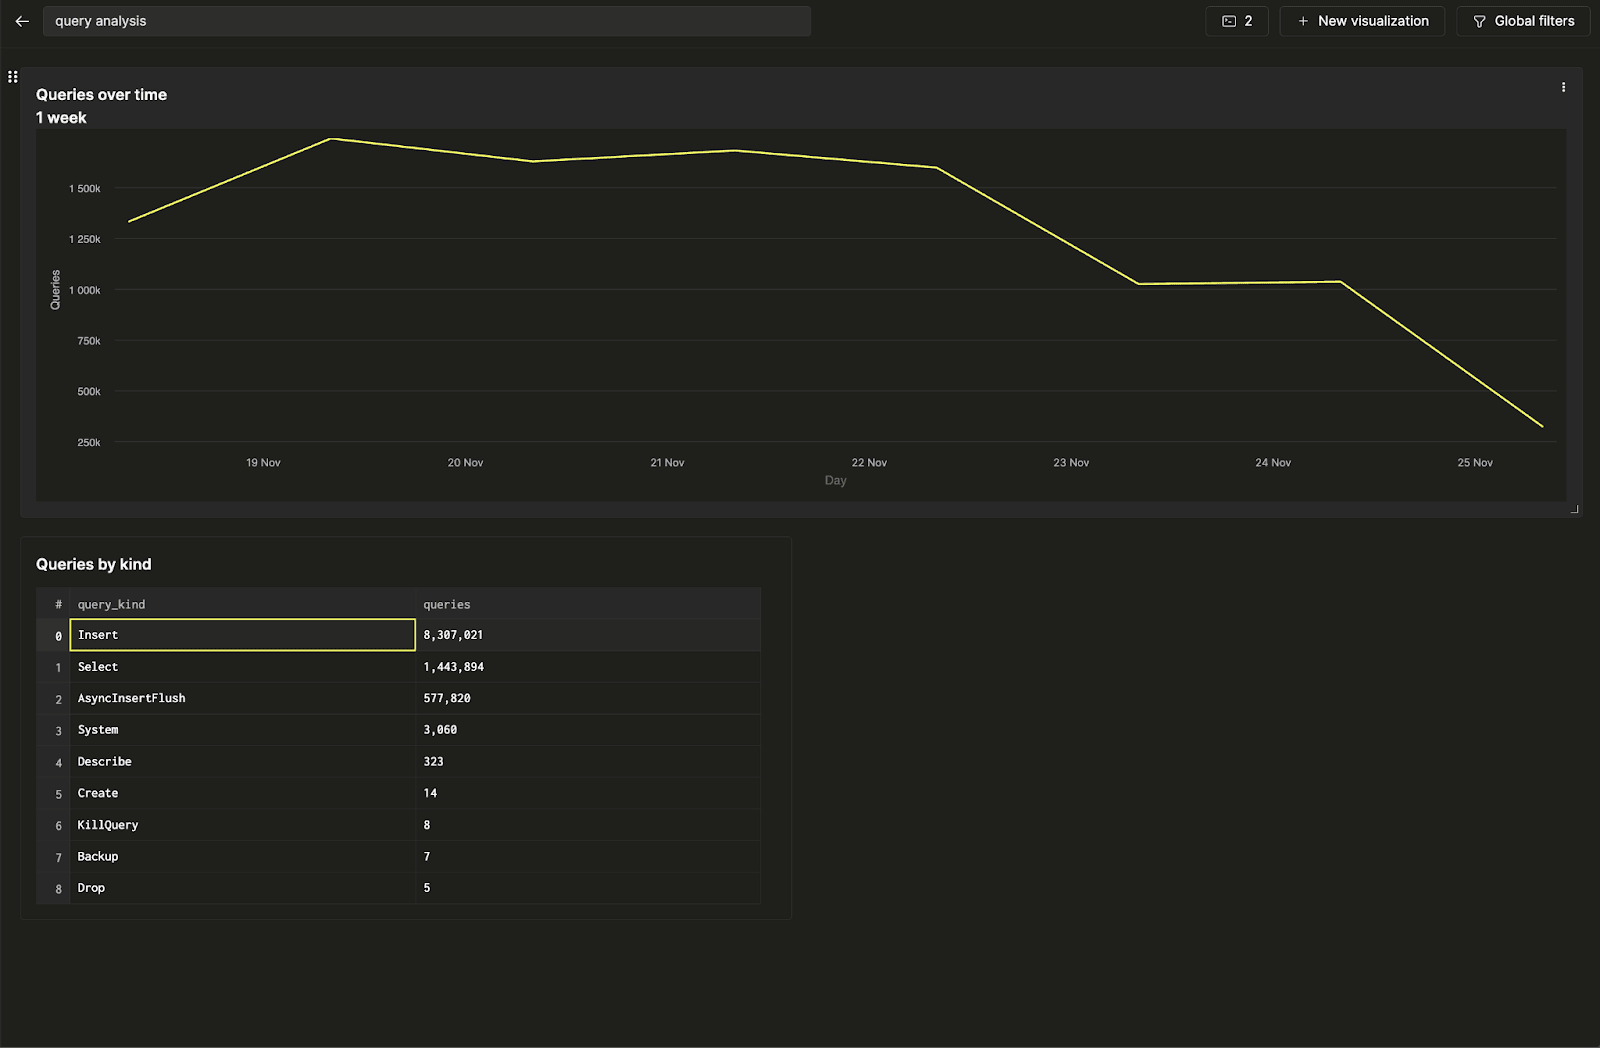
There’s two saved queries,queries over time and query count by query kind. Let’s visualize the first as a line chart. Give your visualization a title and subtitle, and select the query to visualize. Next, select the “Line” chart type, and assign an x and y axis.
Configure a filter
Let’s make this dashboard interactive by adding a filter on query kind so you can display just the trends related to Insert queries. We’ll accomplish this task using query parameters. Click on the three dots next to the line chart, and click on the pencil button next to the query to open the in-line query editor. Here, we can edit the underlying saved query directly from the dashboard.