Introduction
As the world’s fastest analytical database, we are always looking for tools that help our users quickly and easily realize their dream of building applications on top of ClickHouse. So when Hex.tech announced the availability of ClickHouse as a data source, we were excited to see the potential for building real-time analytics applications.
In previous posts, we explored the ClickHouse native tool git-import. Distributed with ClickHouse, this tool is capable of producing the full commit history of any git repository - including file and line changes. While historically, we’ve used this tool for analyzing selective repositories, including ClickHouse and Grafana, we had larger aspirations. With some simple scheduling code, a worker pool, and a lot of disk space, we wanted to collect the full commit history for the top 50k most popular (stars) repositories on GitHub - around 10TB of data. Using this dataset, we hoped to build a simple application allowing users to obtain insights on any selected repository in real-time.
In this blog post, we explore how we collected data and built a simple proof of concept for our application “ClickHub” using Hex.tech. As part of this journey, we utilized our recently added KeeperMap table engine, to which we made improvements to simplify our solution.
Given the volumes of data being potentially inserted, we used a production instance of ClickHouse Cloud for our application, as the production instances scale resources as you need them. The code used for this demo has been made publicly available and could easily be run to collect a smaller number of repositories, thus allowing it to be reproduced on a smaller self-managed or development Cloud instance. The Hex notebook is also publically accessible, allowing readers to see the ClickHouse queries and visualization configurations.
If you do want to dive deeper into this dataset and reproduce the application, ClickHouse Cloud is a great starting point - spin up a cluster and get $300 of free credit, load the data, let us deal with the infrastructure, and get querying! Hex additionally offers a 14-day trial should you wish to copy the application.
What is Hex?
Hex is a modern Data Workspace. It makes it easy to connect to data, analyze it in collaborative SQL and Python-powered notebooks, and share work as interactive data apps. While providing classic Python notebook capabilities, popular amongst data scientists, users can also connect to external data sources such as ClickHouse and publish notebooks as lightweight applications.
By exposing variables from the results of user input, e.g., dropdowns, or potentially Python code and other SQL results, users can construct dynamic queries and use them with ClickHouse. ClickHouse result sets are returned as data frames, easily rendered in visualizations with no need to write any code.
We increasingly see users exploiting the notebook capabilities of Hex for ad-hoc analysis of data in ClickHouse. Users can rapidly analyze TB or even PB of data by pushing down computationally expensive queries, such as aggregations, to ClickHouse. With ClickHouse performing the heavy lifting and returning compact result sets as data frames in milliseconds, Hex users are able to focus on Python-based analysis and data science tasks.
ClickHouse users looking to build real-time applications may be particularly interested to learn that Hex also supports arranging elements from the notebook into an interactive app and publishing this for external use. This capability was exactly what we needed for our “Github analytics” application.
From our testing, we recommend using Hex mainly for proof-of-concept work, notebooks, and internal-facing analytical applications. As Hex continues to enhance features, we expect this to evolve into a fully-fledged interactive application builder.
Data Collection
Users with ClickHouse installed will immediately have access to the git-import tool. This command line utility generates three files: commits.tsv, file_changes.tsv, and line_changes.tsv when run in the root directory of any cloned repository. The contents of these files are handily explained by the tool's inbuilt help:
ClickHouse % clickhouse-git-import -h
A tool to extract information from Git repository for analytics.
It dumps the data for the following tables:
- commits - commits with statistics;
- file_changes - files changed in every commit with the info about the change and statistics;
- line_changes - every changed line in every changed file in every commit with full info about the line and the information about previous change of this line.
The largest and the most important table is "line_changes".
Run this tool inside your git repository. It will create .tsv files that can be loaded into ClickHouse (or into other DBMS if you dare).The generated TSV files provide a detailed history of the repository and can be indexed directly into ClickHouse using the client, assuming the tables have been created (note clickhouse-git-import provides the schemas required via help):
clickhouse-client --query 'INSERT INTO git.commits FORMAT TSV' < commits.tsvYou can generate this data for any repository on Github and analyze your own projects using the questions here for inspiration. If you don't have time to generate the data yourself, we've loaded our own data for ClickHouse into sql.clickhouse.com (note the database is git_clickhouse) so our community can play with some example queries.
Our aspiration to collect the top 100k repositories on Github requires a little more work. For this, we utilize a queue-worker model where each job represents a repository. Workers claim jobs/repos off this queue, clone the associated repository (if it doesn't exist on disk), invoke git-import, and index the data into ClickHouse. In our simple approach, the workers share a common disk. If a repository has been previously indexed and thus already cloned, we simply run a git pull, only ever inserting the differences on the main branch. This sharing of the disk, and cloned repositories, avoids unnecessary re-cloning and network/disk IO. The above process is visualized below:
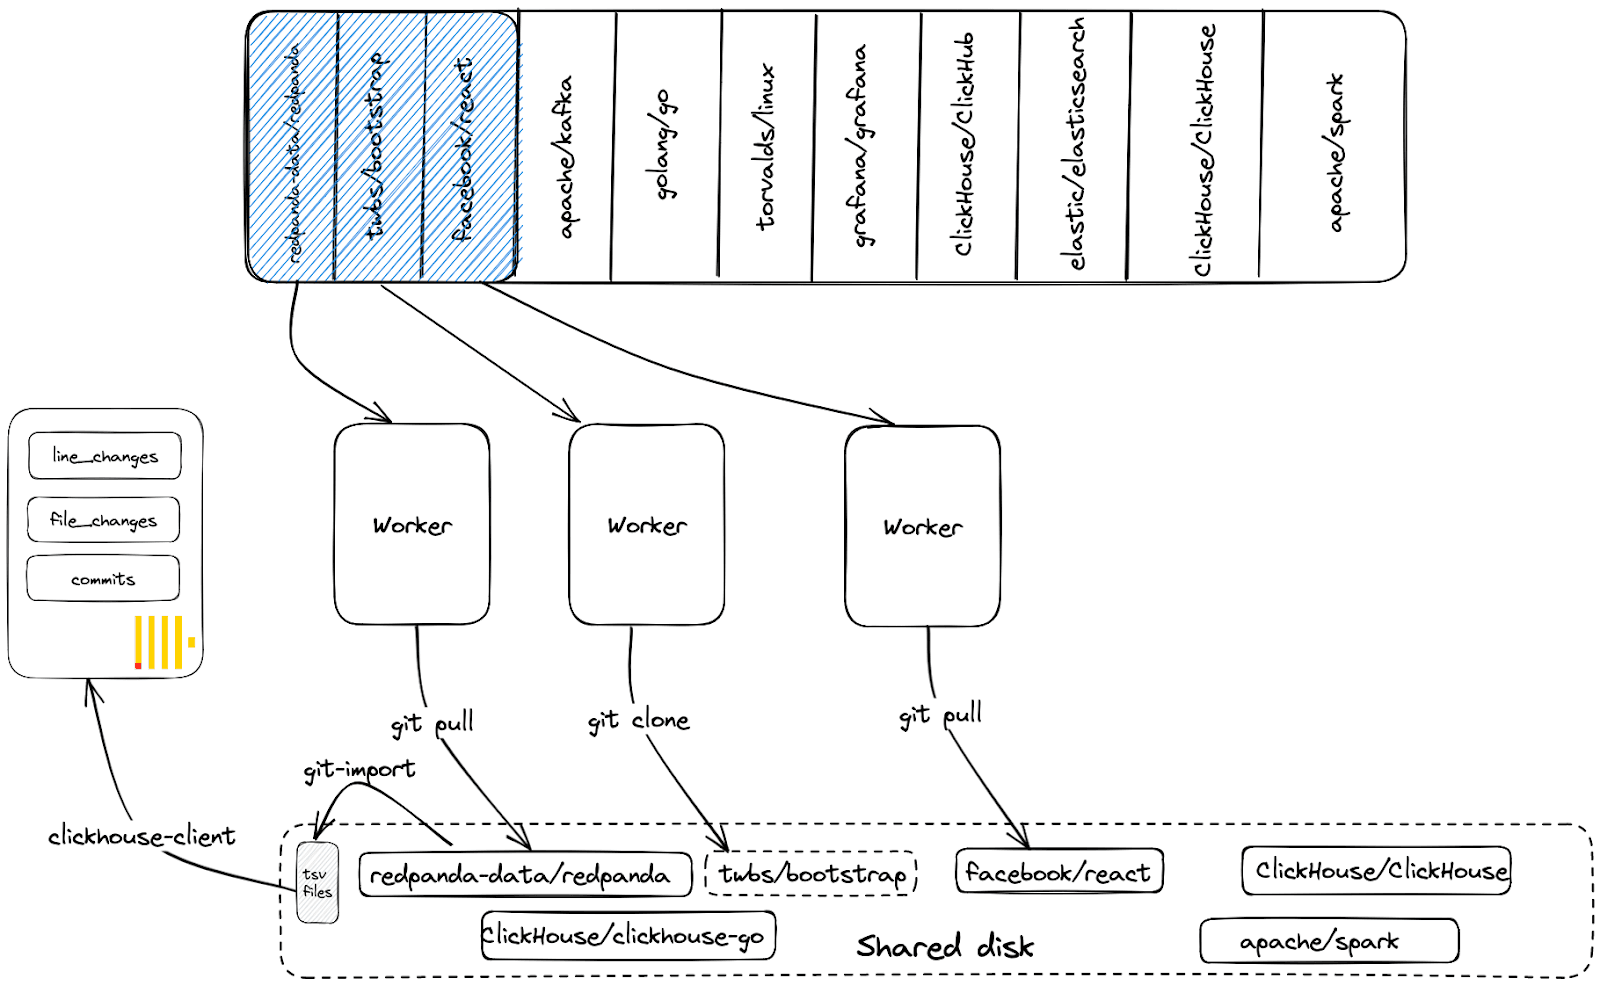
Provided we have sufficient compute and disk resources, we can scale this approach by simply adding more worker processes.
Using the KeeperMap Table Engine
With this approach, a repository should only ever be processed by one worker at any moment in time. Two workers cloning the same repository, or running git-import, at the same disk location, would likely result in errors and inconsistencies. Furthermore, we may wish to prioritize some jobs/repositories above others and ensure these are processed first by workers.
To achieve the above, we wanted our queue to:
- Prohibit duplicate jobs (keyed off repository name) from being scheduled
- Ensure that a job is only ever claimed by one worker
There are many queuing technologies that could be configured to address this - Amazon SQS, for example. Wanting to keep dependencies minimal, however, as well as to push the boundaries of ClickHouse, we decided to see if we could model a queue using a table powered by the KeeperMap engine. This engine utilizes a ClickHouse Keeper instance under the hood, offering a consistent key-value store with linearizable writes and sequentially consistent reads. This engine type is also enabled in Cloud, allowing us to write our application with no dependencies besides ClickHouse.
While Keeper Map gave us linearizable writes and sequentially consistent reads, there was no means of achieving atomic updates - required for a worker to claim a job exclusively. For example, consider the table schema for our queue.
CREATE TABLE git.work_queue
(
`repo_name` String,
`scheduled` DateTime,
`priority` Int32,
`worker_id` String,
`started_time` DateTime
)
ENGINE = KeeperMap('git_queue')
PRIMARY KEY repo_nameNote how the repo_name is the unique primary key. Assuming jobs are queued with worker_id being empty, a worker needs to set the worker_id column on a row to claim the job and its associated repository. This can be achieved with an ALTER TABLE git.work_queue UPDATE worker_id=<worker_id>, started_time=<started_time> WHERE worker_id=’’ command. At the time of initial development, KeeperMap had no guarantees that an update to a row would be atomic, potentially allowing two workers to claim the job. Furthermore, we needed to ensure no repository could be inserted on the queue more than once - ensuring only one row existed for any single repository. Once a job is completed and the data for a repository is updated in ClickHouse, the row can be deleted.
After speaking with our development team (thanks Antonio Andelic) and a few PRs later, ClickHouse now has keeper_map_strict_mode. When set to true, this:
- Prevents a row identified by the primary key (repo_name) from being inserted more than once. Attempts to do so cause an exception.
- Fetching and updating of a row via ALTER will succeed only if it's executed atomically, i.e., the version hasn't changed between the operations.
- Deleting rows requires a fetch and delete. Again this will only succeed if it can be done atomically.
With these properties in place, we could implement our queue. The full scheduling and worker code can be found here. We visualize the full process below:
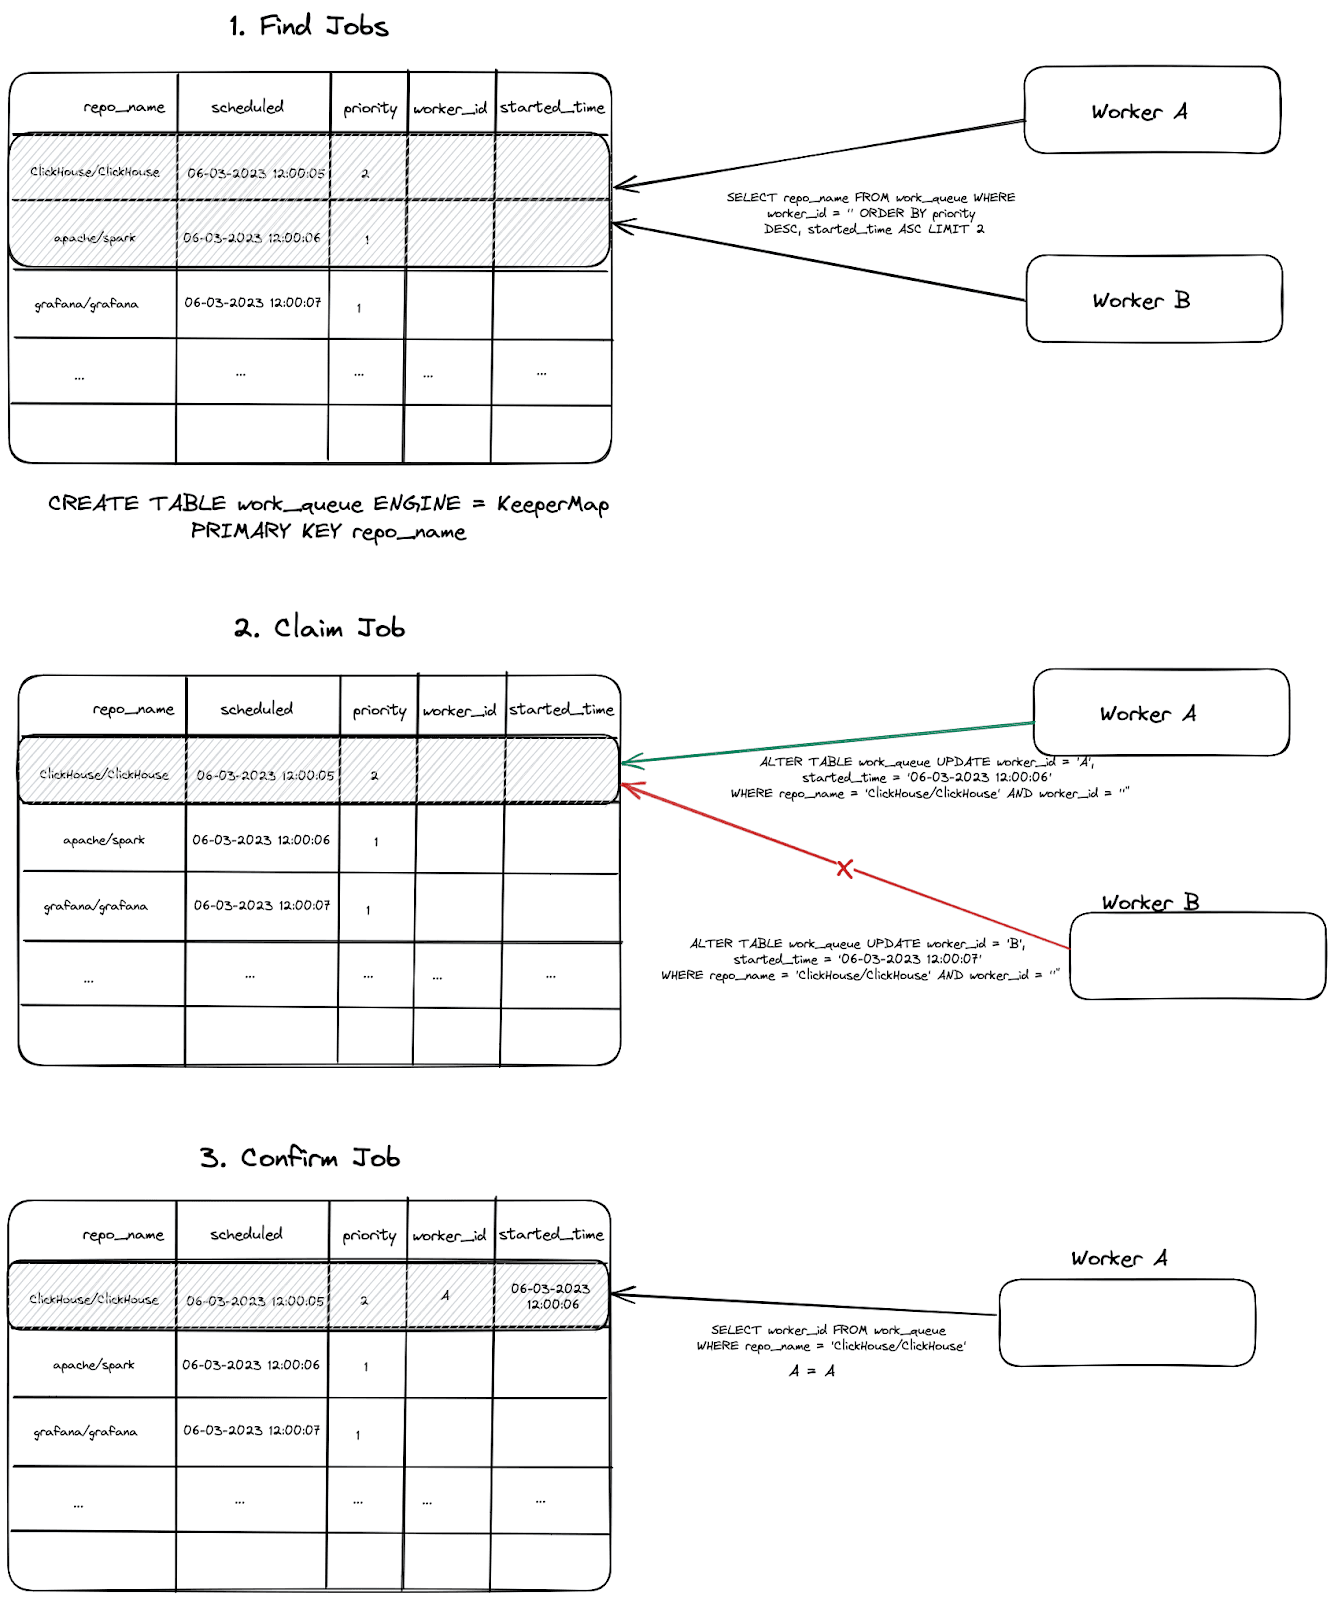
A few important notes:
- If a worker fails to issue an
ALTERon a row because another worker has succeeded first, another job is attempted. Workers attempt to claim N times before backing off and sleeping to retry later. - Once a job is completed, its row is deleted.
- The
ALTERis conditioned with a match on therepo_nameandworker_id, the latter of which must be empty. This statement will succeed if no rows match. This can happen if the job has already been claimed and theworker_idis set. On achieving a successfulALTER, we therefore also check that theworker_idis set to the value of the current worker with a simple SELECT. This is shown above as the “Confirm Job” step. - Before a worker updates a repository via a
git pull, it first checks the last commit that has already been inserted into ClickHouse. This is achieved by a query to thecommitstable to identify the latest time for the commits data. This time is then used to filter out rows i.e. onlycommits,file_changes, andline_changeswith a time greater than this value are sent to ClickHouse.
For inserting data generated by git-import, we simply use the clickhouse-client and clickhouse-local tools - see below.
A few schema tweaks
The tables commits, file_changes, and line_changes all have very distinct schemas. Rather than deciding on a database per repository (or tables with repo-identifying suffixes/prefixes), we decided to store all data for all repositories in the same three tables. This should mean we can potentially scale to millions of repositories in the future. However, the default schemas for the commits, line_changes, and file_changes tables have no column which identifies the repository name. We thus add this to the rows at insert time. Given the repository name will be the main filter in our application, we also make this the first entry in the primary key for all our tables - thus adhering to ClickHouse best practices and aligning with our access patterns. Finally, we add a updated_at materialized column which is always set to the value of now() when a row is inserted. This allows us to easily identify when repositories were last updated (we use this when keeping the data up-to-date). Below we show the schema for the commits table. Full schemas for the other tables can be found here.
CREATE TABLE git.commits
(
`hash` String,
`author` LowCardinality(String),
`time` DateTime,
`message` String,
`files_added` UInt32,
`files_deleted` UInt32,
`files_renamed` UInt32,
`files_modified` UInt32,
`lines_added` UInt32,
`lines_deleted` UInt32,
`hunks_added` UInt32,
`hunks_removed` UInt32,
`hunks_changed` UInt32,
`repo_name` LowCardinality(String),
`updated_at` DateTime MATERIALIZED now()
)
ENGINE = ReplacingMergeTree
ORDER BY (repo_name, time, hash)Note that we use a ReplacingMergeTree. This table engine removes duplicate rows (having the same primary key) asynchronously during background merges. This ensures any duplicates are eventually removed, e.g., in the event our earlier approach of using the max time of the commits in ClickHouse, to filter out already inserted rows during repository updates fails. This is eventual deduplication and should be sufficient for our analytical needs. Other tables thus have ORDER BY keys which provide the required unique row identification.
Finally, using updated_at, we periodically identify the repositories with the oldest time and thus need to be updated. These are then scheduled to the queue for processing.
The datasets
After running with 25 workers for around 24hrs on a 48-core machine with 16TB of disk space, we cloned and inserted the full commit history for 50k repositories.
SELECT uniqExact(repo_name)
FROM git.commits
┌─uniqExact(repo_name)─┐
│ 50035 │
└──────────────────────┘This consumes around 8TB of disk space (cloned repositories).
/dev/nvme1n1 16T 8.2T 7.9T 51% /dataIn ClickHouse, we can see the generated data compresses well:
SELECT
formatReadableSize(sum(data_compressed_bytes)) AS compressed_size,
formatReadableSize(sum(data_uncompressed_bytes)) AS uncompressed_size,
round(sum(data_uncompressed_bytes) / sum(data_compressed_bytes), 2) AS ratio
FROM system.columns
WHERE database = 'git'
┌─compressed_size─┬─uncompressed_size─┬─ratio─┐
│ 890.80 GiB │ 12.39 TiB │ 14.24 │
└─────────────────┴───────────────────┴───────┘
1 row in set. Elapsed: 0.004 sec.As shown, our largest table, line_changes has over 40b rows.
SELECT formatReadableQuantity(count())
FROM git.line_changes
┌─formatReadableQuantity(count())─┐
│ 44.69 billion │
└─────────────────────────────────┘
1 row in set. Elapsed: 0.003 sec.Adding Github Events
To supplement the above dataset, we also inserted the Github Events dataset. This contains all events on GitHub from 2011, with about 5.8 billion records at the time of writing. This includes all issues, comments, PRs, reviews, watches (stars), forks, and release events, complementing our lower-level commit histories. A full description of this dataset, again with suggested queries, can be found here. A simple script for keeping this data up-to-date can also be found here.
SELECT count()
FROM github_events
┌────count()─┐
│ 5847150938 │
└────────────┘
1 row in set. Elapsed: 0.002 sec.SELECT
formatReadableSize(sum(data_compressed_bytes)) AS compressed_size,
formatReadableSize(sum(data_uncompressed_bytes)) AS uncompressed_size,
round(sum(data_uncompressed_bytes) / sum(data_compressed_bytes), 2) AS ratio
FROM system.columns
WHERE table = 'github_events'
┌─compressed_size─┬─uncompressed_size─┬─ratio─┐
│ 258.22 GiB │ 2.63 TiB │ 10.43 │
└─────────────────┴───────────────────┴───────┘Building our application with Hex
With our datasets prepared and being kept up-to-date, we set about building our proof of concept application. For those readers interested in the full SQL queries and notebook configuration, we have made it available here. We step through the creation of the application below, focusing on select visualizations and queries. Note that at no point are we required to write any code. While Python could be used to provide a greater degree of interactability in the future - see “Future Work”, we have deliberately avoided this to keep the application simple for now.
Getting Started and Connecting to ClickHouse
Hex has two primary views:
- Logic view - A notebook-based interface where you can develop your analysis. Users can inspect the SQL and visualization configuration in our shared notebook.
- App builder - An integrated interface builder where you can arrange elements from the Logic View into an interactive app.
Most of our development work occurs within the Logic view, which is presented when we first create a project.
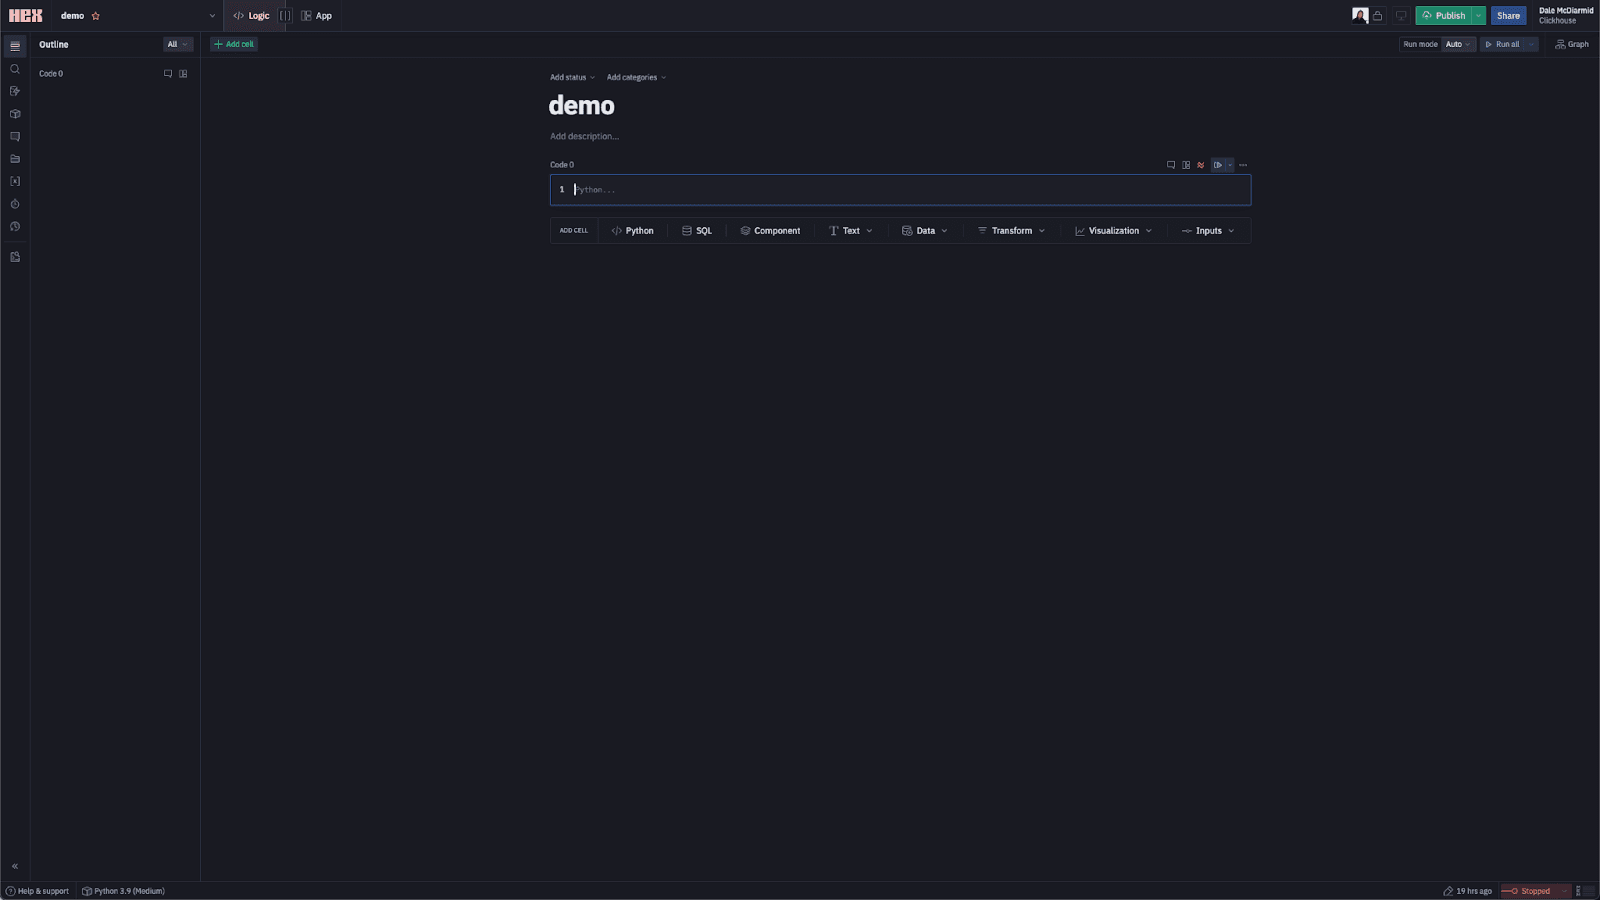
Users can create a number of components on this page, including Python, SQL, Visualizations, Text, and Inputs, in addition to more complex concepts such as transformations and writebacks beyond the needs of our app. These all can consume the output from other components as variables, as well as produce output on their own. Prior to adding any components, however, we need to connect to ClickHouse. We do this by creating a simple data connection, as shown below:
Adding Input Components
For an initial attempt, we decided to keep interactivity fairly minimal. On loading the app, the users are required to select a repository from which to obtain insights. This sets a repo_name variable which is used to filter all subsequent queries. For this, we need a simple input - a drop-down of repository names powered by a SQL query that identifies possible values.
At the time of writing, Hex doesn’t offer an auto-complete input component. Rather than populate a drop-down with all 100k repository names and impact page performance, we require the user to enter a search term (project or org filter). This limits our drop-down to a moderate number of examples. The process of creating these components is shown below:
Adding Visualizations
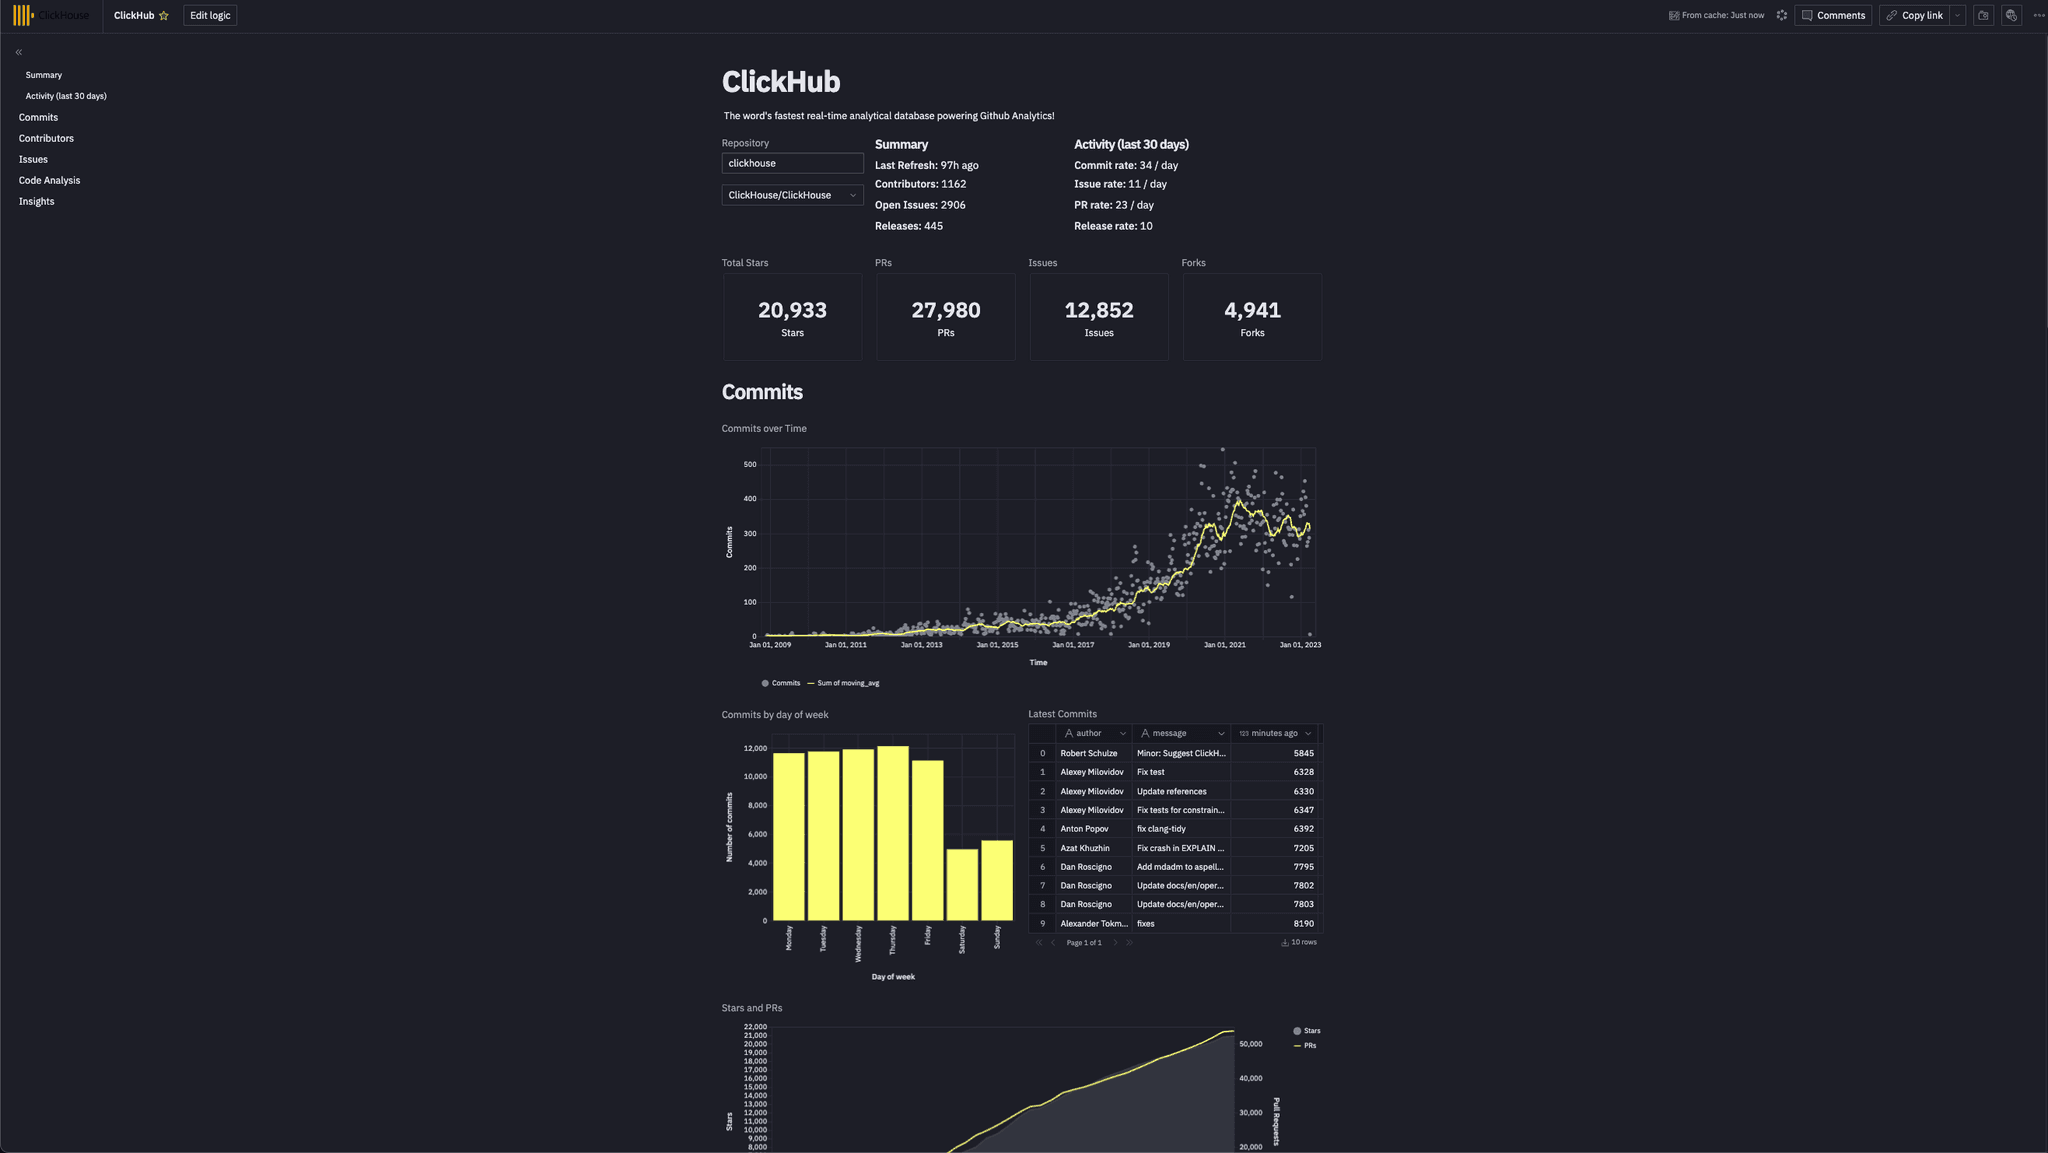
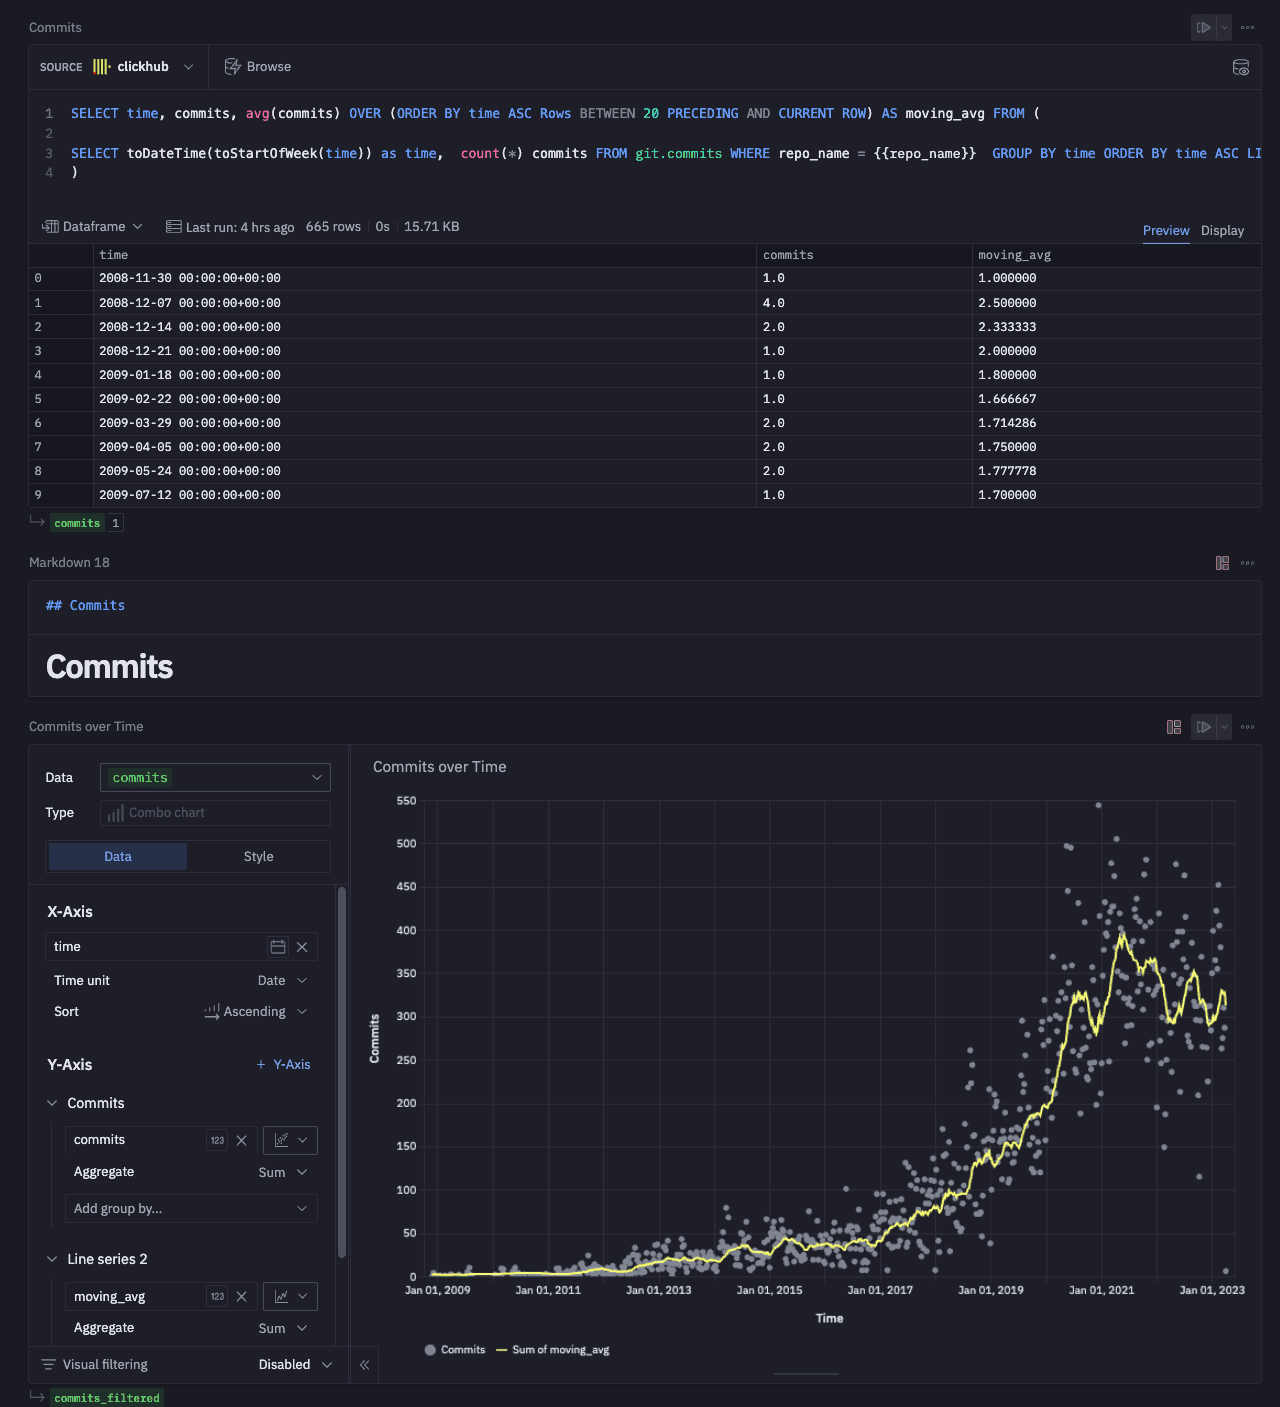
Each of our visualizations requires a SQL component. This returns a data frame which can then be consumed by a visual component - this can be a chart, table, single value, or even a map. We have broken our analysis into the sub-sections "Commits", "Contributors", "Issues", "Code Analysis". We have sampled visualizations from each of these below. For our selected repository, we've used ClickHouse. Users are free to interact with the notebook and analyze their own repository by changing the input values. For any SQL queries, the variable `{{repo_name}} "is used to ensure the repository is restricted to the user's selection.
Commits
Below, we create two visuals, one showing the number of stars for the selected repository, ClickHouse in our case, and the second showing the commits over time. These use the github_events and commits tables, respectively.
The computed star count for ClickHouse, using the github_events data, is a little low due to a repository rename.
Contributors
Showing the top contributors and their activity over time requires using the commits table. We can also use the same table to identify which contributors have the longest consecutive days of commits.
Issues
An analysis of a repository’s issues requires the github_events dataset. We present two visualizations below, one capturing the average time needed for an issue to be closed and another showing those community members responsible for reporting the most issues.
Code Analysis
Any form of code analysis requires our largest line_changes dataset. Fortunately, queries to this table remain fast despite being over 50b rows due to our use of the repository name as the first column in our ordering key. We use lines of code as a simple measurement of repository size, computing both a cumulative sum and value for the number of lines added and deleted per day. The ClickHouse value here is high - the result of counting code in submodules as well. A more focused analysis would likely exclude specific folders, something for later iterations.
For something to provoke discussion amongst developers of a project, we decided to see if we could identify who deletes the code for the top contributors. We limit this to the top 20 committers.
Bonus Insights
As a final insight, we wanted to identify “Affinity repositories” i.e. which other repositories do contributors for the selected repository contribute to.
For ClickHouse, users clearly contribute to the wider ClickHouse ecosystem as well as other projects in the analytics space.
We have provided only a sample of our visualizations here and encourage users to explore and clone the full notebook, where visuals have been fully styled and grouped.
Conclusions & Future Work
The current application is limited in its interactivity, with users only able to filter by repository name. Hex offers the ability to filter visuals with the results passed to a new data frame. These filtered data frames could, in turn, be used to render new visuals or be passed to Python code which would, in turn, generate new variables on which SQL could be filtered. This allows visuals to be dynamically chained and made dependent on each other with high levels of complexity possible. While we experimented with these features to provide increased interactivity, it significantly increased the complexity of the notebook and impacted rendering times if not done carefully. The ability to use Python code for manipulating data frames and performing data science and modeling opens up further opportunities to enrich the application, e.g. we could predict the number of stars for a repository based on regressions. Future iterations of the app might also provide filtering per visual, e.g., lines of code could be filtered per folder name.
While all possible, for our initial proof of concept, these weren’t a necessary investment. We may, however, explore it in future blogs or webinars…stay tuned. Users should be aware that any applications are single pages and very linear in their execution - very much like a notebook. This is useful for applications that need to “tell a story” but not applicable to more users who need a more dynamic multi-page experience.
We would additionally be excited by any Hex plans to offer an increased pallet of visualizations - heatmaps, funnel, and polar charts would all be welcome additions.
With respect to the data, we need to perform further work. The github_events and commits datasets use different authors, for example - the former using github handles and the latter full contributor names. Reconciling the data for renamed repositories (as in the case of ClickHouse) is also a priority.
Overall the Hex experience is an extremely positive and excellent tool for those needing to build quick experiences with no (optional) code. We encourage our users to explore their own datasets and let us know what you build!
Finally, regarding the evolution of ClickHub, stay tuned as we move on from our initial proof of concepts…