Character.AI runs thousands of GPUs. The GPUs power billions of active user seconds per day, with millions of AI-powered characters used by millions of active monthly users. This scale generates over 450PB of log data every month - data that's critical to monitor for performance and reliability of the service.
We interviewed Mustafa Yildirim, the first Site Reliability Engineer (SRE) at Character.AI, to learn how the team transitioned from fragmented logging solutions to a centralized observability platform built on ClickHouse and ClickStack to monitor thousands of GPUs and 450 PB of logs a month. Character.AI needed speed, scale, and simplicity. We cover the architectural decisions, schema and ingestion optimizations, and practical lessons that helped Mustafa deliver reliable observability at scale for one of the world's fastest-growing AI companies.
The impact was immediate: log search times dropped from minutes to seconds, visibility improved across all teams, and costs were cut in half - even as log volume grew 10x.
Building scalable infrastructure #
When Mustafa joined Character.AI in 2024, the company was already operating at a staggering scale. With no dedicated observability stack in place, Mustafa's mission was clear: build an infrastructure that could keep up with the company's pace of innovation.
"When I joined Character.AI, they had already built great, expandable infrastructure, and there was a clear path forward to build an observability stack."
Mustafa had a strong foundation to build on, but no dedicated observability stack. As the only SRE for 8–9 months, responsible not just for inference infrastructure but also for mobile and web, he needed a simple and cost-effective observability solution.
Inside Character.AI infrastructure #
Character.AI runs one of the most demanding AI platforms in production today - handling thousands of queries per second and 1 million concurrent connections, powered by thousands of GPUs across many Kubernetes clusters hosted in multiple cloud providers. Observability is fundamental to providing an operational service and also challenging due to the use of multiple cloud providers across multiple regions.
When Mustafa Yildirim joined, he inherited an impressive but fragmented infrastructure. Logs were split between multiple providers, which made debugging difficult, querying slow, and costs unpredictable.
The logs originate from a wide range of sources: backend microservices, mobile and web apps, and inference infrastructure. Backbone services create around 60% of logs and huge amounts of data - unsampled and raw, these produce around 300 trillion log lines or 450 PB of raw text alone per month! Other microservices provide the remaining log data.
With a small team managing this system, simplicity and scalability are crucial. Mustafa made the decision early that logs needed to be sampled intelligently - errors and warnings are stored in full, but info-level logs from the backbone service are sampled at 1 in 10,000. Other services follow a 1% sampling rate for info log level. This still produces around 50 billion log entries per month.
Mustafa's philosophy is clear here: retaining debug logs in production is rarely justified. If you need debug logs to solve an issue, the problem likely requires deeper investigation in staging. Instead, error logs should provide enough signal to identify, isolate, and reproduce the issue in staging, where full verbosity is enabled.
"If you’re sending debug logs at our scale, you’re insane."
Thanks to this thoughtful design decision, Mustafa's team has ensured that centralized logging remains cost-effective despite managing some of the largest scales seen in production AI systems today.
Introducing ClickStack at Character.AI #
Having already seen ClickHouse's performance firsthand at Zoom, where he managed the ingestion of a petabyte of metrics daily, Mustafa immediately began looking for a ClickHouse-powered observability stack - confident that ClickHouse could meet the observability challenges of an AI platform operating at thousands of QPS.
ClickHouse was already used at Character.AI for other real-time analytics workloads. Based on this positive experience, the wider organization was immediately supportive of at least exploring a ClickHouse-based platform.
But there was a catch: ClickHouse lacked a user-friendly interface. Building one from scratch wasn't feasible for a two-person SRE team. While offering powerful dashboarding, the Grafana plugin for ClickHouse didn't provide the native log exploration capabilities Character.AI needed.
When the acquisition of HyperDX by ClickHouse was announced, everything immediately clicked. Mustafa began testing ClickStack and ClickHouse Cloud, quickly proving its value in production.
What had been fragmented and slow was now potentially unified and real-time, pointing toward a future where observability was centralized, fast, and built for scale.
"As soon as I heard about the HyperDX acquisition, I downloaded the open-source version and started testing with ClickHouse Cloud. Immediately, it clicked."
What he found was transformative: the familiar speed and efficiency of ClickHouse, paired with a modern UI, rich query features, and blazing-fast search performance. Queries that had previously taken minutes returned in seconds or less. Natural language search made it easy to get insights fast.
"Previously, querying the last 10 minutes would take 1–2 minutes. With ClickStack, it was just a case of how fast I could blink. The performance is real. When you're digging into logs during an incident, every second matters."
The combination of ClickStack and ClickHouse Cloud gave Mustafa exactly what he needed: a turnkey observability stack with predictable performance, low cost, and powerful features without the need to reinvent the wheel.
"When I showed the first POC to the team, they were amazed. Searching logs from 15 days ago completed in under a minute. They couldn’t believe it."
Get started with ClickStack #
Discover the world’s fastest and most scalable open source observability stack, in seconds.
Evolving Observability: the shift to ClickStack and ClickHouse Cloud #
After a successful proof-of-concept, Character.AI moved to production with ClickStack in just a few weeks. While Mustafa initially explored self-hosting ClickHouse, ClickHouse Cloud offered unmatched price-performance, seamless auto-scaling, and cheap long-term retention via S3.
"Creating a DB, sharing credentials, and you've got logs in 2 minutes - that's huge."
Character.AI chose ClickHouse Cloud to ingest more data and reduce costs. The platform ingests 10 times more data - producing 450PB of data monthly - while still spending 50% less than before. Thanks to ClickHouse's 4x to 15x compression per column, Character.AI can store over 150TB of three to four months of compressed and sampled logs and retain everything.
Moving to production: schema tuning and ingestion optimization #
While getting logs flowing into ClickStack was straightforward, scaling to billions of logs per day required a little more planning.
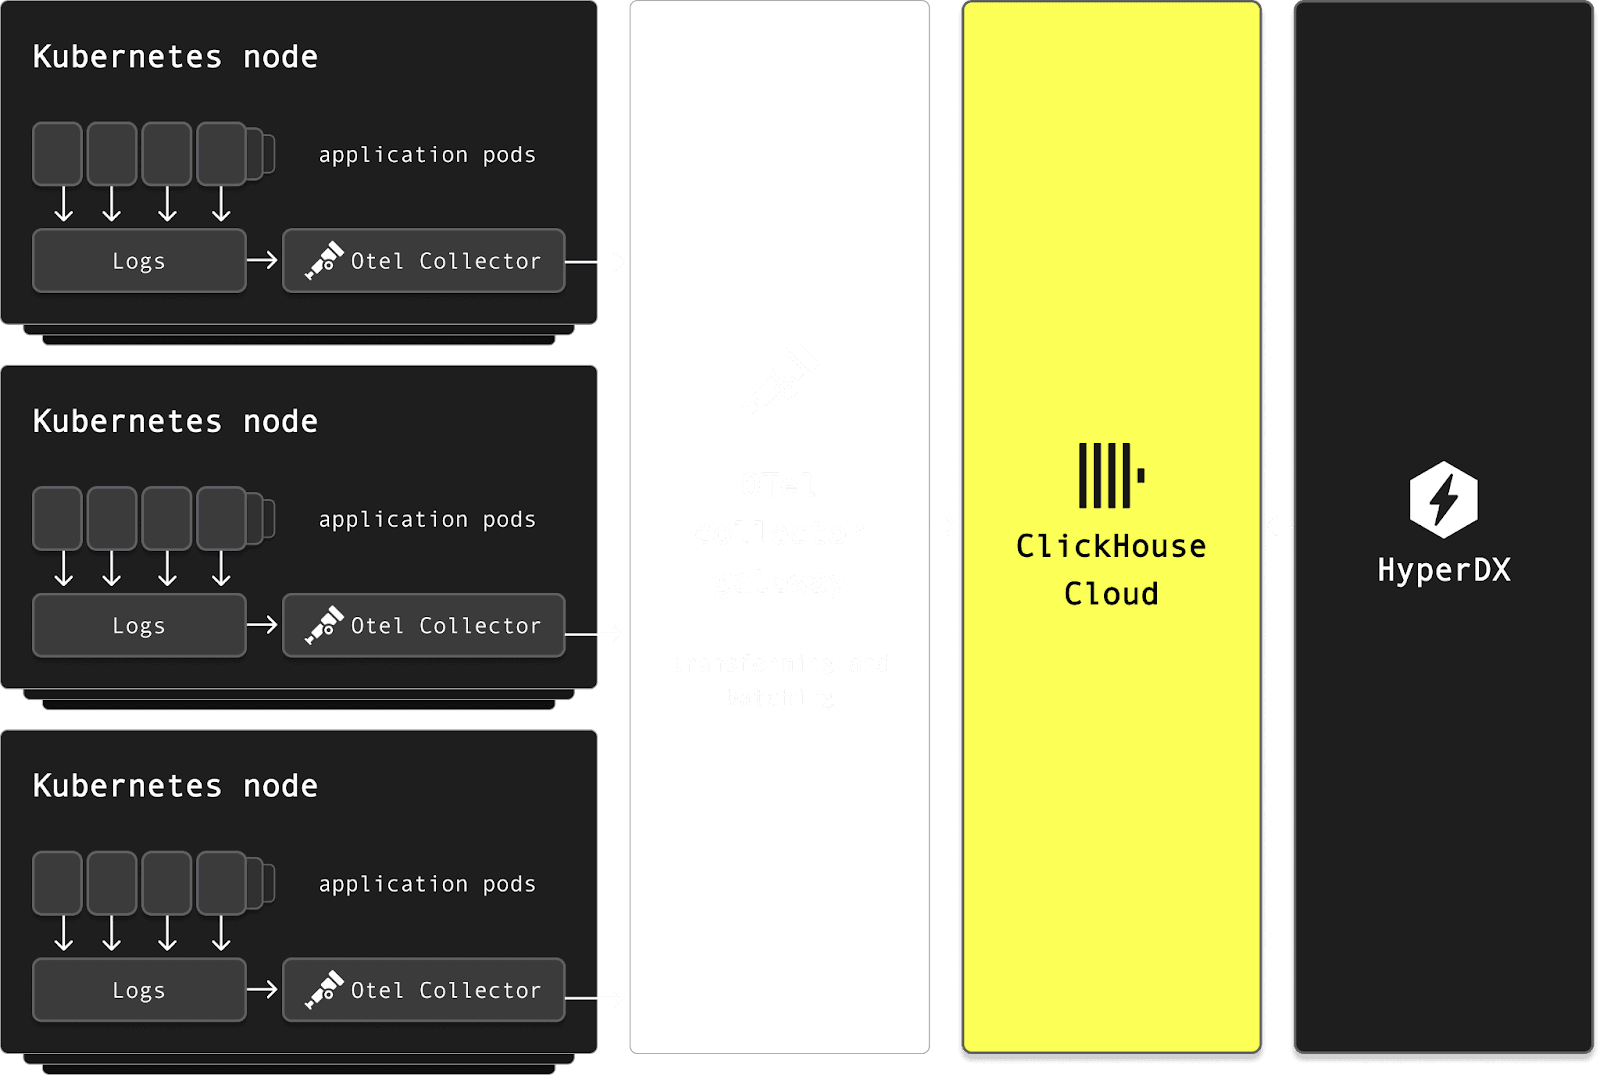
From the start, Mustafa emphasized simplicity and efficiency. The team deployed the OpenTelemetry Collector as a DaemonSet on every Kubernetes node, reading directly from container logs. This avoided invasive changes to application log configurations and allowed seamless ingestion without requiring any code changes.
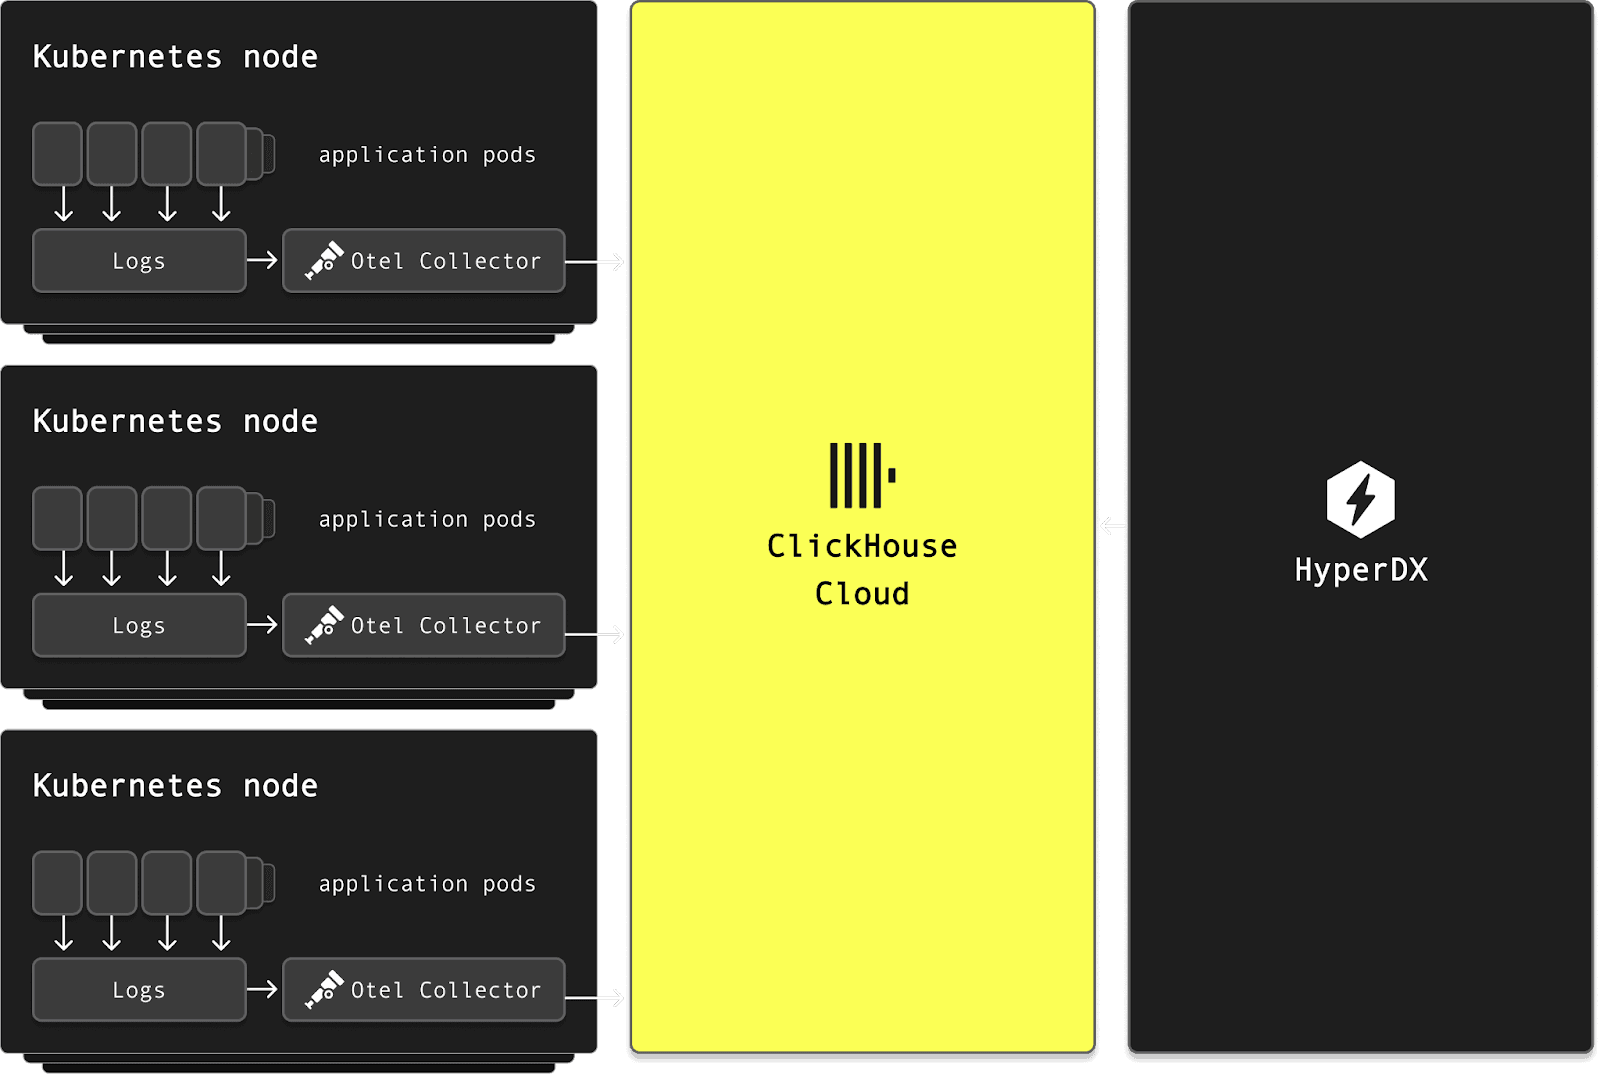
But ingesting logs at scale, from thousands of collectors, surfaced new challenges. Each app pushed directly into ClickHouse, which meant they had to optimize for high-throughput ingestion. Batching became essential. By enabling asynchronous inserts while tuning batch sizes, they were able to minimize write amplification while keeping ingest latency low.
"We didn’t need complex infrastructure. We just use OTel collectors to send logs directly"
ClickHouse Cloud's auto-scaling also proved critical. Mustafa initially started with the smallest instance and gradually tuned auto-scaling thresholds based on traffic patterns. Today, their cluster scales automatically between defined min/max bounds to handle variable load during the day while minimizing spend.
Even without exploiting ClickHouse Cloud's support for compute-storage separation (to isolate read and writes), performance remained strong. Auto-scaling, combined with fast S3-backed storage and around 15x compression from raw, allowed them to keep costs low and query latency fast.
"I was genuinely impressed by the compression we achieved with ClickHouse. Some columns gave us 10x, others 20x - even up to 50x in some cases. On average, we're seeing 15–20x compression!"
Lessons learned and advice for others #
Once ingestion was stable, attention turned to schema and query optimization. The default schema, while functional, wasn't optimized for Character.AI's access patterns. This led to some queries being slower and less resource-efficient. Working closely with the ClickHouse team, they:
-
Optimized primary keys to align with common time-range and service-based queries.
-
Added Materialized views to extract key fields from JSON payloads, like cluster_name, service_name, and error_type, into separate columns.
-
Carefully evaluated and added skip indexes (e.g., Bloom filters or min/max), while also removing unused ones to reduce memory overhead and complexity e.g. on
ScopeAttributes. -
Reordered columns and tuned compression settings for better performance and storage efficiency.
Generally, Mustafa recommends performing optimizations early as small changes make huge differences at scale.
"Even small optimizations make a huge impact at scale. The earlier you tune things, the better."
Despite the tremendous success, one persistent challenge stood out: OpenTelemetry collector configuration. Getting the collector config right took time - especially around sampling, batching, and resilience. Early mistakes, like forgetting to batch or ingesting unsampled logs, triggered outages and forced them to reset pipelines. Today, things are stable, but Mustafa is clear: this is an area OpenTelemetry should improve and welcomes the opinionated distribution now available with ClickStack.
Key ClickStack features #
Character.AI's infrastructure is massive - but the ClickStack setup is surprisingly lean. What won Mustafa over was a combination of speed, simplicity, and several practical features that significantly help with day-to-day root cause analysis and issue resolution.
Mustafa finds huge value in performant live tailing of logs, which delivers real-time visibility across 4,000+ servers.
"If I deploy an app and see new errors, I can correlate them to a specific version instantly"
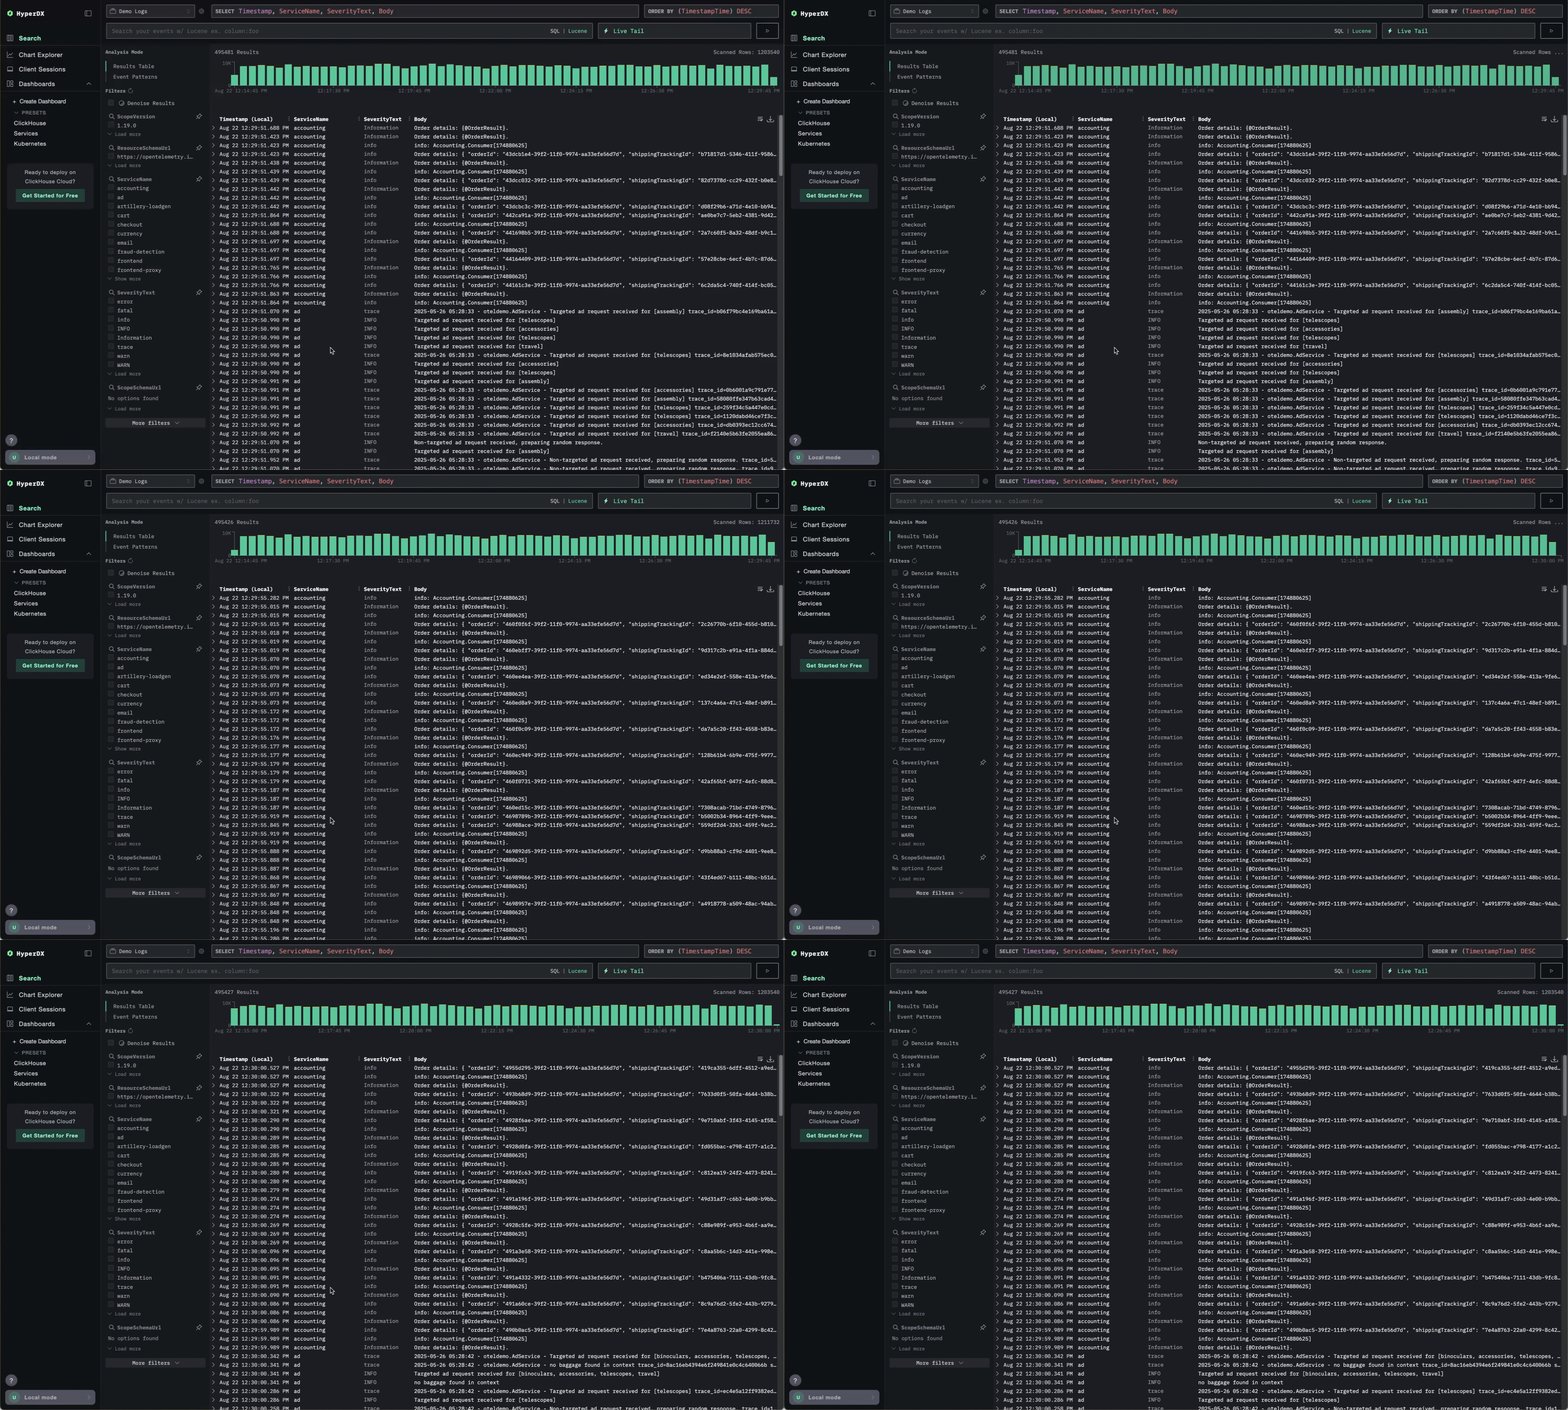
ClickStack's denoise feature has been a game-changer for Character.AI. In a system where the vast majority of logs are repetitive, often emitted at high frequency from stable systems, it’s easy for meaningful events to get buried. Denoise automatically collapses common log lines and helps surface outliers, letting engineers immediately spot unusual behavior, particularly during deploys.
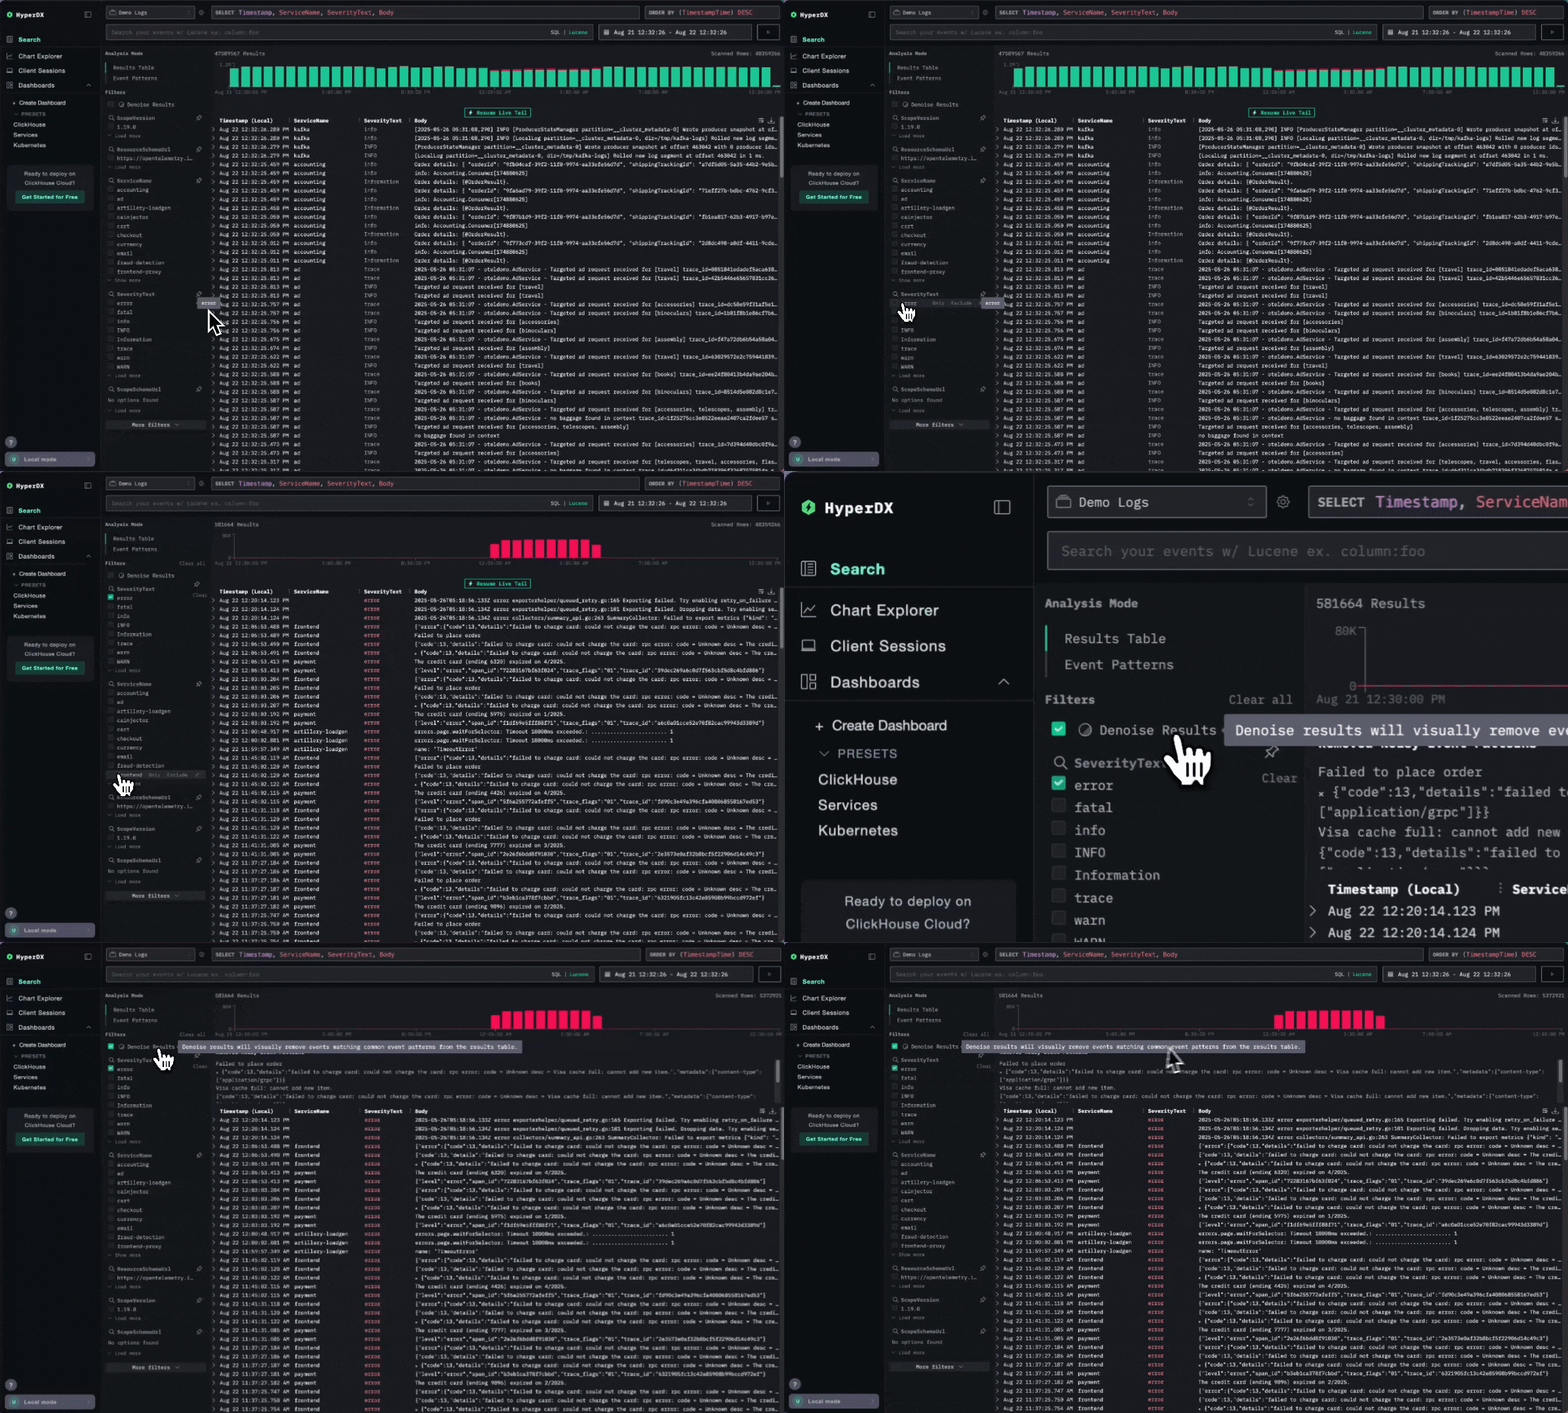
Similarly, the Event Patterns feature groups common log messages and visualizes how they evolve over time. For Character.AI, this is especially valuable - not only does it surface anomalies, but it also provides the surrounding context needed to correlate events and how they have occurred over time, helping SREs to understand their root cause. Again given the repetitive nature of most logs, this pattern-based view is essential for quickly zeroing in on what’s truly unusual.
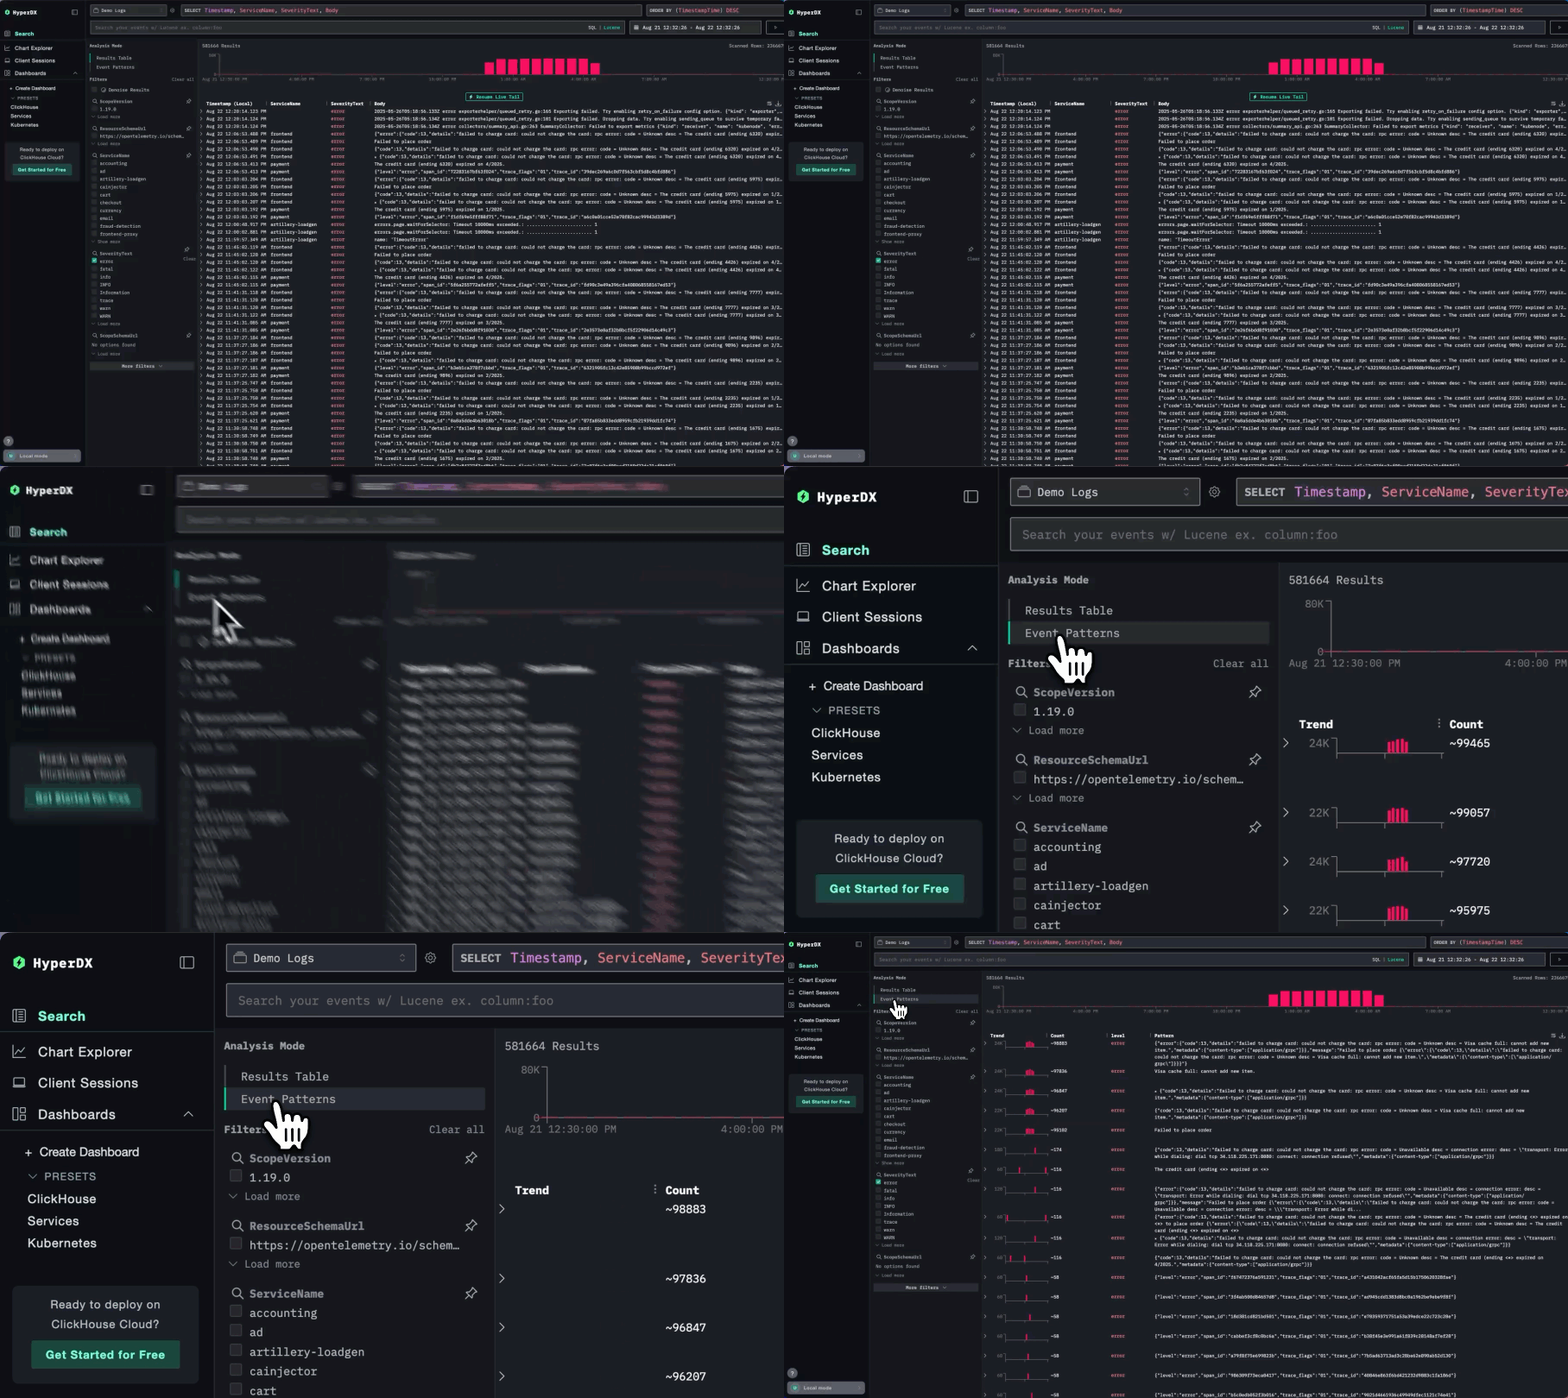
Most importantly, Lucene-style keyword search is essential for the way engineers at Character.AI troubleshoot production systems. Unlike label-based systems, where you must know the structure of your logs ahead of time, Lucene enables freeform search across all fields. This is perfect for chaotic or unfamiliar failure modes. It allows engineers to drop in a snippet from an error or stack trace and instantly start investigating, without predefining filters or tags.
Finally, while less glamorous, Mustafa also appreciates simpler features such as Saved Queries, which make common filters reusable with a click, accelerating repetitive workflows, as well as the ability to see the surrounding context when inspecting a specific event.
"If you don’t know what’s going on, you just paste a sentence from your logs or code and hit enter"
What's next for the Character.AI observability stack #
Looking ahead, Character.AI plans to further streamline its observability pipeline. Today, all filtering and transformation is done at the agent level using the OTel collector deployed as a DaemonSet, which, while simple to maintain, adds some unnecessary overhead at scale. Mustafa is considering introducing a centralized gateway layer - offloading processing from edge agents and enabling more efficient batching and transformation before ingestion into ClickHouse.
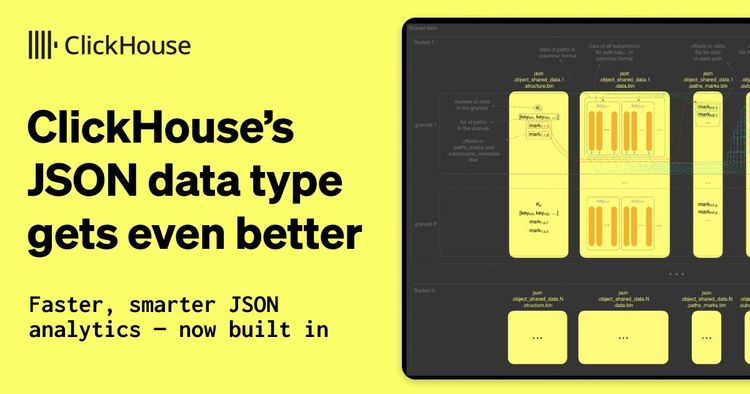
The team is also evaluating a migration to ClickHouse’s native JSON type, now supported in ClickStack, to boost query performance on LogAttributes.
Currently Character.AI hosts the HyperDX component of the stack themselves. With the recent announcement of the availability of HyperDX in ClickHouse Cloud, they are hoping this will simplify their architecture further and allow them to exploit the integrated authentication this deployment mode offers.
Finally, is metric unification: Character.AI aims to bring metrics into the same platform as logs - unlocking a unified view for correlation and alerting. This migration depends on native PromQL support in ClickStack, which is currently under active development.
"You need: logs, metrics, and tracing in one place so everything can be correlated for real root cause analysis. For us, this means ClickHouse."
Try ClickStack today #
Deploy the world’s fastest and most scalable open source observability stack, with one command.
Closing thoughts: centralized logs and empowered developers #
Character.AI's infrastructure is vast, spanning thousands of Kubernetes nodes and GPUs, but their observability setup remains strikingly lean. Thanks to ClickStack, they've achieved a level of visibility that was previously out of reach. With blazing-fast performance, cost efficiency, and built-in features like Event Patterns and Denoise, the transition to centralized logs has been seamless. There were no custom ingestion layers or sidecar overhead, just simple Daemonsets, optimized schema, and ClickHouse Cloud auto-scaling doing the heavy lifting.
"Last year our developers couldn’t see logs… now I can say: we have logs. They’re fast, centralized, and searchable"
This shift has delivered real business value. Developers can now investigate incidents with confidence, correlate logs in real time, and resolve issues faster. What sealed the deal wasn't just ClickStack's raw performance or its lower cost - it was the combination of both, paired with smart, user-focused features that make root cause analysis effortless. Observability at scale, without the operational burden.
