
The release train keeps on rolling. We are super excited to share the updates in 23.3 LTS.
And, we already have a date for the 23.4 release, please register now to join the community call on April 27 at 9:00 AM (PST) / 6:00 PM (CEST).
Release Summary
- 22 new features.
- 14 performance optimisations.
- 61 bug fixes.
A small subset of highlighted features are below. But don't miss out on compressed marks in memory, extended temporary tables, and the ability to see the results of a cancelled query (among many more).
Parallel Replicas for utilizing the full power of your replicas (Nikita Mikhailov)
With parallel replicas, data can be processed in parallel by multiple replicas of the same shard.
In ClickHouse clusters, sharding can be used when the overall amount of data doesn’t fit onto a single host or when data processing is too slow with a single host: The data is split over multiple hosts in the form of shards (collections of data parts).
This allows query performance to be scaled as distinct subsets of data can be processed in parallel by multiple ClickHouse hosts. Usually, a distributed table is used for routing a query to all shards. We sketch this below:


There are scenarios where having more than one shard is impractical or unnecessary, respectively. For example, when you run ClickHouse on top of virtually limitless shared object storage, like in ClickHouse Cloud, all ClickHouse instances have access to the same physical data and are effectively multiple replicas of a single (limitless) shard. With the new ClickHouse parallel replicas feature, you can utilize such replicas for parallelizing data processing. We visualize this below:


The above visualization shows that with the setting allow_experimental_parallel_reading_from_replicas = true, a query is sent to a (random) initiator replica node, which forwards the query to all participating replicas (the number is configured via max_parallel_replicas). Each replica then processes a distinct subset of data ranges (dynamically assigned by the initiator node) of the overall shard data in parallel, sending its local results back to the initiator node, which merges the local results into the final result.
In ClickHouse Cloud, this separation of storage and compute allows to dynamically increase (or decrease) the number of replica nodes in order to (ideally) linearly or even superlinearly tune query processing times. Without requiring any physical resharding or rebalancing of the actual data!
The parallel replicas feature also works for self-managed ClickHouse clusters consisting of multiple shards with multiple replicas per shard. Then multiple replicas per shard will process distinct subsets of data ranges of the shard in parallel:


Therefore data processing speed can be tuned by adding additional copies (replicas) of the data.
Parallel Replicas with Dynamic Shards (Antonio Andelic)
By processing distinct subsets of the data, every parallel replica can be imagined as a shard without physically sharding the data.
Dynamic sharding now allows users to control how these virtual shards are formed and, thus, how the query is distributed. Parallel replicas can now be configured to split work by automatically adding a distinct filter based on the parallel_replicas_custom_key expression to the query on the initiator node before forwarding the query to all participating replicas:


This can be beneficial for specific queries. For example, for GROUP BY queries, if the group by column is used as the parallel_replicas_custom_key expression, then there is no need for the initiator node to merge the local results from the participating replicas, as there will be no group overlaps in the local results (therefore distributed_group_by_no_merge is set to 2 automatically if parallel_replicas_custom_key is set).
Furthermore, you can now also configure, via the parallel_replicas_custom_key_filter_type setting, how the parallel_replicas_custom_key expression is used for splitting work between the participating replica nodes. When set to default, then a “remainder of division” SQL predicate using a modulus of the NODE_COUNT will be added to the query on the initiator node (we assume that each of the NODE_COUNT participating nodes has a distinct identifier NODE_NUM in the range 0 to NODE_COUNT - 1):
WHERE parallel_replicas_custom_key % NODE_COUNT = NODE_NUMWhen parallel_replicas_custom_key_filter_type is set to range, then the entire value space of the parallel_replicas_custom_key expression is evenly split between the replica nodes by adding a “range” predicate to the query for each replica that, simplified, looks like this (the parallel_replicas_custom_key expression needs to be of unsigned integer type for the range filter):
WHERE parallel_replicas_custom_key >= NODE_NUM * (MAX_OF_VALUE_SPACE / NODE_COUNT)
AND parallel_replicas_custom_key < (NODE_NUM + 1) * (MAX_OF_VALUE_SPACE / NODE_COUNT)This “range” work split configuration is an optimization for saving IO time if the data is locally distributed (sorted) according to the parallel_replicas_custom_key and if the values of the key are uniformly distributed across the entire domain of its data type (like it is the case when hash values are used).
For those of you that would like to read more about parallel replicas and how to exploit the full power of object storage-based clusters, stay tuned for more in-depth blog posts coming soon.
Lightweight Deletes are now GA (Jianmei Zhang and Alexander Gololobov)
In a recent blog post, we explored strategies for deleting and updating data in ClickHouse. As part of this, we discussed a recent feature that makes deleting data in ClickHouse a lighter weight operation - aptly named “Lightweight Deletes”. To much community demand and anticipation we can now announce that this feature is generally available and ready for use in production.
This approach to removing data now represents the preferred and most efficient way to remove data from ClickHouse. Exposed via the DELETE FROM table syntax, users can specify a condition to remove specific rows as shown below:
DELETE FROM table WHERE col1 = 'Hi' AND col2 = 2Users should be aware that this feature utilizes an internal column to mark deleted rows. These rows are then removed during regular merge cycles. This has a few implications, principally that rows will only be eventually removed from the disk. While excluded from search results, the deleted rows will reside on disk until their parts are merged. The time taken for this to happen is not deterministic. This means:
- Space savings will not be as immediate as issuing a deletion through regular mutations. Consider using mutations if space savings are critical, e.g., insufficient disk space.
- With no guarantees for removal, users with compliance requirements may wish to use mutations to ensure data is deleted.
With the exception of these two use cases, we recommend users begin migrating their delete workloads to ClickHouse today.
MySQL Compatibility (Robert Schulze, Flynn)
While ClickHouse has had support for the MySQL wire protocol for many years, the dialect and supported functions are distinct. This is intentional since it allows users to more easily write analytical queries. However, with third-party tooling such Google Looker requiring extensive MySQL compatibility we have continued to improve our support here. Whilst support for operators such as SELECT 'ClickHouse' REGEXP 'M?ouse$'; are important for full syntactical support, other functions such as parseDateTime bring new capabilities to ClickHouse. This specific function enhances the date parsing capabilities of ClickHouse by allowing users to specify a date format in MySQL Syntax, for those cases when the classical parseDateTimeBestEffort function is not able to correctly determine the date time.
For example, suppose you encounter a format using the day of the year to denote the specific date:
SELECT parseDateTimeBestEffort('1994-127 23:23:23')
0 rows in set. Elapsed: 0.103 sec.
Received exception from server (version 23.3.1):
Code: 41. DB::Exception: Received from localhost:9000. DB::ParsingException. DB::ParsingException: Cannot read DateTime: unexpected number of decimal digits after year: 3: While processing parseDateTimeBestEffort('1994-127 23:23:23'). (CANNOT_PARSE_DATETIME)Parsing this format is now possible using a MySQL format:
SELECT parseDateTime('1994-127 23:23:23', '%Y-%j %H:%M:%S')
┌─parseDateTime('1994-127 23:23:23', '%Y-%j %H:%M:%S')─┐
│ 1994-05-07 23:23:23 │
└──────────────────────────────────────────────────────┘For our Java users, we also support the function parseDateTimeInJodaSyntax, allowing the well known Joda syntax to be used:
SELECT parseDateTimeInJodaSyntax('1994-127 23:23:23', 'YYYY-DDD HH:mm:ss')
┌─parseDateTimeInJodaSyntax('1994-127 23:23:23', 'YYYY-DDD HH:mm:ss')─┐
│ 1994-05-07 23:23:23 │
└─────────────────────────────────────────────────────────────────────┘All of these improvements unlock a world of possibilities, especially around BI-tooling.
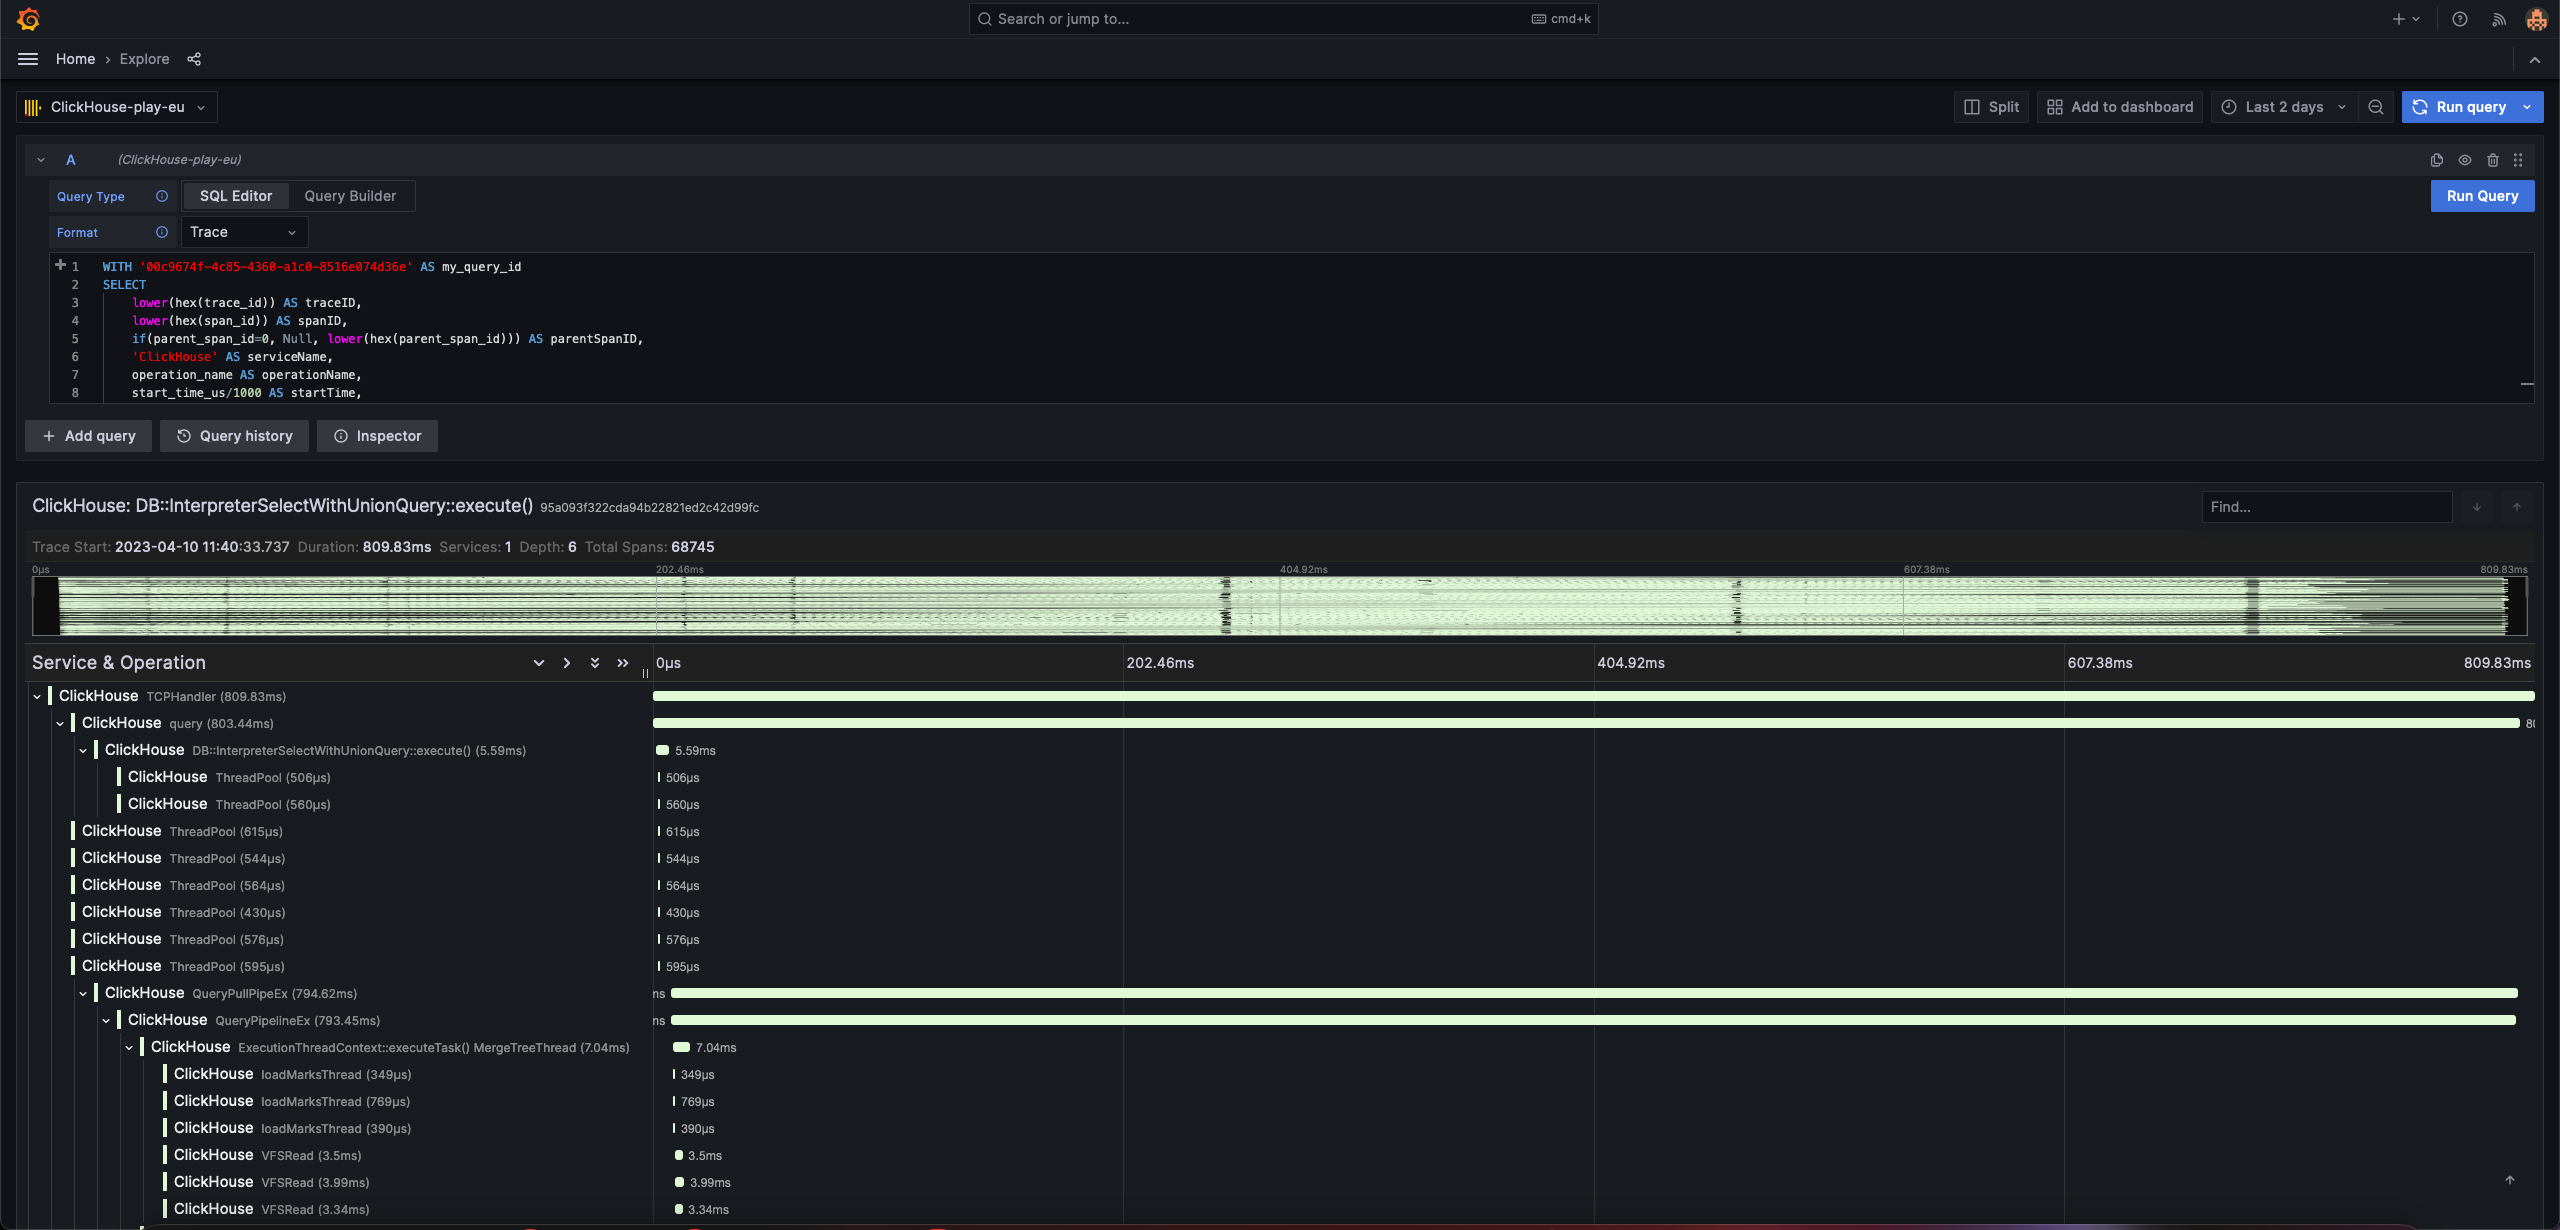
Traces in Grafana
As part of our recent blog post on building an Observability solution on ClickHouse we focused on traces and realized that their rendering in our official Grafana plugin could be significantly improved. With a small few changes, the latest release now supports the visualization of traces using the Traces Panel and Explore view in Grafana. While this is obviously useful for understanding the behavior of your own services and applications, as highlighted by the blog, we also found this to be an effective tool for exploring queries in ClickHouse.
ClickHouse allows trace data to be generated for any query with the settings opentelemetry_trace_processors and opentelemetry_start_trace_probability . Setting these for a query, causes a trace to be generated in the system table opentelemetry_span_log. Each trace consists of spans, represented as rows in the above table. Each of these spans show the query execution at code level, allowing users to identify costly execution steps in the query. Using this data, and the steps below, users can now visualize these steps in Grafana.
Enable tracing, run a query and note the query id. We explicitly set the max_threads to 1 below to limit the trace data for visual purposes:
// enable tracing
SET opentelemetry_trace_processors=1;
SET opentelemetry_start_trace_probability=1;
// run a query
SELECT
toStartOfMonth(upload_date) AS month,
sum(view_count) AS `Youtube Views`,
bar(sum(has_subtitles) / count(), 0.55, 0.7, 100) AS `% Subtitles`
FROM youtube
WHERE (month >= '2020-08-01') AND (month <= '2021-08-01')
GROUP BY month
ORDER BY month ASC
SETTINGS max_threads = 1
Query id: 77931e25-b1a0-4eb1-82dc-786d95629f89To ensure trace data is returned for the query id in the correct format, run the following from Grafana Explore. Ensure you set Format=Trace in the query editor.
WITH '<query_id>' AS my_query_id
SELECT
toString(trace_id) AS traceID,
toString(span_id) AS spanID,
if(toString(parent_span_id)='0', Null, parent_span_id) AS parentSpanID,
'ClickHouse' AS serviceName,
operation_name AS operationName,
start_time_us/1000 AS startTime,
finish_time_us/1000 AS finishTime,
(finish_time_us - start_time_us)/1000 AS duration,
arrayMap(key -> map('key', key, 'value', attribute[key]), mapKeys(attribute)) AS serviceTags
FROM clusterAllReplicas('default', 'system', 'opentelemetry_span_log')
WHERE trace_id IN (
SELECT trace_id
FROM clusterAllReplicas('default', 'system', 'opentelemetry_span_log')
WHERE (attribute['clickhouse.query_id']) = my_query_id
)
ORDER BY startTime ASCNote we use the clusterAllReplicas function for ClickHouse Cloud only. Local users can use the opentelemetry_span_log table explicitly.
The next logical question is how to use these traces to debug your query…stay tuned for content! In the meantime to utilize this new capability with your own services, install the latest ClickHouse Grafana plugin today. For those of you who are new to tracing and would like to read more, see our recent blog post. Further information on installing and using the Grafana plugin can also be found here.


