
Back in May 2022, we released a first-party ClickHouse plugin for Grafana, developed by Grafana in collaboration with ClickHouse. As part of our commitment to maintaining and improving this plugin, we are pleased to announce the release of version 2.0.
This major release includes a fundamental change to how we parse ClickHouse queries, which should help resolve a common set of issues encountered by our users around ad-hoc filters. We’ve also added support for using HTTP as the transport protocol and enhanced support for ClickHouse data types, including JSON.
A better way to handle filters #
When we initially developed the plugin, we wanted to use the latest plugin framework for Grafana. This ensures we support features such as Alerting, which has server-side dependencies. Through this new framework, we supported an initial implementation of Ad-hoc filters. This powerful Grafana feature is only supported for the most popular data sources, allowing users to filter all visualizations by selecting a column, operator, and value. While our initial offering largely worked, it relied on parsing SQL queries using a client-side AST implementation. Even for experienced developers, this represents a complex problem - especially since ClickHouse SQL has several extensions to aid users in building analytical queries. This implementation was subsequently the source of several issues, mainly associated with using Grafana variables, templates, and subqueries.
Rather than investing more time in the AST parser, we contacted a team who had already solved this problem optimally: our friends in the ClickHouse core development team. After some brief discussions, additional_table_filters were born in 22.7. This allows any filter to be sent with a query as part of the SETTINGS. On parsing the query, ClickHouse can inject these filters into the appropriate clauses.
Feel free to test any of the examples below against sql.clickhouse.com. Any tables are available in the blogs database, so FROM <table> clauses should be adjusted accordingly, i.e. FROM blogs <table>.
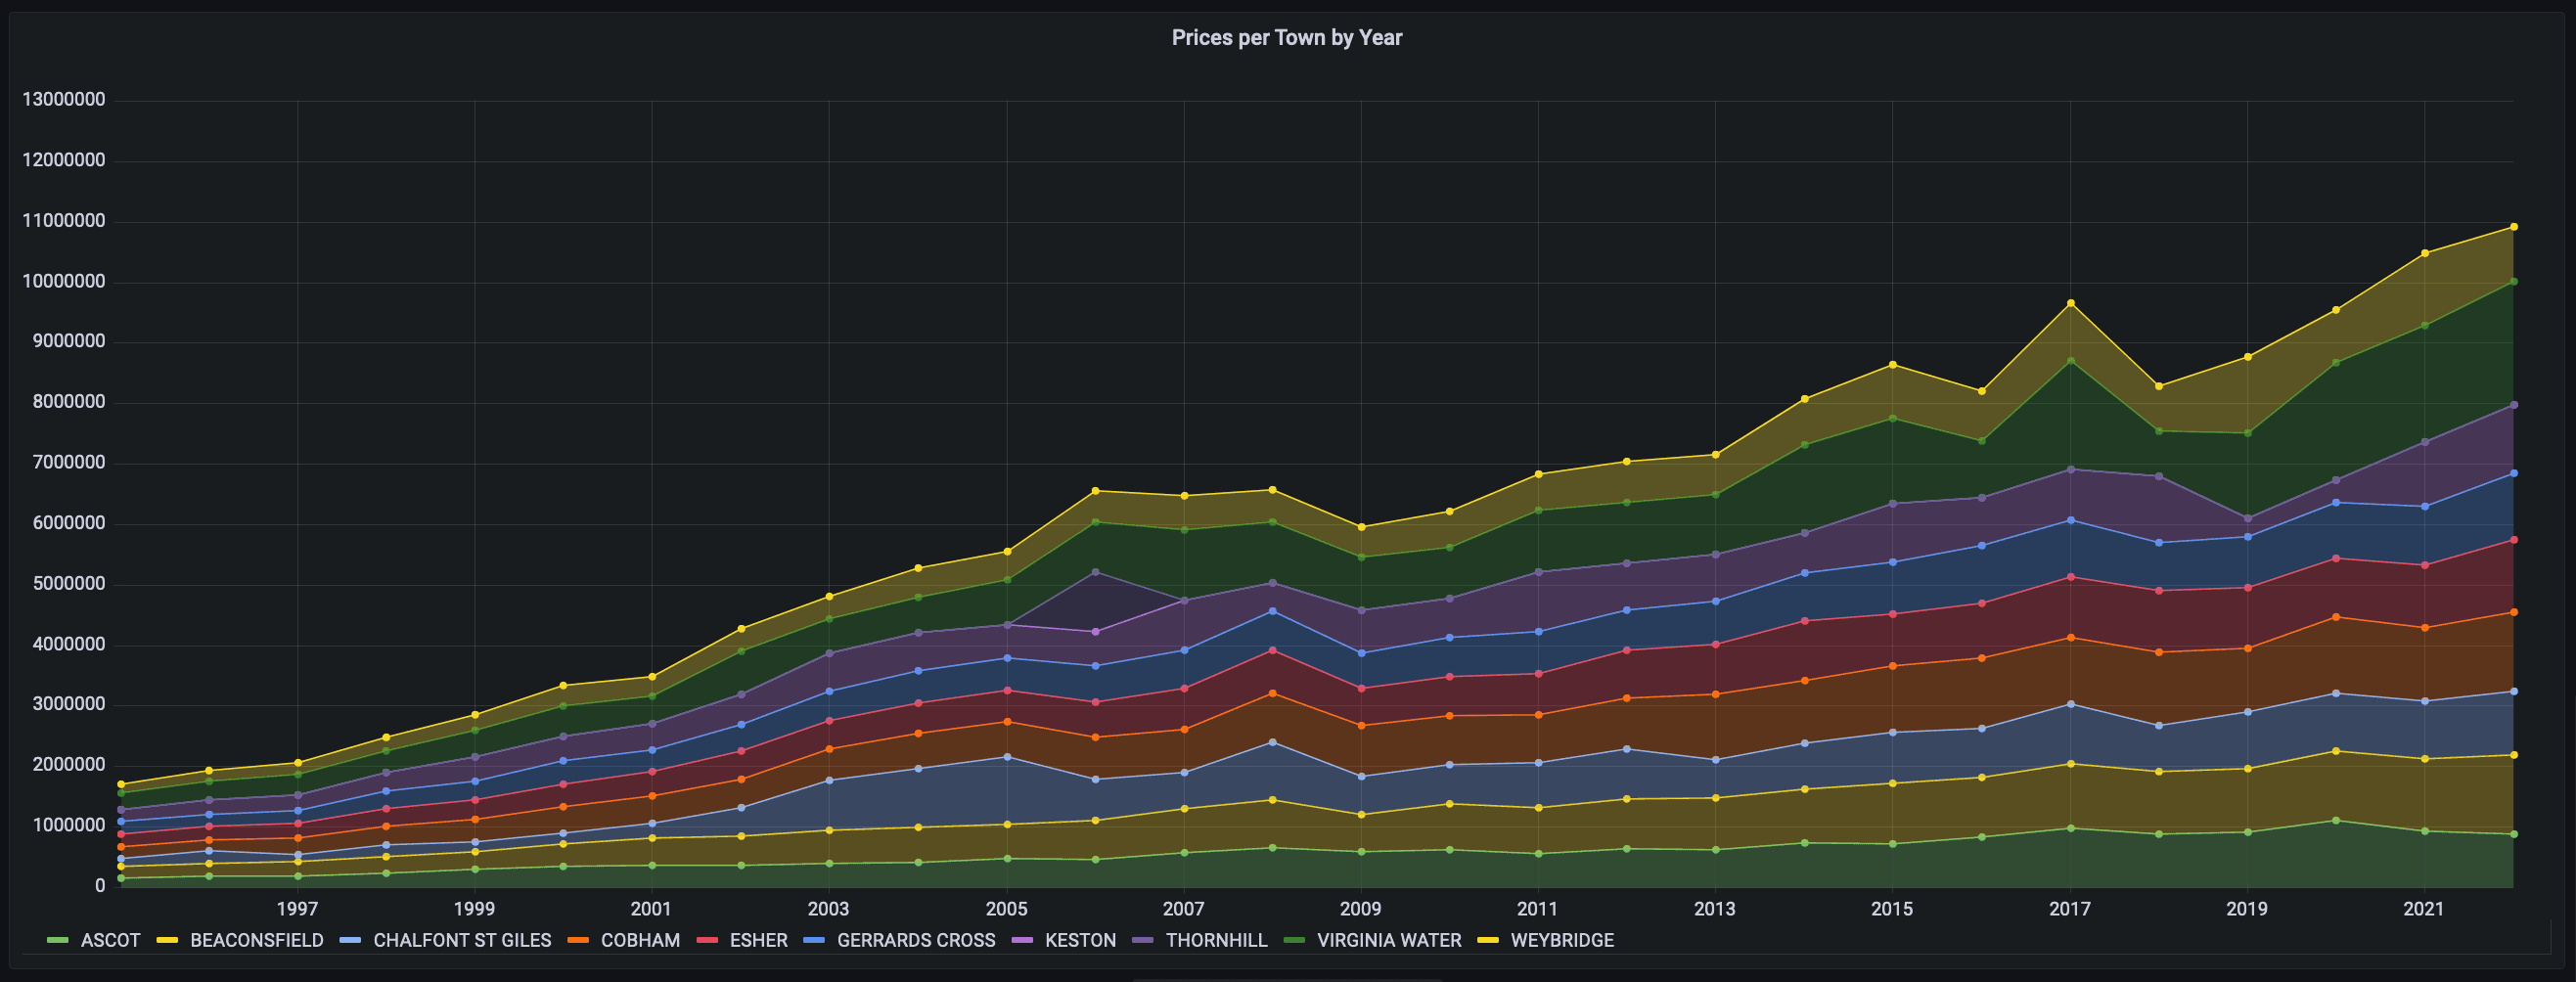
Consider the simple query from the UK property price dataset.
This simple query tells us the average price per town, for the top 10 most expensive towns in the UK, over time. Note that we exclude Gatwick as it represents an anomaly. This naturally renders as an area or line chart in Grafana. A logical filter here might be for the user to filter by town. Ensuring this is injected in the correct part of the query represents a challenge. A JavaScript-based solution, while possible, would need to cover all possible fringe cases. E.g., here we would optimally inject the town filter into the IN clause and AND with the town != 'Gatwick'.
Note: Due to insufficient permissions to use
additional_table_filters, Adhoc filters will not work if using sql.clickhouse.com as your ClickHouse data source. See "Be aware of changes" below for further detail.
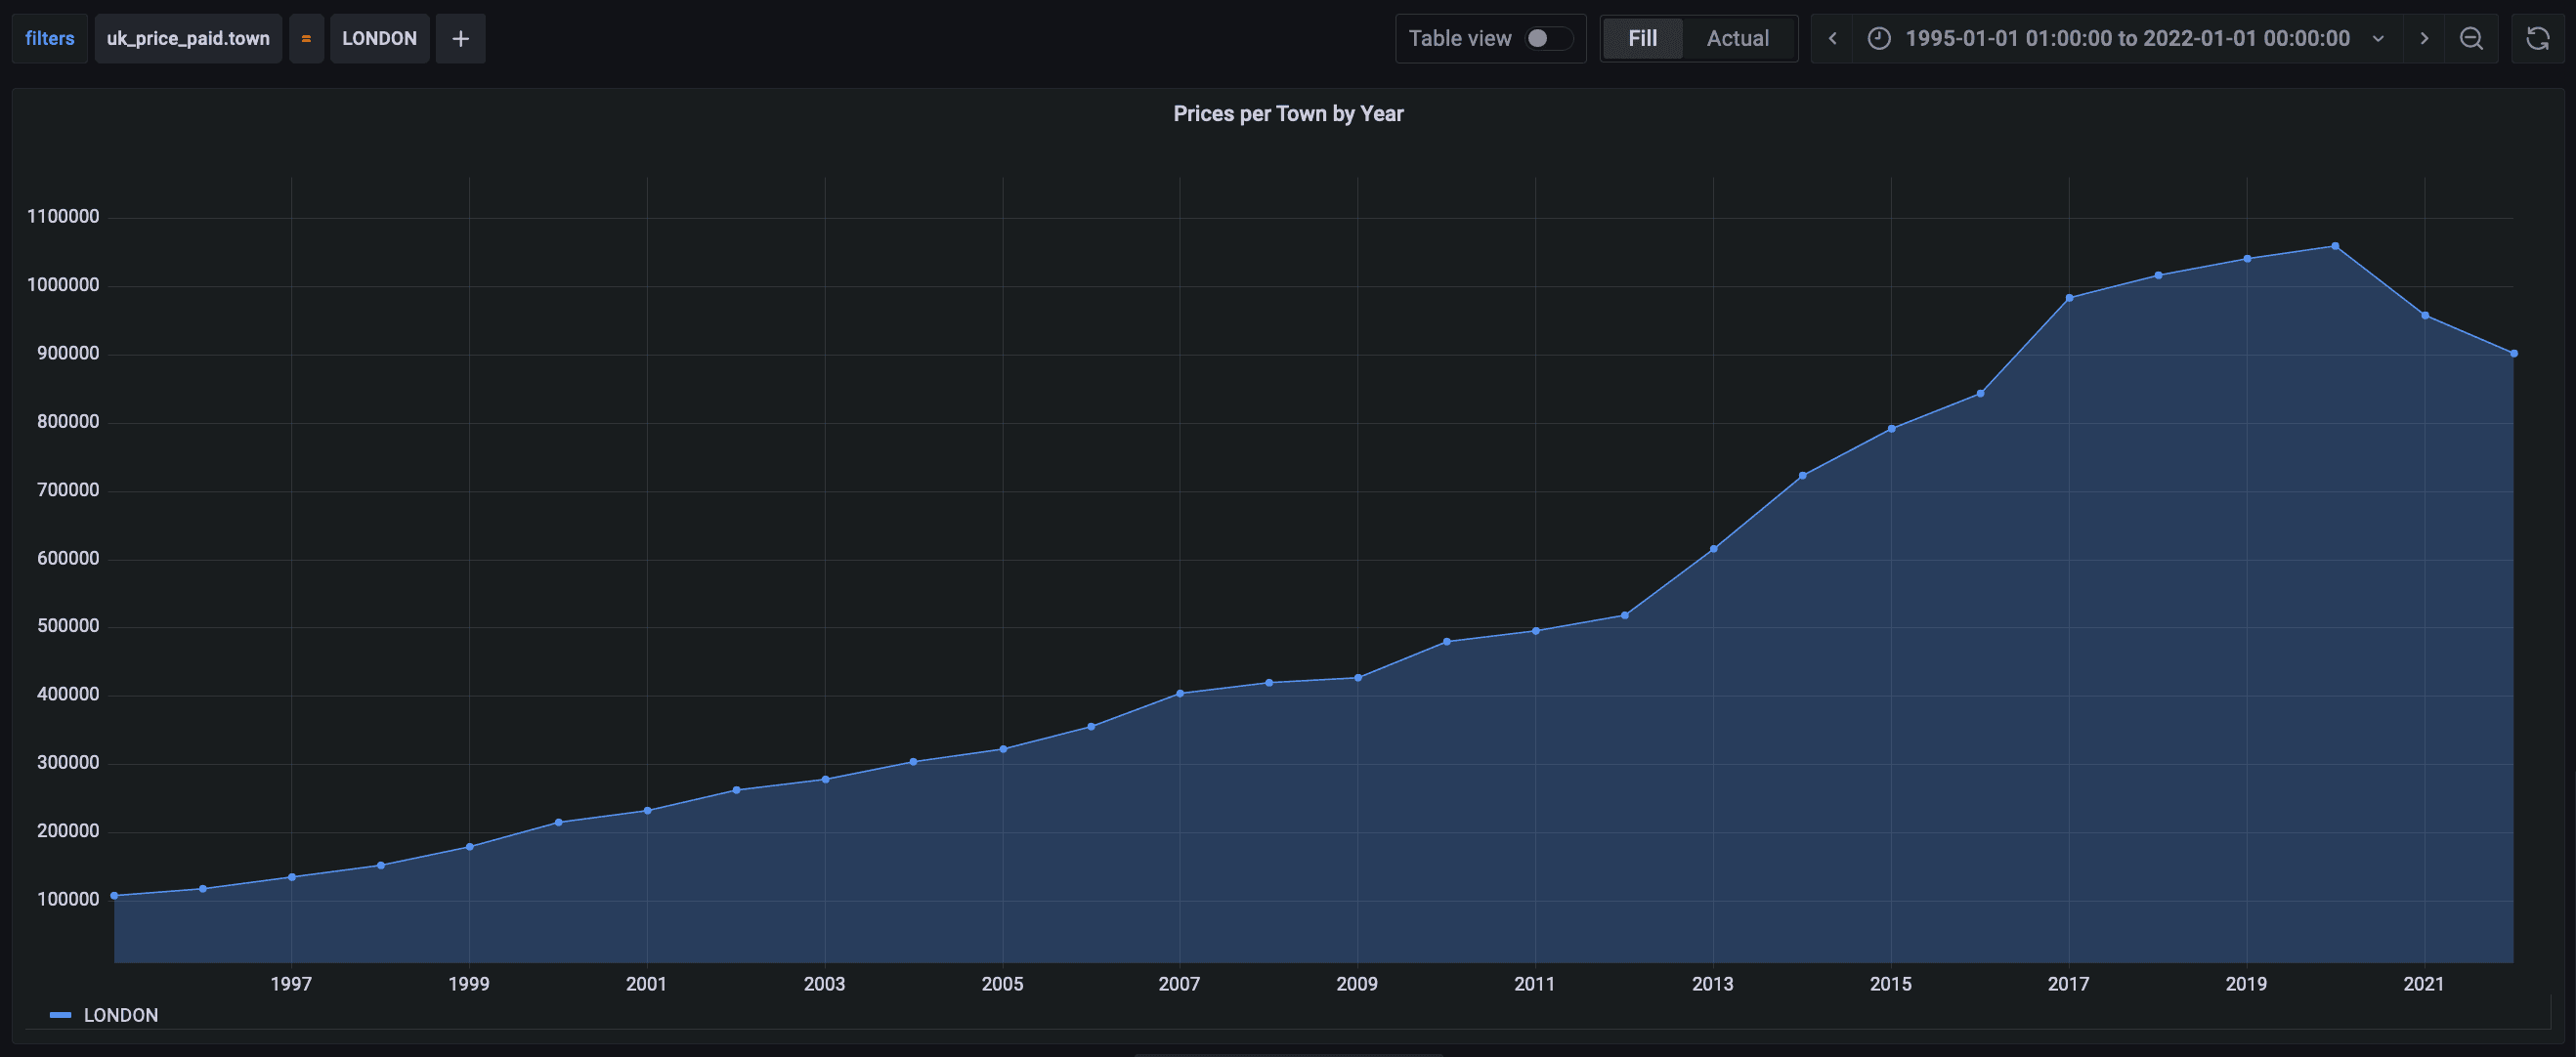
Adding an ad hoc filter and selecting town=London, causes Grafana to send the following query:
  1SELECT toStartOfYear(date) AS time, town, round(avg(price)) AS price
2FROM uk_price_paid
3WHERE town IN (SELECT town
4               FROM uk_price_paid
5               WHERE uk_price_paid.town != 'GATWICK'
6               GROUP BY town
7               ORDER BY avg(price) DESC
8               LIMIT 10)
9GROUP BY time, town
10ORDER BY time SETTINGS additional_table_filters = {'uk_price_paid' : 'town = \'LONDON\' '}
ClickHouse, in turn, does the hard work of figuring out where this clause needs to be added - note how the filter is specified as a map where the key is equal to the table name uk_price_paid.
Adding further filters is trivial. In the example below, we filter by district, focusing on Hackney.
  1SELECT toStartOfYear(date) AS time, town, round(avg(price)) AS price
2FROM uk_price_paid
3WHERE town IN (SELECT town
4               FROM uk_price_paid
5               WHERE uk_price_paid.town != 'GATWICK'
6                 AND uk_price_paid.town == 'LONDON'
7               GROUP BY town
8               ORDER BY avg(price) DESC
9               LIMIT 10)
10GROUP BY time, town
11ORDER BY time settings additional_table_filters = {'uk_price_paid' : 'town = \'LONDON\' AND district = \'HACKNEY\' '}
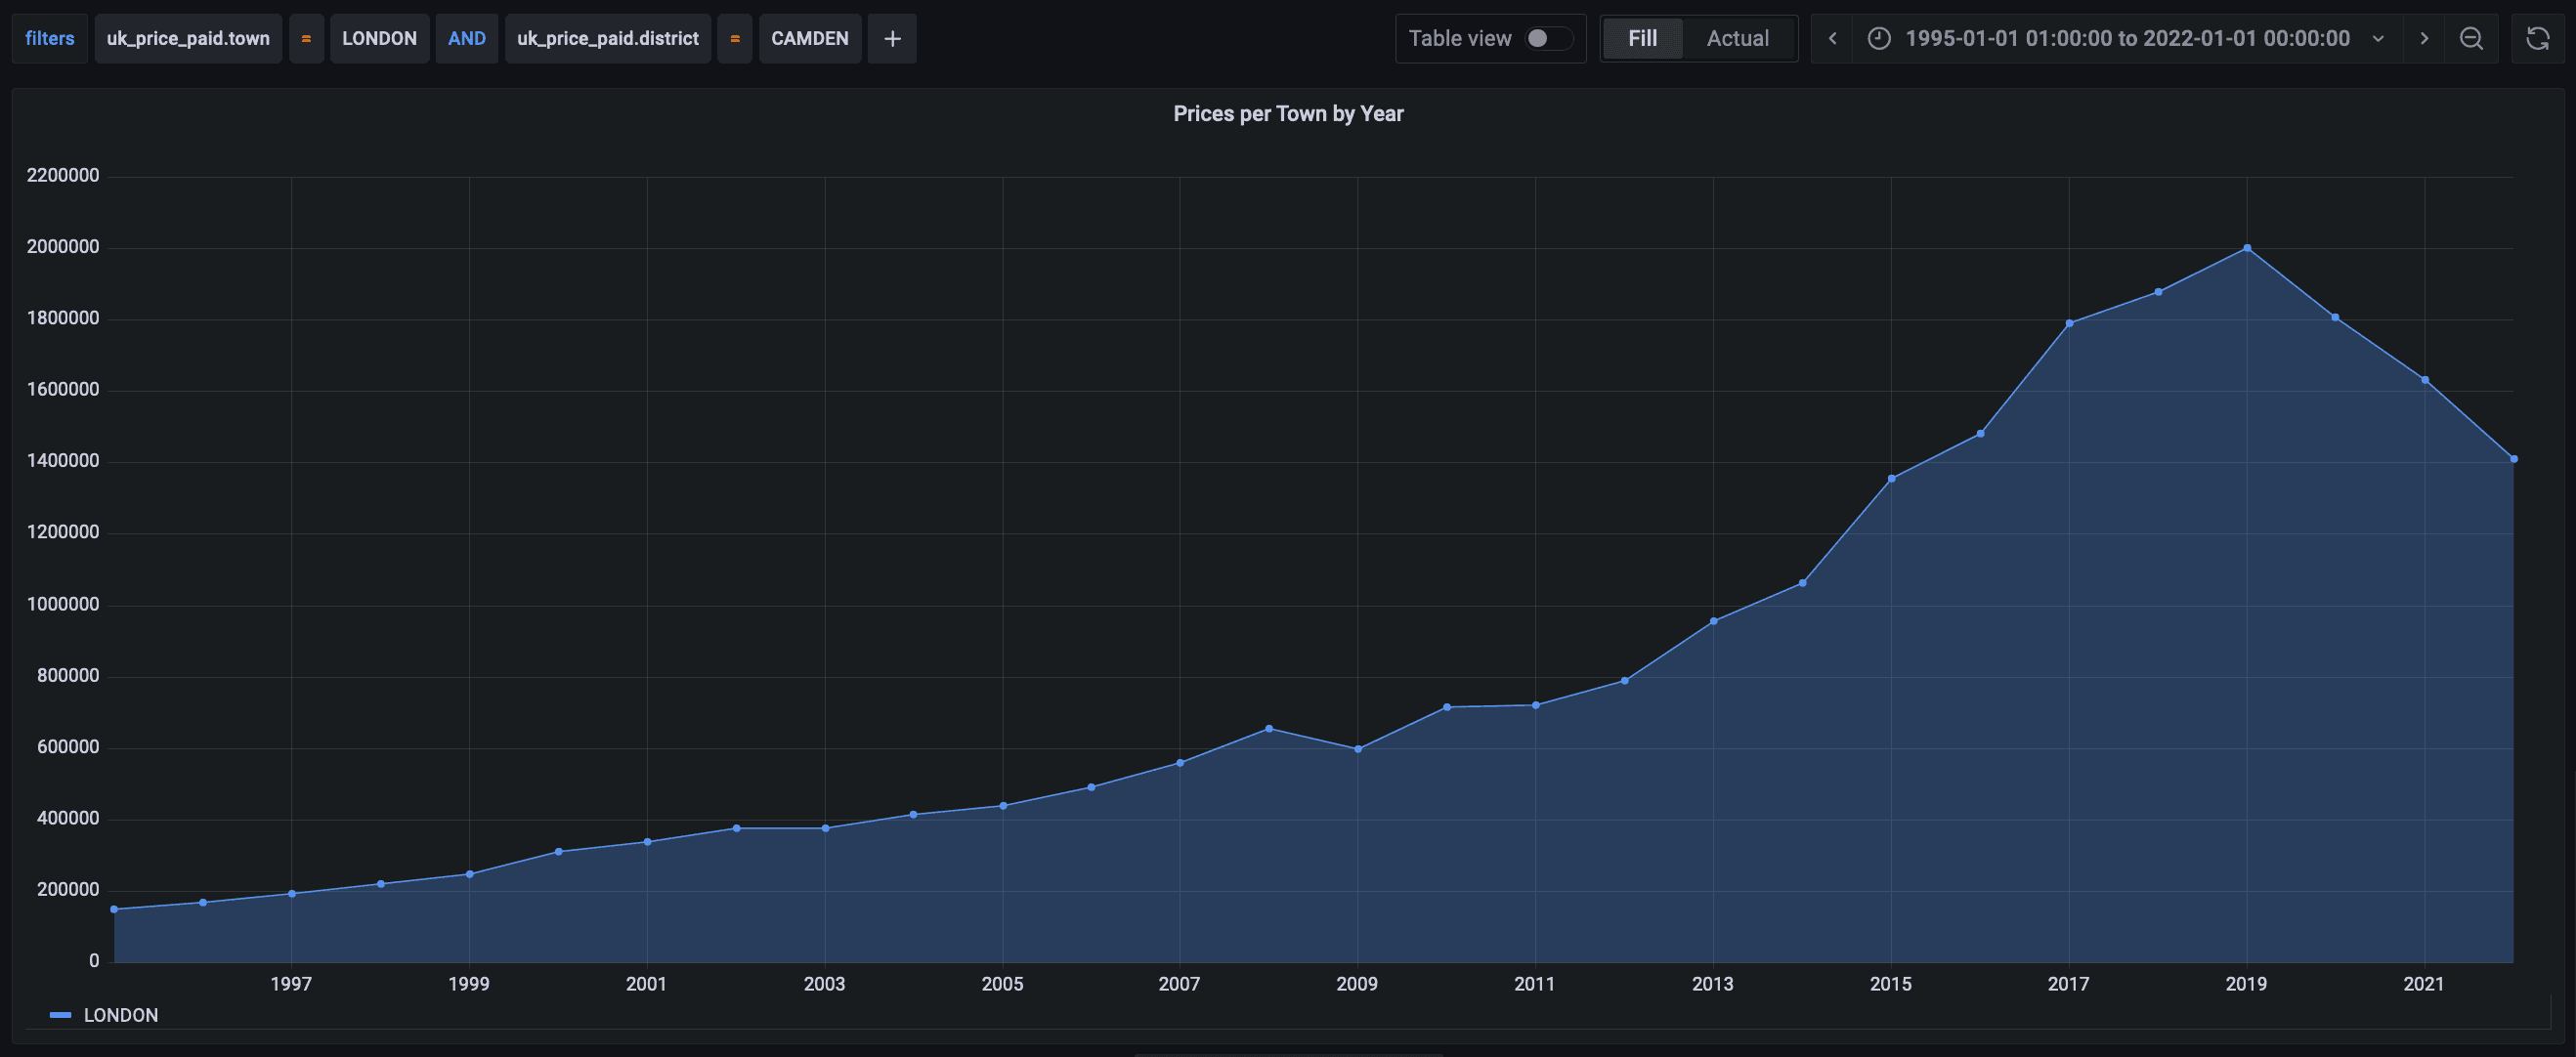
For the correct result, ClickHouse needs to ensure the filter is injected into the top level WHERE clause.
While added in response to a Grafana requirement, this feature is available for wider tooling to exploit and improve their offerings. Please let us know if this proves useful!
The need for HTTP #
Under the hood, the Grafana plugin uses the clickhouse-go client for sending queries to ClickHouse. Historically, this client communicated over the ClickHouse binary protocol using the native format. This represents the most efficient means of communication and was selected for performance reasons. This makes sense for INSERT heavy use cases but less so for the aggregation queries commonly used in Grafana. Our users often require traffic to be transmitted over HTTP to allow switching on load balancers or to utilize proxy solutions such as ch-proxy.
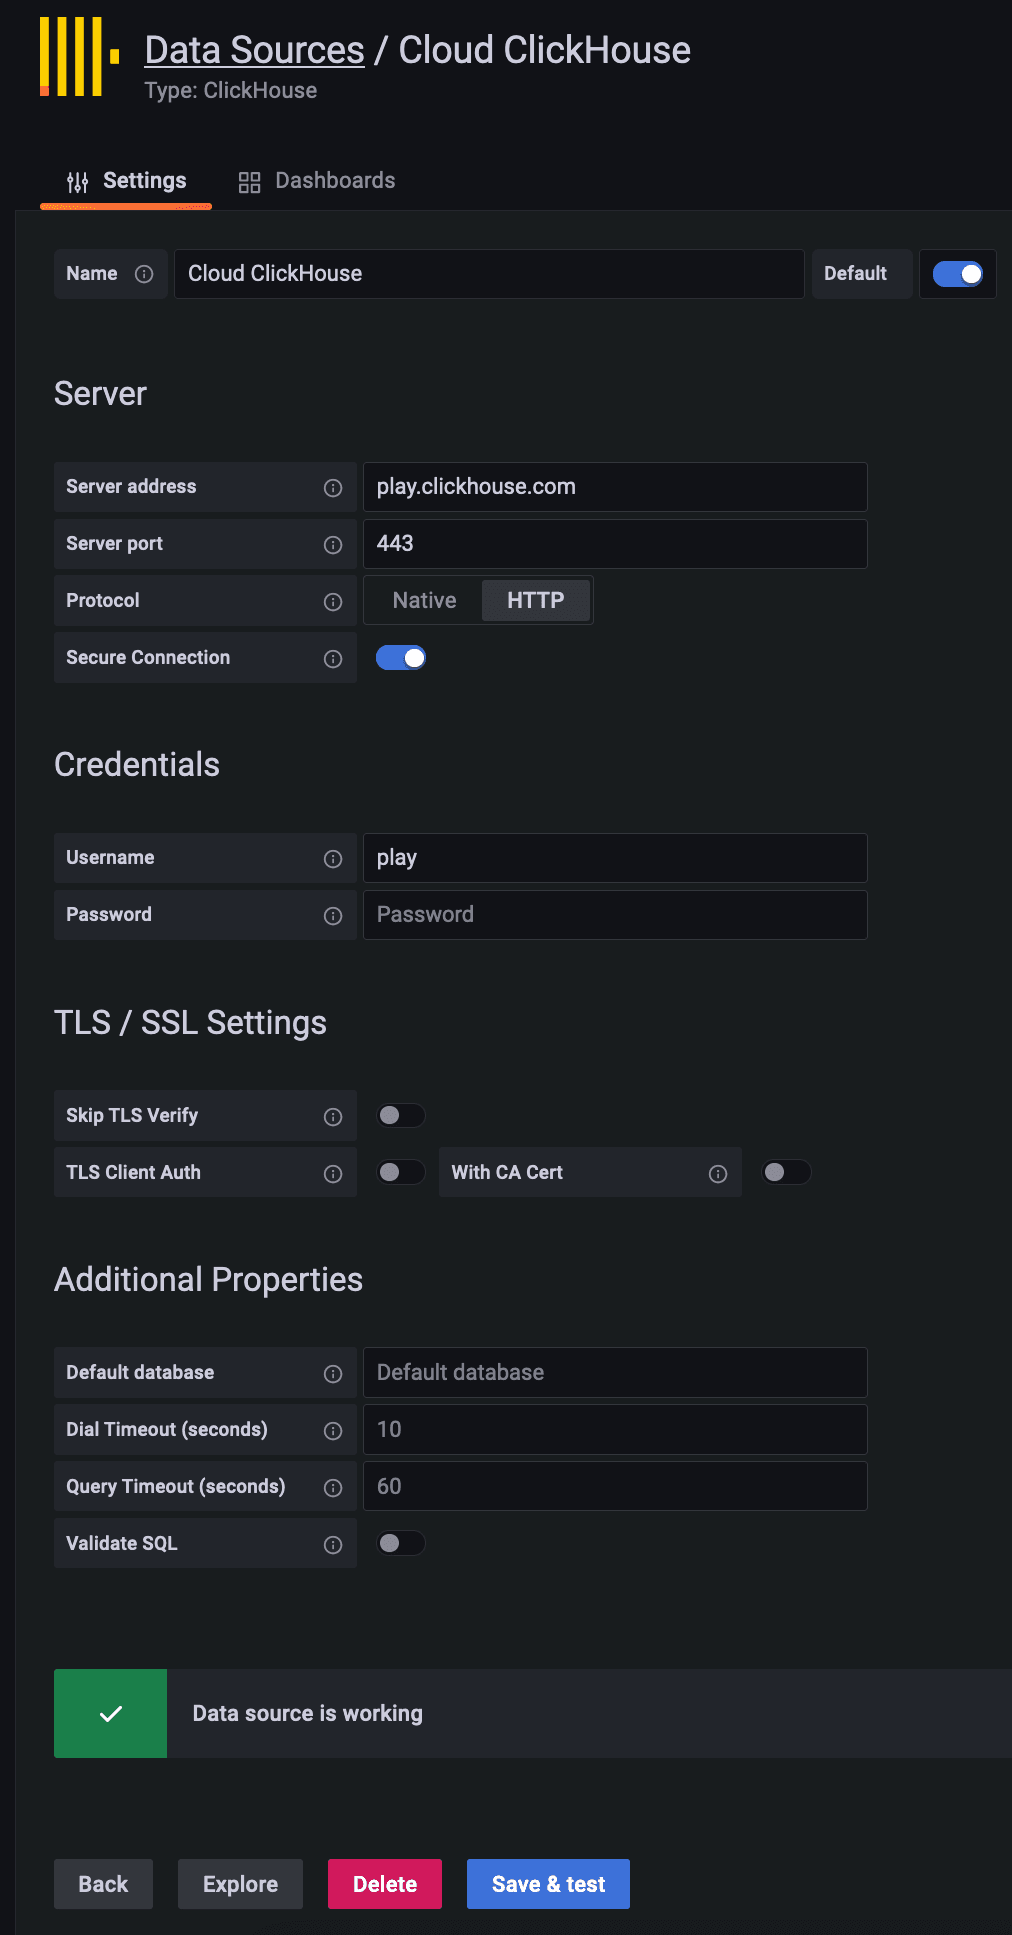
Support for native format over HTTP has been added to the clickhouse-go driver thanks to a community contribution. This capability is now exposed in Grafana and can be selected at a data source level.
For those trying this feature, recall that HTTP uses a different port than Native - 8123/8443 for HTTP/HTTPS by default. Finally, we have separated the connection and query timeouts which previously used the same value.
Welcome semi-structured data #
ClickHouse 22.6 added support for JSON as a data type. The JSON Object type is advantageous when dealing with complex nested structures, which are subject to change. The type automatically infers the columns from the structure during insertion and merges these into the existing table schema. Columns will be created as required, allowing the user to handle semi-structured data without maintaining a schema. This capability has many uses, not least simplifying the use of ClickHouse as a log storage engine.
Shortly after its addition to ClickHouse, support for JSON was added to the clickhouse-go client. This support has now been implemented in our Grafana plugin in v2.0.
JSON leaf nodes can now be used like any other column of the equivalent primitive type for charting. Columns that represent a JSON object or list of JSON objects are handled like the Tuple and Nested types in ClickHouse, respectively. In Grafana, this means rendering them as JSON strings. While this is not compatible with Grafana charting, JSON objects can be displayed in the Explore view or Logs Panel - a useful addition for those storing structured logs in ClickHouse.
For testing this feature, users can use a subset of the logs dataset described here. Here we use a simple schema:
  1SET allow_experimental_object_type=1;
2
3CREATE TABLE http_logs
4(
5    `message` JSON,
6    `timestamp` DateTime
7)
8ENGINE = MergeTree()
9ORDER BY timestamp;
10
11INSERT INTO http_logs (timestamp, message) SELECT
12    `@timestamp` AS timestamp,
13    concat('{"status":', toString(status), ', "size":', toString(size), ', "clientip": "', toString(clientip), '", "request": ', toJSONString(request), '}') AS message
14FROM s3('https://datasets-documentation.s3.eu-west-3.amazonaws.com/http/documents-01.ndjson.gz', 'JSONEachRow')
We insert the data above from a publically available s3 bucket - feel free to experiment or alternatively use sql.clickhouse.com! Note we ensure we have a time column timestamp separate from the JSON. Each row looks like the following due to moving all columns under the message field.
{"message":{"clientip":"40.135.0.0","request":{"method":"GET","path":"\/images\/hm_bg.jpg","version":"HTTP\/1.0"},"size":24736,"status":200},"timestamp":"1998-04-30 19:30:17"}
These JSON logs can now be rendered in the Explore view, or Logs Panel. We infer a “level” field from the response status, which controls the color rendering. We recommend imposing a LIMIT on all queries to avoid timeouts since Grafana requires the complete result set to be converted to frames.
Histogram rendering for the Explore view is based on the returned results, although we plan for later versions to compute a full range log distribution similar to Loki and Elasticsearch. To ensure users aren’t required to adjust the time frame in Grafana, we shift this dataset to the current timeframe using the dataset’s max date.
  1SELECT
2    now() - (toDateTime('1998-05-08 13:44:46') - timestamp) AS log_time,
3    multiIf(message.status > 500, 'critical', message.status > 400, 'error', message.status > 300, 'warning', 'info') AS level,
4    message.request.method AS method,
5    message.status AS status,
6    message.size AS size,
7    message.request AS log
8FROM logs.http_logs
9ORDER BY timestamp DESC
10LIMIT 10000
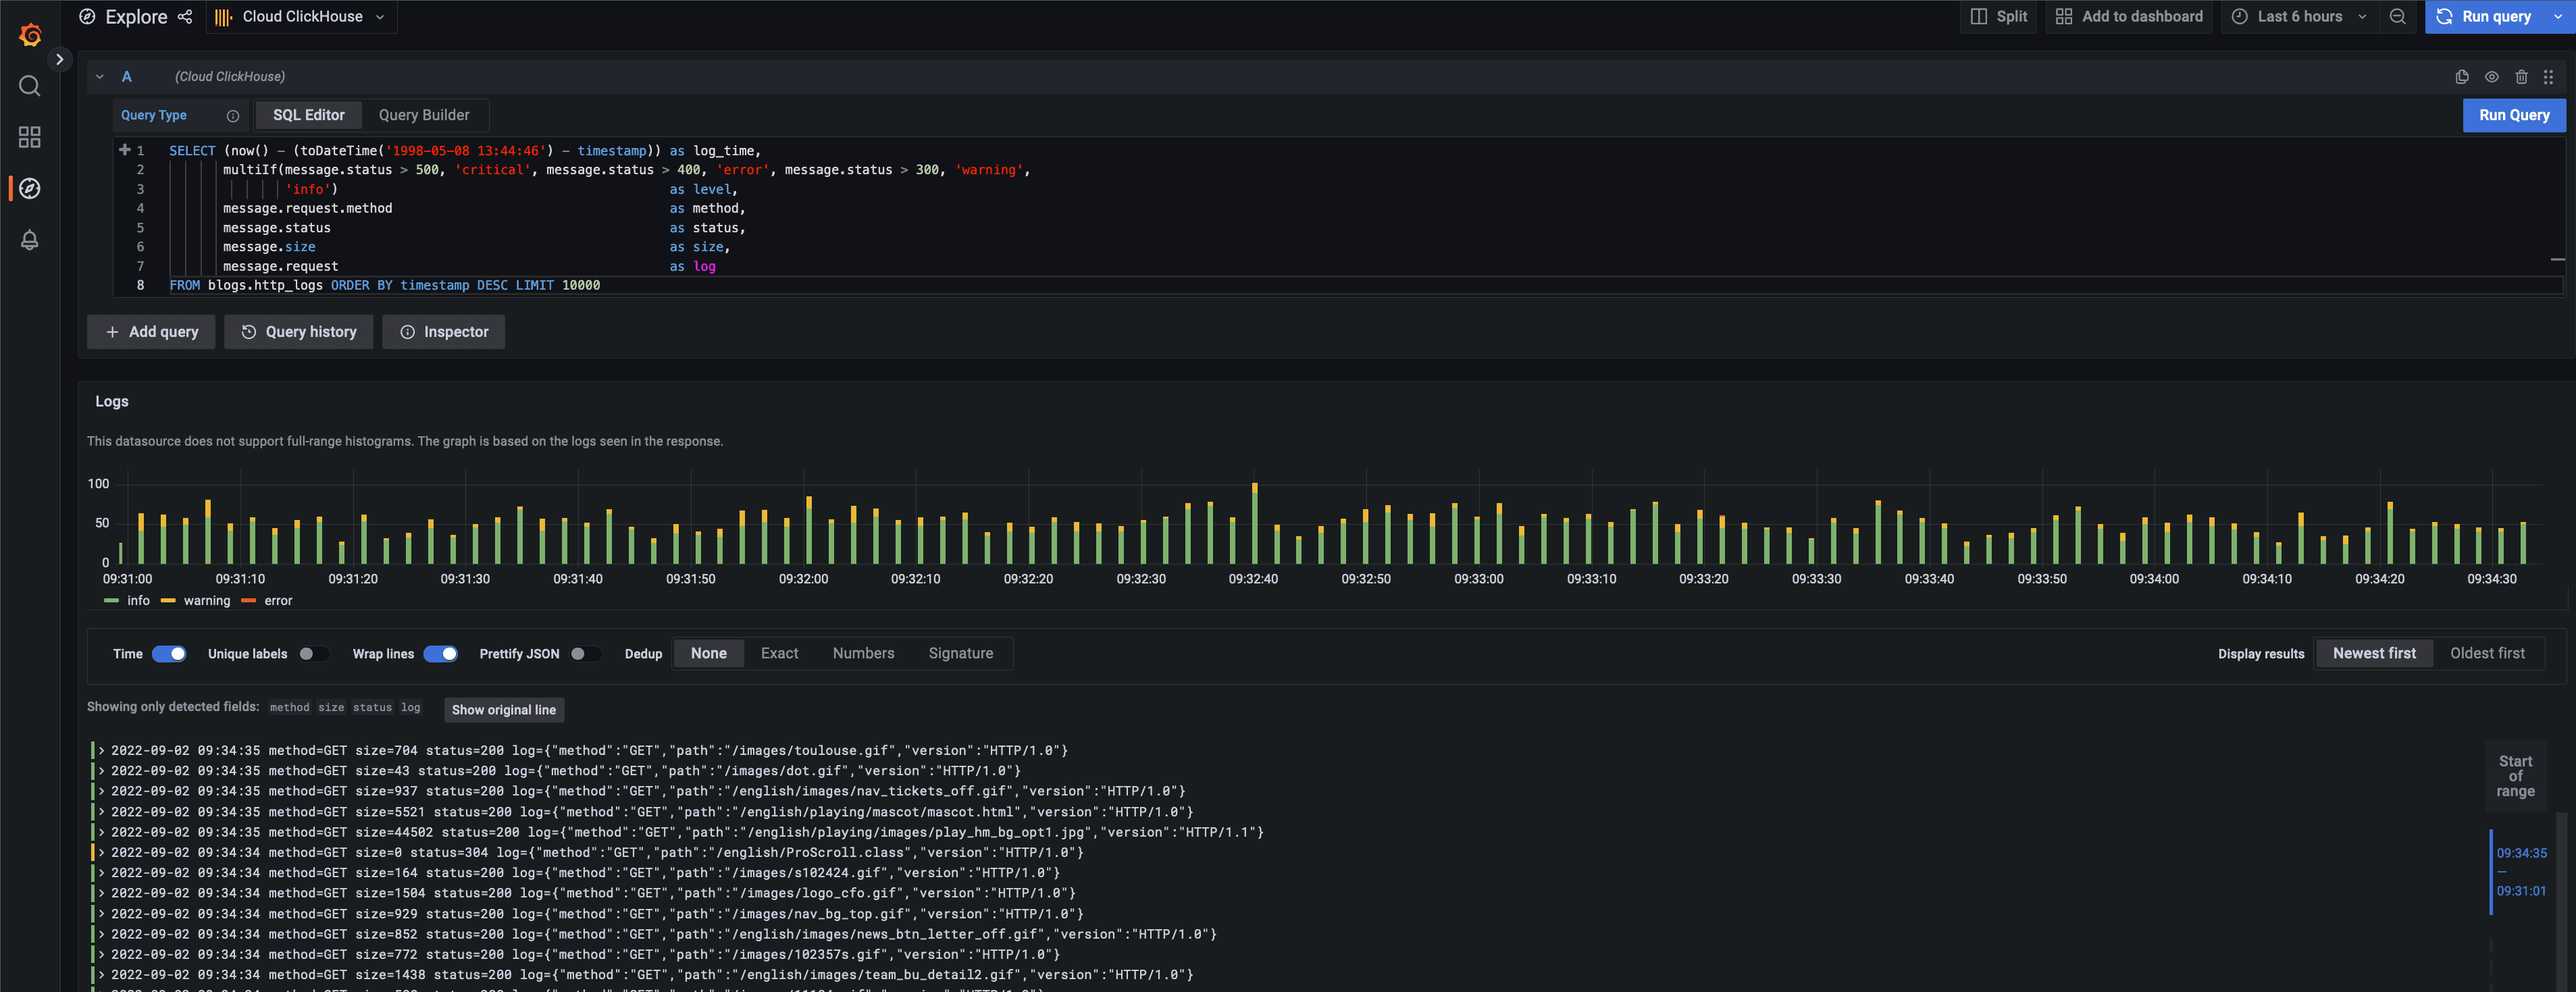
Both the Logs Panel and Explore view are sensitive to field names. For results to be shown using the log visualization mode of Explore (including the histogram), rows must contain and be ordered by a “log_time” field.
JSON support required a rewrite of how we handle ClickHouse types within the plugin. Coverage should now be comprehensive with all types supported, including complex types such as Tuple and Nested that we needed to support as part of the JSON effort.
Changes in Variables #
Historically, we relied on the AST to automatically optimize IN conditions in WHERE clauses for the case where users selected “All” for a variable. The plugin would effectively remove the use of the variable from any WHERE clauses, thus avoiding the need to send the condition. While a nice feature, this relied on the AST and assumed a full understanding of the ClickHouse SQL dialect. In version 2.0, we defer this optimization to the user who should wrap IN clauses, which use a variable, with the macro __conditionalAll.
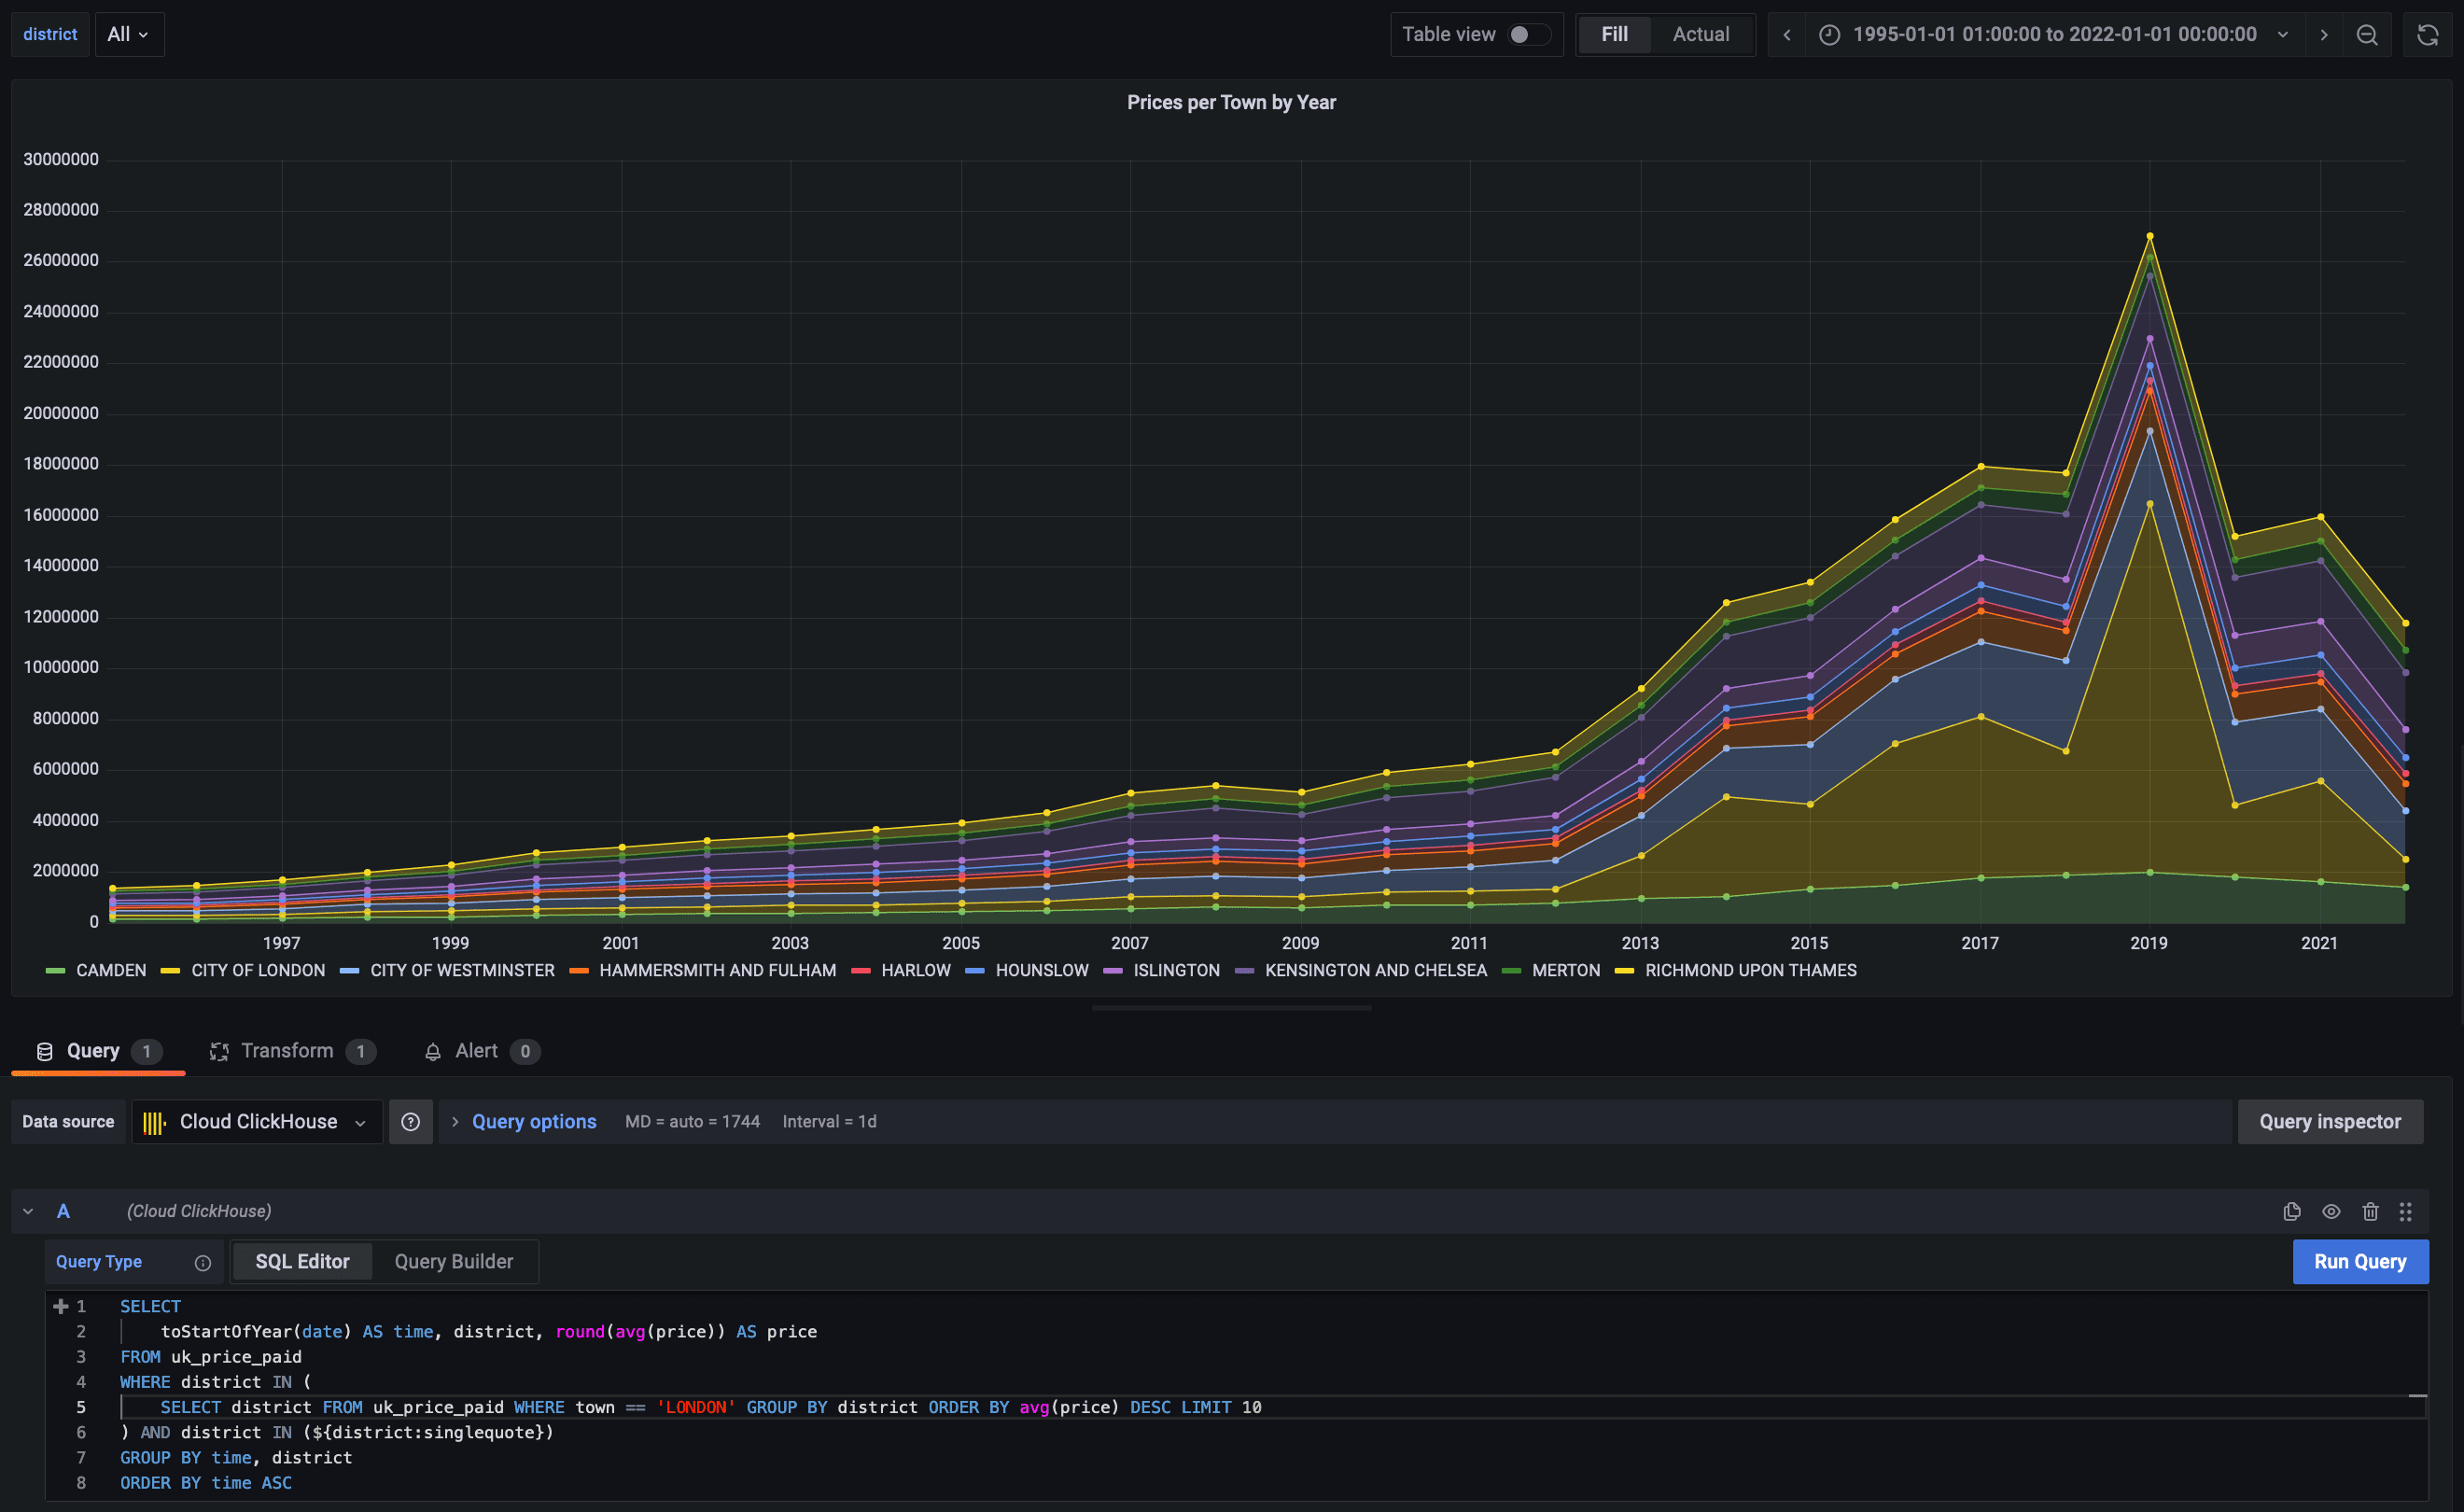
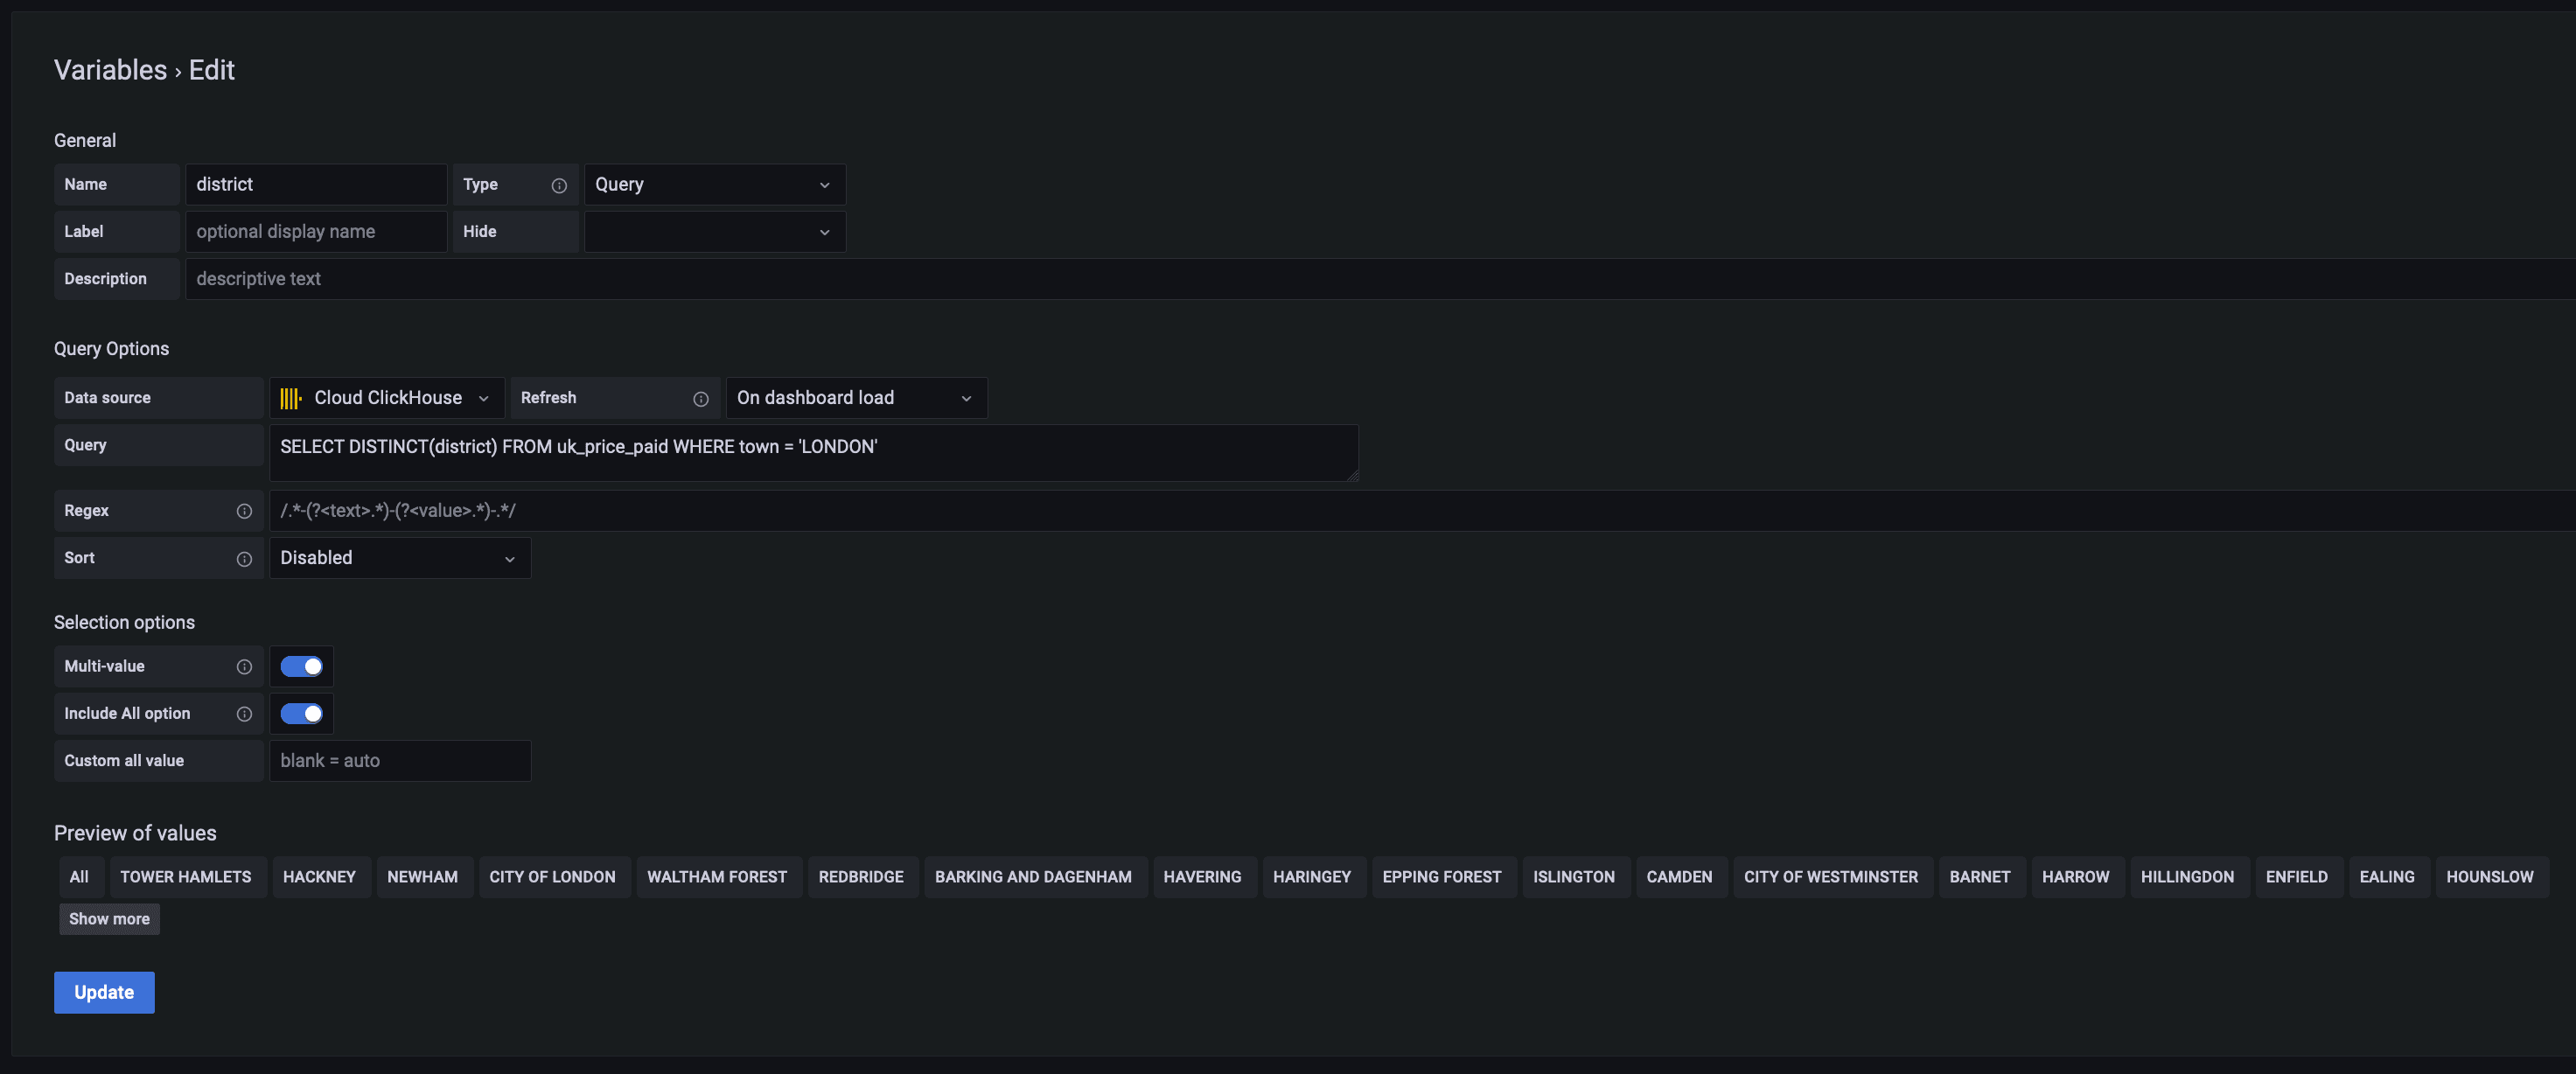
For example, suppose we are visualizing house prices for London and wish to allow filtering by a user selected district i.e, via district IN (${district:singlequote}):
Our variable filter would look like this - note the ability to select an “All” option:
If All is selected, the query becomes:
  1SELECT
2    toStartOfYear(date) AS time,
3    district,
4    round(avg(price)) AS price
5FROM uk.uk_price_paid
6WHERE (district IN (
7    SELECT district
8    FROM uk.uk_price_paid
9    WHERE town = 'LONDON'
10    GROUP BY district
11    ORDER BY avg(price) DESC
12    LIMIT 10
13)) AND (district IN ('TOWER HAMLETS', 'HACKNEY', 'NEWHAM', 'CITY OF LONDON', 'WALTHAM FOREST', 'REDBRIDGE', 'BARKING AND DAGENHAM', 'HAVERING', 'HARINGEY', 'EPPING FOREST', 'ISLINGTON', 'CAMDEN', 'CITY OF WESTMINSTER', 'BARNET', 'HARROW', 'HILLINGDON', 'ENFIELD', 'EALING', 'HOUNSLOW', 'HAMMERSMITH AND FULHAM', 'LEWISHAM', 'BRENT', 'WANDSWORTH', 'SOUTHWARK', 'LAMBETH', 'GREENWICH', 'KENSINGTON AND CHELSEA', 'MERTON', 'BROMLEY', 'RICHMOND UPON THAMES', 'CROYDON', 'BEXLEY', 'KINGSTON UPON THAMES', 'HARLOW', 'SUTTON', 'CITY OF BRISTOL', 'MALVERN HILLS', 'THURROCK', 'RHONDDA CYNON TAFF'))
14GROUP BY
15    time,
16    district
17ORDER BY time ASC
Whilst fine for variables with only a few values, such as districts in London, it becomes a performance overhead for longer lists. To optimize, the user can surround the clause with an __conditionalAll e.g.
  1SELECT toStartOfYear(date) AS time,
2       town,
3       round(avg(price))   AS price
4FROM uk_price_paid
5WHERE town IN (
6    SELECT town
7    FROM uk_price_paid
8    WHERE town != 'GATWICK' AND $__conditionalAll(district IN (${district:singlequote}), $district)
9    GROUP BY town
10    ORDER BY avg(price) DESC
11    LIMIT 10
12)
13GROUP BY time, town
14ORDER BY time ASC
On selecting “All” the district restriction is simply replaced with a 1=1 condition.
  1SELECT
2    toStartOfYear(date) AS time,
3    district,
4    round(avg(price)) AS price
5FROM uk.uk_price_paid
6WHERE (district IN (
7    SELECT district
8    FROM uk.uk_price_paid
9    WHERE uk_price_paid.town = 'LONDON'
10    GROUP BY district
11    ORDER BY avg(price) DESC
12    LIMIT 10
13)) AND (1 = 1)
14GROUP BY
15    time,
16    district
17ORDER BY time ASC
Be aware of changes #
As well as the large additions described above, we’ve fixed several bugs with this release. The removal of the AST specifically means this release does have some breaking changes, beyond the need to manually optimize IN filters, that users should be aware of:
- The new Adhoc filter implementation relies on the
additional_table_filtersfeature and thus ClickHouse 22.7. Older versions of ClickHouse will not populate filters. Do not upgrade your plugin if you cannot move to a version of ClickHouse greater or equal to this release. additional_table_filtersare passed in SETTINGS with the query itself. This is not permitted for read-only users unless readonly=2. This is not ideal, and we would not recommend setting this for public instances of ClickHouse. We recognize improvement is required here. Stay tuned.
For the reasons above, Adhoc filters will not work against sql.clickhouse.com.
For users wanting to contribute or follow the latest issues and improvements, the official ClickHouse plugin is an open-source project hosted on GitHub and implemented in TypeScript and Go. We always value your feedback and encourage users to raise issues so we can continue to improve the plugin.


