Introduction #
ClickHouse’s name derives from a combination of "Clickstream" and "Data Warehouse". This captures the use case for which it was originally designed: keeping records of all clicks by people from all over the Internet. Although the range of use cases to which ClickHouse is applied has diversified, it still remains hugely popular for analytics relying on the capture of web events. Product Analytics represents a natural extension of this use case, focusing on tracking and analyzing how users interact with products to drive insights into user behavior, engagement, and satisfaction.
In this blog, we’ll guide you through building a powerful product analytics solution with ClickHouse, sharing insights on essential data schemas, typical workflows that product managers and growth marketers depend on, and the key queries for extracting valuable metrics. This guide draws from our experience developing and running our own in-house product analytics platform, Galaxy, which has provided actionable insights and proven reliability over nearly two years of operation.
With over 20 billion events and 14 TB of data, Galaxy has empowered us to quantitatively assess the impact of every design and product decision we make. The platform enables A/B testing and the measurement of common user workflows, allowing us to refine and enhance the ClickHouse Cloud experience continually.
What is product analytics? #
Product analytics is the practice of collecting, analyzing, and interpreting data on how users interact with a product. This goes beyond basic web analytics that many of us are familiar with through tools such as Google Analytics, by focusing on user actions, patterns, and behaviors within a product to uncover insights that inform decision-making.
Product analytics helps answer critical questions such as: What actions correlate with higher engagement or churn? Where do users experience friction in workflows? How do users navigate through features? By tracking and analyzing feature usage through events such as clicks, product teams can better understand user needs, improve the user experience, and optimize key metrics like conversion rates and retention. This continuous feedback loop is invaluable for product managers and growth marketers, as it allows them to make data-driven adjustments that drive product adoption, engagement, and overall satisfaction.
Why ClickHouse for product analytics? #
Much like web analytics, product analytics deals with large volumes of event-driven data generated by user actions—such as clicks, swipes, and interactions within an application. Subsequent questions product managers and growth marketers ask of this data tend to be both temporal and complex, looking to analyze patterns over time, such as where users stop using the product in a signup workflow, what usage patterns predict higher customer lifetime value, and which portions of the product may require more guidance or benefit from a redesign.
The access patterns demand a high-performance data store that can manage rapid event ingestion, complex querying, and high concurrency, making ClickHouse an ideal fit. Its columnar storage, real-time data ingestion capabilities, and efficiency in handling massive datasets enable product teams to gain timely, actionable insights into user behavior. Importantly, users can ask almost any question imaginable by simply writing SQL!
Furthermore, ClickHouse’s columnar-oriented design, coupled with the fact that data values are sorted on insert, allows a high level of compression with 15x not uncommon on most text formats. These compression capabilities are crucial in enabling users to cost-effectively store every interaction with high fidelity, allowing them to capture rich data with indefinite retention without concerns over storage costs. This, in turn, unlocks flexibility as users aren’t required to identify upfront all questions they wish to ask; rather, all data can be stored and used later to answer questions that weren’t anticipated.
In our own Galaxy environment, we achieve at least 14x compression, enabling us to retain extensive historical data and supporting deep, retrospective analyses.
ClickHouse’s high-performance aggregation capabilities enable users to answer complex questions in real-time, significantly enhancing productivity for product managers who no longer need to wait minutes for query results. For example, imagine being able to compute how your acquisition, activation and conversion rates have changed over time in less than a second.
This responsiveness empowers teams to explore more questions, fostering a culture of curiosity and deeper insights. Tracking the impact of product changes in real-time as data is ingested has been invaluable for our own product managers, allowing them to A/B test features rapidly and assess their effects on key funnel metrics. This agility ensures that features showing a positive impact are retained, while those that don’t meet expectations can be swiftly adjusted or reverted.
Build vs buy #
Given ClickHouse’s strengths in handling product analytics workloads, it’s no surprise that many product analytics solutions, such as PostHog, rely on ClickHouse as their primary data store and analytical engine. However, this raises an important question: should you build your own solution on top of ClickHouse or use an out-of-the-box offering like PostHog?
The choice depends on several factors, including your need for flexibility in event collection, your team’s familiarity with SQL, and the extent to which you want to correlate product analytics data with other sources.
For example, in our own case:
- Event Collection Control: We require precise control over the events we capture, allowing developers to decide which events to send and when. To support this, we developed a custom SDK that empowers our developers to instrument their code with full control.
- SQL Proficiency: Our primary users, including product managers and growth marketers, are highly proficient in SQL, enabling them to explore data directly and create custom queries as needed.
- Data Correlation Across Sources: Our data warehouse, powered by ClickHouse, aggregates data from sources like Salesforce, Google Analytics, and billing and metering systems. Additionally, our observability solution for ClickHouse Cloud (handling logs, metrics, and traces) also relies on ClickHouse. Integrating product analytics with these datasets allows us to answer complex, cross-functional questions. For instance, we can analyze whether customer churn correlates with errors in ClickHouse Cloud clusters (product analytics + observability) or track spending across different customer cohorts (product analytics + billing).
- Cost - we wanted both infinite retention and the ability to issue an unlimited number of queries at a fixed cost, with no constraints placed on our developers on what they can send.
For these reasons, we were confident that an in-house solution was the right choice. Whether you decide to build or buy, the following insights may be valuable for understanding how to design and operate a ClickHouse-powered product analytics solution effectively.
Denormalized events #
As a column-oriented database, ClickHouse is optimized for large numbers of rows in a single table with a moderate number of columns (100s are fine). While joins are fully supported, the number of events generated in product analytics typically means users are better off avoiding the associated query time overhead and using a single sparse table. Fortunately, this sparsity, caused by storing multiple event types in the same table where a subset of events possibly uses some columns, incurs little overhead for ClickHouse as values are sorted and compressed. Contiguous sequences of empty values compress extremely well, resulting in fast reads due to reduced I/O thanks to techniques such as sparse serialization as shown in the diagram below.
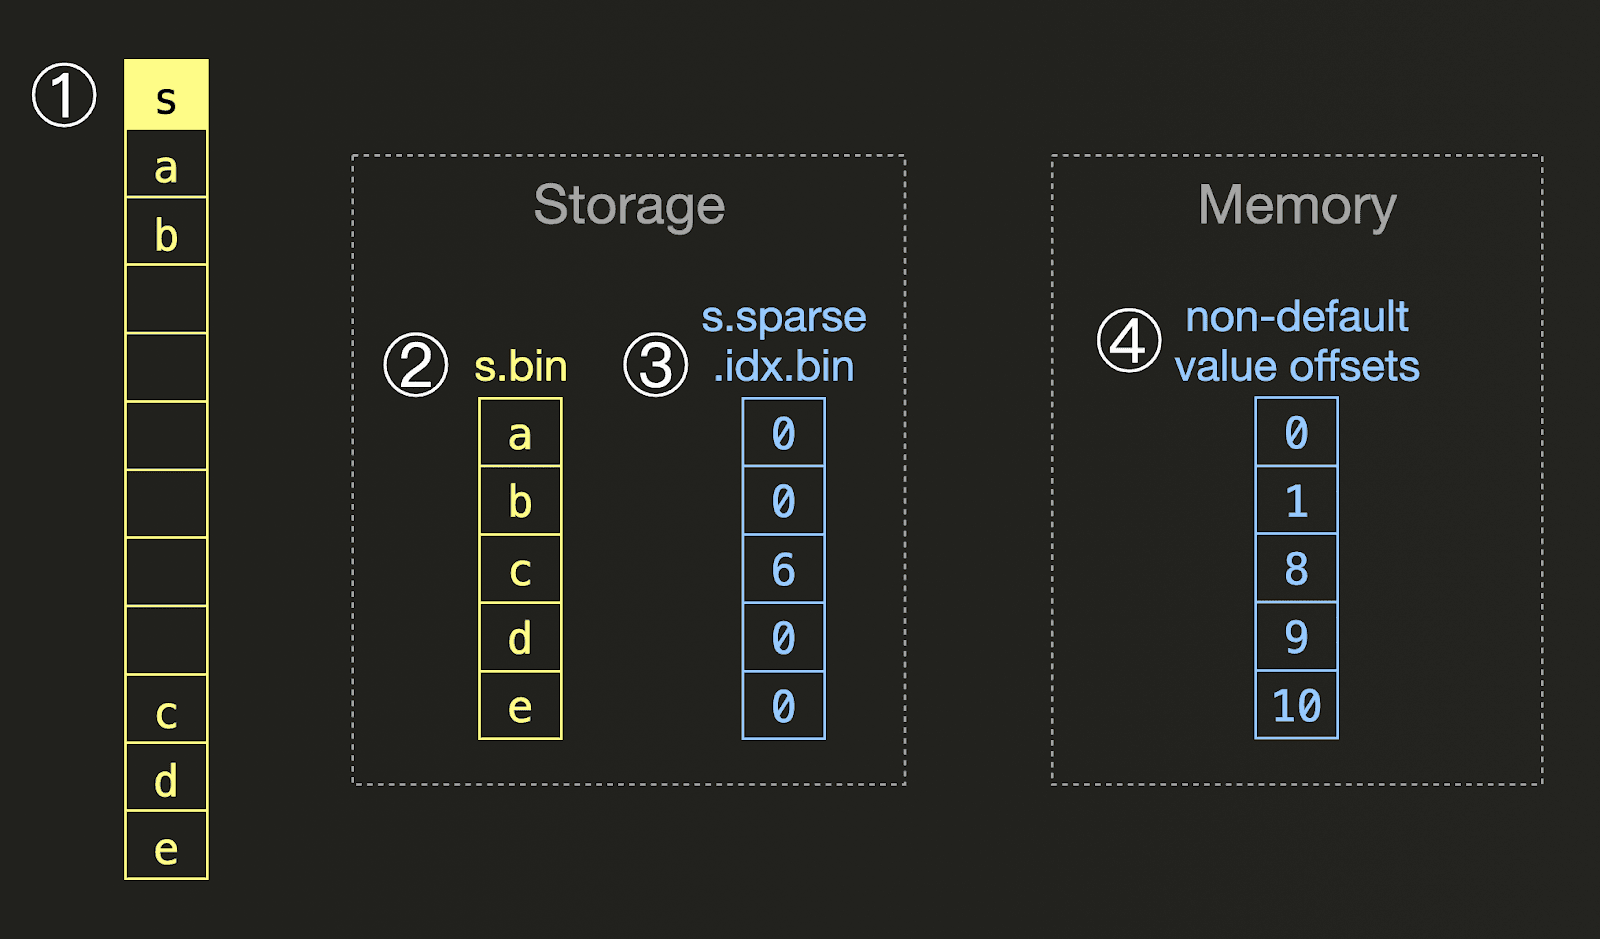
For a ① column s containing sparse values, ClickHouse only writes the non-default values into ② a column file on disk, together with ③ an additional file containing a sparse encoding of the non-default value offsets: For each non-default value, we store how many default values are present directly before the non-default value. At query time, an ④ in-memory representation with direct offsets is created from this encoding. The sparse encoded on-storage variant contains data with repeated values.
By avoiding JOINs and utilizing mainly aggregations with filters to answer queries, users can experience sub-second query performance on the TB scale. For these reasons, our own product analytics implementation uses a single table in which all events are collected.
Getting started schema #
Our current schema for Galaxy is shown below:
  1CREATE TABLE galaxy.forensics
2(
3	`created_at` DateTime('UTC') DEFAULT now(),
4	`environment` LowCardinality(String),
5	`session_id` String,
6	`request_id` String,
7	`client_ip` IPv4,
8	`org_id` UUID,
9	`user_id` String,
10	`namespace` String,
11	`component` String,
12	`event` String,
13	`interaction` LowCardinality(String),
14	`payload` String,
15	`message` String
16)
17ENGINE = MergeTree
18ORDER BY created_at
Elements of this schema are specific to Galaxy, while others are reusable. More specifically:
created_at- the time at which the event occurred. This is filtered in most queries and is thus the primary key (see below)environment- dev/staging/production allows us to differentiate between events coming from each environment.session_id- generated per user session. We generate this guid and store it in the browser session storage. Note that this means it is not consistent across tabs or browser restarts for a user - we are interested in measuring behavior within a session. This is an implementation detail of our event capture library (see below). The columnsuser_idandorg_idallow us to aggregate across sessions.request_id- unique identifier for a specific request. We predominantly use this to correlate requests with server-side logs.client_ip- IP of the requesting client.user_id- id of the logged-in usernamespace- The first level in the event hierarchy. This denotes both the application from which an event originates as well as the specific view e.g. the billing page.component- The component on the page from which the event was generated e.g. a form to enter user details.event- the specific event. These have varying degrees of granularity. Generic events for actions which are expected to be less interesting might beclick,blur,close. For actions which are more important for us to track we use higher fidelity events e.g.serviceSelection.interaction- Whether the event was by a direct user interaction e.g.clickor indirectlytriggeredthrough a user interaction. For example, suppose clicking a button causes a user details panel to open. While the button would have an event associated with aclickevent and interaction, a separateuser_details_panel_openevent would be created with the valuetriggeredforinteraction.payload- a JSON string containing arbitrary data associated with the event. This contains columns such as the Google Analytics ID, country of origin, and page path.
The following are ClickHouse specific:
org_id- specific to ClickHouse Cloud*, this column details the organization with which the request was associated. This can be thought of as an account ID and is used frequently to join cohort metrics, as we later see.
The key learning from the above is users should ensure columns that are queried in most queries, e.g. for which cohorts are formed, should be top-level columns and not part of the payload. The latter is used for arbitrary event data and is more inefficient to query (with respect to syntax and performance), as we show below. An important observation is also that a user interaction can cause more than one event to be generated - one for the initial click interaction and multiple for events that trigger as a result e.g. dialog being rendered.
Primary keys to accelerate queries #
The majority of our product analytics queries are time-based, with most queries targeted to the most recent data. For this reason, our forensics table uses the primary key created_at. Users should adapt this based on their access patterns according to best practices. In general, we recommend setting columns that are frequently used for filtering as part of the primary key, such as the time column or identifier column.
Materialized views for common access patterns #
Product analytics can be characterized by reasonably predictable access patterns. This is the case for our analysis, where several dozen queries compromise over 90% of the analysis. While ad-hoc analysis is performed, these "common" queries form the foundation of our periodic reporting and product retrospectives.
For this reason, we heavily exploit ClickHouse's incremental materialized views to optimize these common queries. In most cases, they are simple queries that filter inserted events sent to the main forensics table, sending the results to a new target table. This target table contains both a subset of columns and rows, using a primary key and secondary indices optimized for use in subsequent queries.
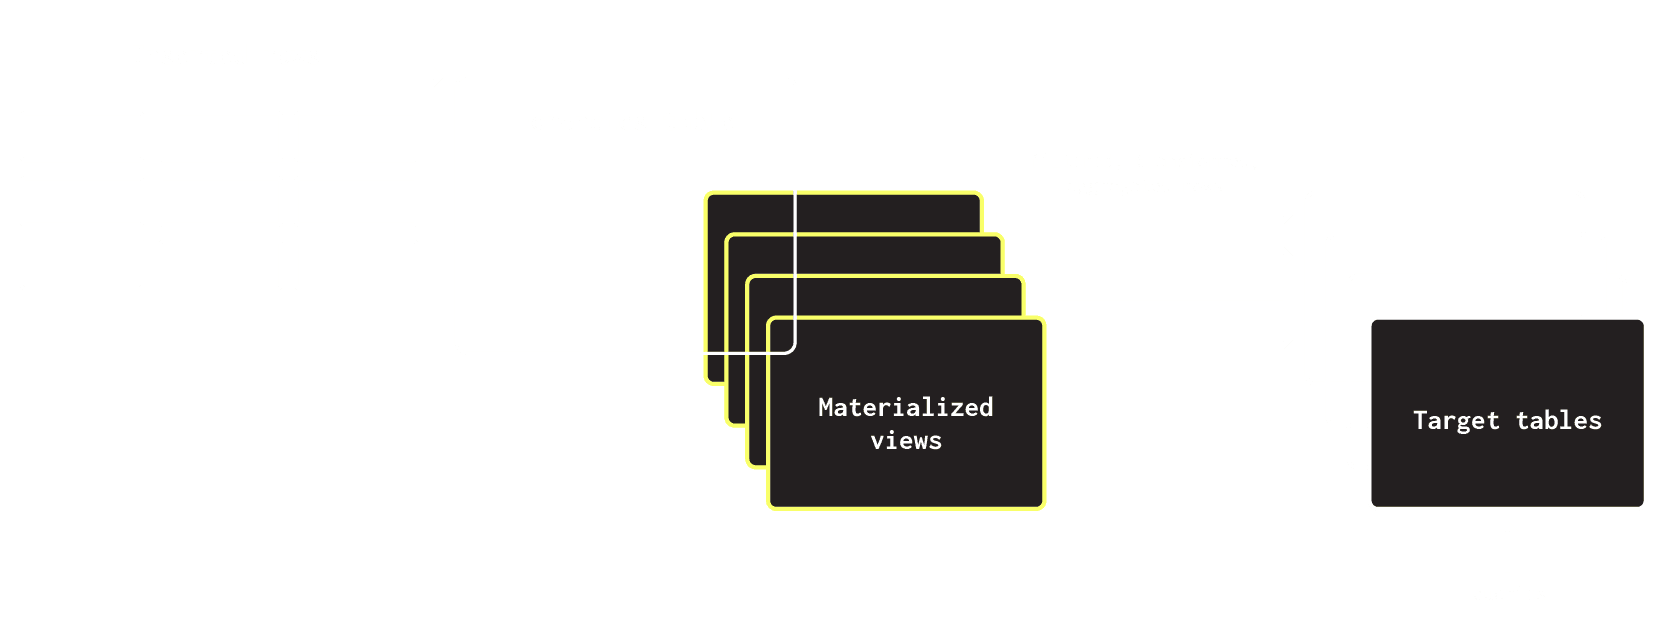
As a simple example of this, the prod_pageviews_mv captures a subset of columns for page view events:
  1CREATE TABLE galaxy.prod_pageloads
2(
3	`created_at` DateTime('UTC'),
4	`session_id` String,
5	`user_id` String,
6	`server_ip` String,
7	`page` String,
8	`payload` String
9)
10ENGINE = MergeTree
11ORDER BY page
12SETTINGS index_granularity = 8192
13
14CREATE MATERIALIZED VIEW galaxy.prod_pageloads_mv TO galaxy.prod_pageloads AS
15SELECT
16	created_at,
17	session_id,
18	user_id,
19	server_ip,
20	extract(JSON_VALUE(payload, '$.properties.page'), '^([^?]+)') AS page,
21	payload
22FROM raw_galaxy.prod_forensics
23WHERE event = 'pageLoad'
This smaller table is in turn used to accelerate queries which need to analyze page loads e.g. sign ins and signups.
  1SELECT
2    created_at AS pageload_created_at,
3    decodeURLComponent(extractURLParameter(JSONExtractString(payload, 'properties', 'page', 'origPath'))) AS originalPath,
4    decodeURLComponent(extractURLParameter(JSONExtractRaw(payload, 'properties'), 'pagePath')) AS pagePath,
5    extractURLParameter(JSONExtractRaw(payload, 'properties'), 'loc') AS loc,
6    extractURLParameter(JSONExtractRaw(payload, 'properties'), 'glxid') AS session,
7    session_id,
8    JSONExtractString(payload, 'country') AS country,
9    payload,
10    ROW_NUMBER() OVER (PARTITION BY extractURLParameter(JSONExtractString(payload, 'properties', 'page'), 'glxid') ORDER BY created_at DESC) AS rnk
11FROM raw_galaxy.prod_pageloads
12WHERE page IN ('https://clickhouse.cloud/signUp', 'https://clickhouse.cloud/signIn')
Client libraries and ingestion #
To collect events, we have implemented a simple SDK to ensure event collection is consistent and easily added to any new UI page or component. This SDK is designed to make event collection as simple as possible, ensuring events conform to the schema while allowing users to attach any arbitrary JSON payload.
The simplest form of instrumentation is at a page level, where any blur, focus, or load events will be captured automatically. This requires minimal instrumentation e.g.
import { useGalaxyOnPage } from '../lib/galaxy/galaxy'
export default function HomePage({
  hero,
  seo,
  footerData,
  headerData,
  customerStories,
  platforms
}: HomePageProps) {
  useGalaxyOnPage('homePage')
The useGalaxyOnPage function wraps the more specific useGalaxyOnLoad, useGalaxyOnBlur and useGalaxyOnFocus functions which capture javascript load, focus or blur events. These functions can be used individually where all events for a page do not need to be captured e.g. only the load.
export const useGalaxyOnPage = (
  prefix: string,
  depsArray: Array<unknown> = []
): void => {
  useGalaxyOnLoad(`${prefix}.window.load`)
  useGalaxyOnBlur(`${prefix}.window.blur`, depsArray)
  useGalaxyOnFocus(`${prefix}.window.focus`, depsArray)
}
In cases where more targeted event collection is needed for click events, the SDK provides an useGalaxyOnClick function. This function receives a fully qualified event name in the format <namespace>.<component>.<event_name> (as formulated by the page-level events above).
Note that events are not immediately sent to the Galaxy backend; rather, they are buffered in the browser and periodically flushed for more efficient transfer.
Finally, we also overload console functions to ensure any console functions (log, error, warn, debug, info) are captured as Galaxy events.
Handling noisy data #
Any web or product analytics solution is subject to attackers injecting noisy data, given the browser is sending events to be stored.
We address this in Galaxy by forcing all inserts through a proxy layer. This imposes strict rate limits, filtering to ensure events conform to the schema, and buffering so that ClickHouse receives inserts in reasonably sized batches.

Despite this, we accept there will be instances where noisy data is inserted - these attackers can either be ethically bounty hunting or malicious. In both cases, this data is typically easily identified and periodically removed with lightweight DELETES with common patterns added to upstream filtering rules.
Integrating other datasets #
While page events from your product provide valuable data, they are often insufficient on their own to derive actionable insights. Typical user behaviors can be identified, but to truly assess whether these behaviors benefit your business, they must be correlated with additional data—such as spending metrics. For a SaaS business like ours, this is especially critical. For instance, we need to understand whether certain sequences of user behavior drive increased product usage or, conversely, lead to churn.
Similarly, content marketing teams often seek to determine which website content resonates with users and which pages effectively encourage them to try different features of the service. Achieving this requires unifying product analytics data with web analytics data to uncover meaningful correlations.
As we’ve noted previously, building your own product analytics solution with ClickHouse makes this unification straightforward. ClickHouse allows you to correlate product analytics with other data sources. In earlier blog posts, we’ve shared insights into how we’ve built our own data warehouse on ClickHouse. This warehouse integrates various valuable datasets, enabling us to correlate them with product analytics to uncover impactful business insights.
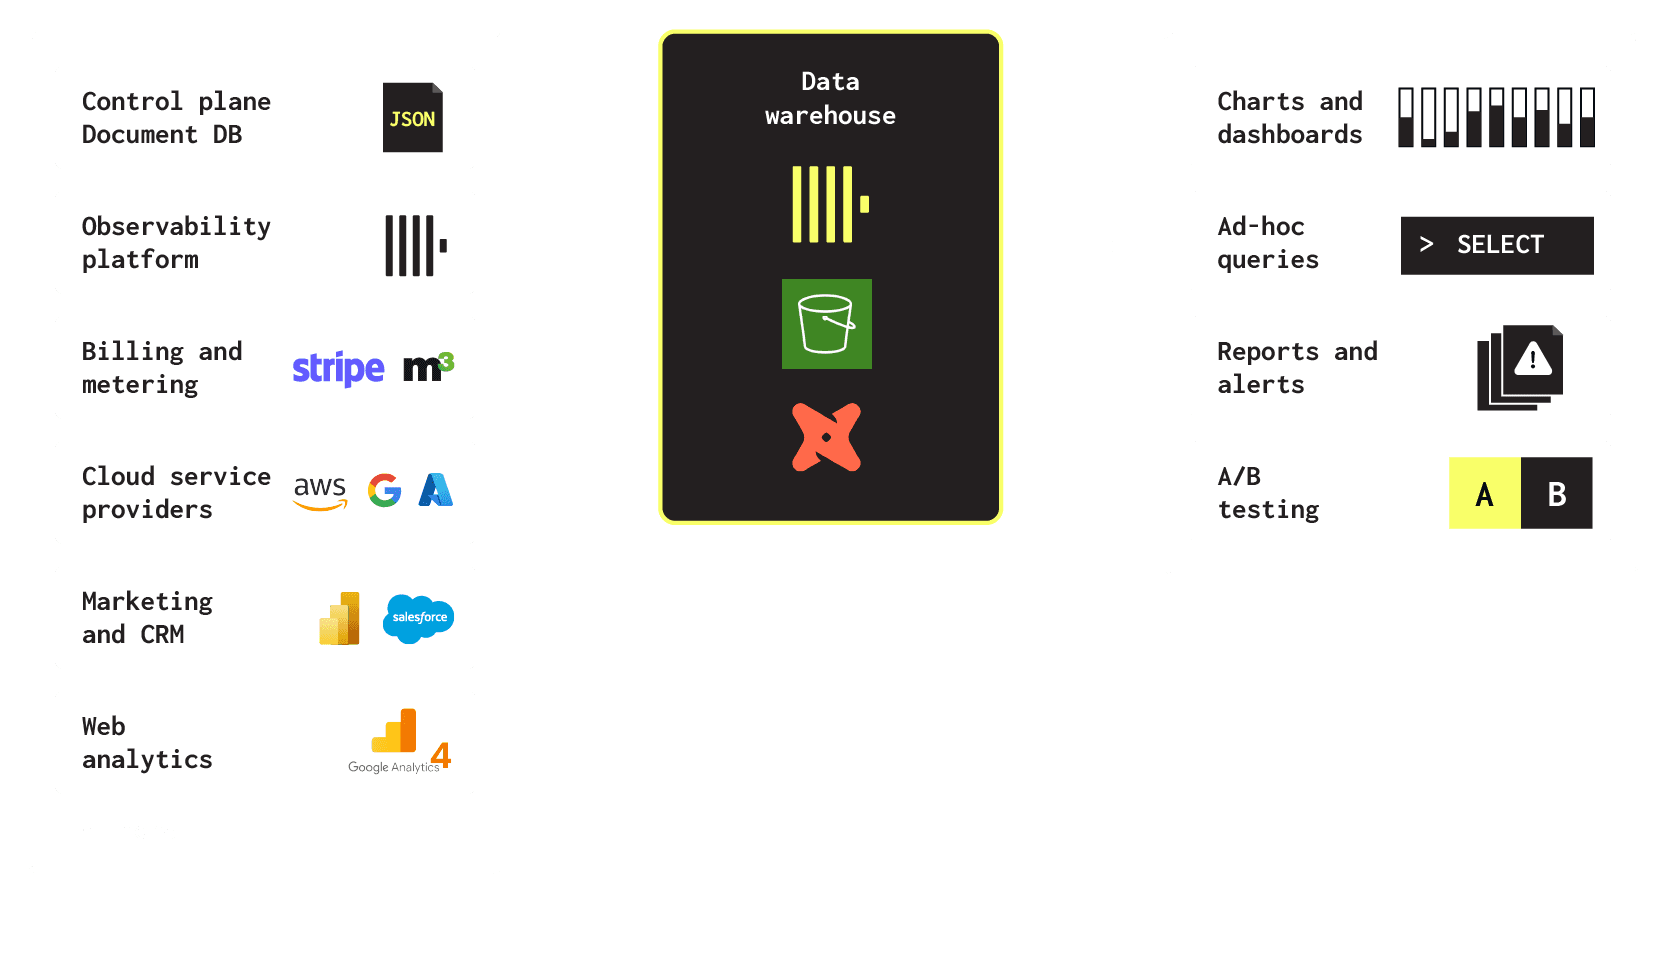
Several of these sources are critical to our day to day analysis:
- Billing and Metering data (m3ter) - allows us to correlate product usage workflows with actual spend and growth.
- LMS data - our learning management system (Matrix LMS) provides details on the course users have taken and can be used to assess the impact of these on usage and activation.
- Marketing and CRM (Salesforce) - to connect accounts to opportunities, qualify leads, and provide one source of truth for our GTM teams.
- Web analytics data - Google Analytics (GA4) data for our main website, is synced to our ClickHouse-powered data warehouse using a process detailed in an earlier blog post. This offers significant advantages, including infinite data retention beyond GA’s default limits, the ability to perform fast and flexible SQL-based queries, and ensuring complete accuracy by avoiding GA’s sampling of results. Beyond these benefits, syncing GA data with our warehouse allows us to correlate website content with product usage, enabling deeper insights into how web interactions drive user engagement and product adoption.
To achieve this, we sync data from our product analytics cluster to our data warehouse, using S3 as an intermediate storage layer. This occurs periodically, using the same dbt-based processes that sync our other data sources. All of our future analysis is thus performed using the data warehouse. This has the advantage of ensuring consistency in our data, a essential property when performing product analytics.
Visualizing data with Superset #
Historically users of our data warehouse would use Superset as the preferred visualization tool. This offers a diverse range of visualizations that are useful for product analytics.
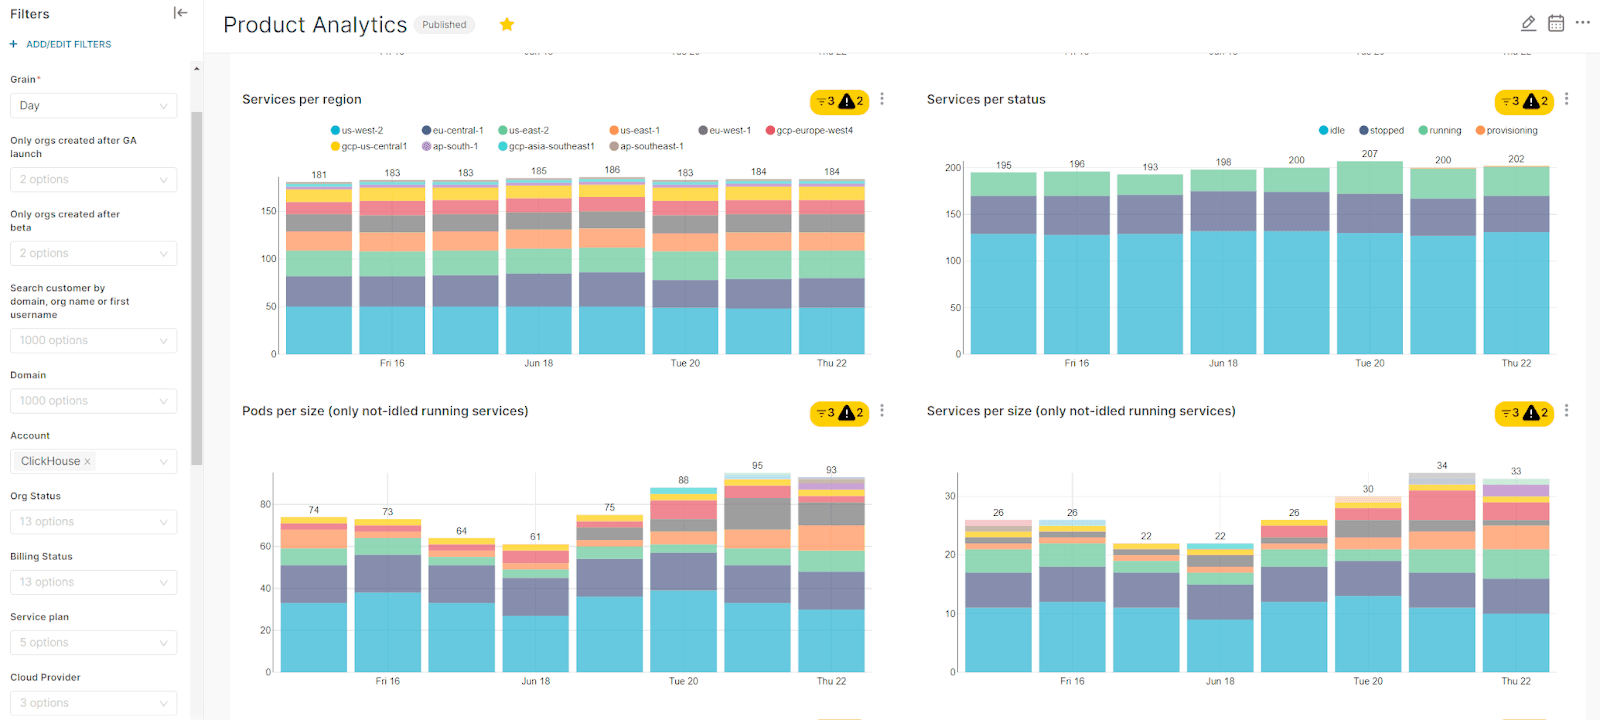
Example Superset dashboard. Note: for illustration purposes, sample data with fake numbers is presented.
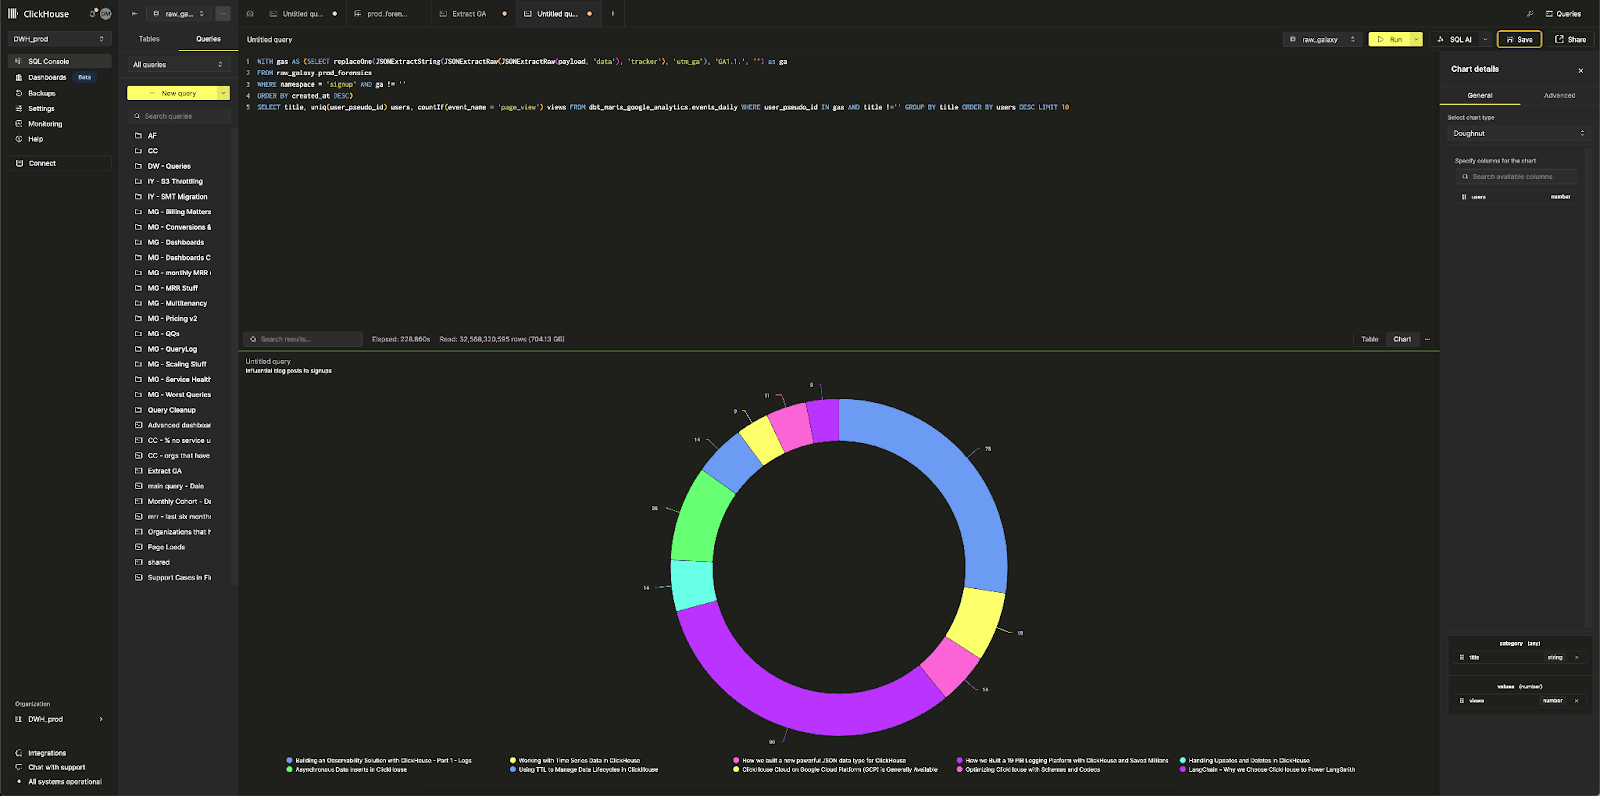
While Superset excels in creating dashboards for regular reporting, it falls short for exploratory analysis - a frequent need for our product managers and marketing team. To address this, we rely primarily on ClickHouse Cloud’s SQL console, where less SQL-proficient users take full advantage of its LLM-powered natural language to SQL capabilities.
Common queries #
Below, we attempt to document some of the queries that address the common product analytics problems, hoping these serve as examples for users. These queries are specific to the schema shown earlier and, in some cases, require external sources like billing data. Note these queries are not always optimized, with explainability prioritized over brevity and efficiency.
Filtering cohorts #
A cohort is a group of users who share a common characteristic or action, usually within a specific time frame. These are then used for analyzing behavior over time. For us, a cohort refers to users who have signed up for ClickHouse Cloud in the last month. This allows us to track and compare their engagement, activation, and conversion trends against other monthly cohorts.
While we can identify a cohort from our billing and metering data, this is also possible in our product analytics with a simple query:
  1SELECT created_at, user_id, ifNull(toString(org_id), 'blah') AS org_id
2FROM galaxy.forensics
3WHERE (environment = 'production') AND (event = 'org-created') AND (org_id IS NOT NULL)
4
5CREATE MATERIALIZED VIEW galaxy.prod_org_creations_mv TO galaxy.prod_org_creations AS
6SELECT
7	created_at,
8      user_id,
9	ifNull(toString(org_id), 'blah') AS org_id
10FROM galaxy.forensics
11WHERE (environment = 'production') AND (event = 'org-created') AND (org_id IS NOT NULL)
Given the frequency with which this result set is used in analysis, this query is converted to a materialized view, prod_org_creations.
Limiting these cohorts to specific periods simply requires filtering on the created_at time. Statistics for these cohorts can thus be computed over defined periods e.g. for a calendar month, and used to identify business trends.
1SELECT * FROM raw_galaxy.prod_orgs_created WHERE toStartOfMonth(created_at) = '2024-08-01'
Measuring time between acquisition, activation and conversion #
Growth marketers will be familiar with the terms acquisition, activation, and conversion. These stages represent key points in a user’s journey and are critical for driving sustainable business growth. Here’s how we define and approach these phases:
- Acquisition: This is the process of attracting and acquiring new users to your platform. For us, acquisition is achieved when a user signs up and creates a service in ClickHouse Cloud.
- Activation: Activation refers to the moment a user experiences the core value of your product for the first time. For us, this happens when a user loads data into a service.
- Conversion: Conversion is the point where a user becomes a paying customer. For us, this occurs when the user enters their credit card details.
Typically, we are interested in the time it takes for users to move through these phases and the % of users who complete each one. We perform this analysis in the context of monthly cohorts as described above.
In order to do this, we create incremental materialized views that represent each of these above steps. For example, the acquisition is recorded with the earlier view prod_org_creations. Similar views prod_service_creations and prod_conversion capture when a service was created and when a user becomes a paying customer.
For example the following user captures when a service is created.
  1CREATE MATERIALIZED VIEW galaxy.prod_service_creations_mv TO galaxy.prod_service_creations
2(
3   `created_at` DateTime('UTC'),
4   `service_id` String,
5   `org_id` UUID
6)
7AS SELECT
8   created_at,
9   JSON_VALUE(payload, '$.properties.service.id') AS service_id,
10   org_id
11FROM galaxy.forensics
12WHERE (environment = 'production') AND (event = 'createdInstance')
Likewise, with a small change to the WHERE clause we use the following (as a Materialized view) to identify conversions to paying customers:
  1SELECT created_at, org_id, event, payload,
2   JSON_VALUE(payload, '$.data.values[1].auditRecord.payload.previousBillingStatus') as old_billing_status,
3   JSON_VALUE(payload, '$.data.values[1].auditRecord.payload.newBillingStatus') as new_billing_status
4FROM
5   galaxy.prod_forensics
6WHERE
7   namespace = 'audit'
8   and event = 'CHANGE_ORGANIZATION_BILLING_STATUS'
9   and new_billing_status = 'PAID'
10ORDER BY created_at asc limit 1 by org_id
11settings function_json_value_return_type_allow_complex = true
These views, which are automatically maintained as data is inserted, can then be used to measure the time between events by joining on the common organization ID. For example, below, we compute quantiles for the time between organizations (accounts) being created and services being created using date functions, grouping by month (using the creation time for an org to attribute metrics to a month).
  1WITH TimeDifferences AS (
2   SELECT
3       org_table.org_id,
4       org_table.org_created_at,
5       service_table.service_created_at,
6       dateDiff('second', org_table.org_created_at, service_table.service_created_at) AS time_difference_seconds,
7       formatDateTime(org_table.org_created_at, '%Y-%m') AS month
8   FROM (
9       SELECT
10           org_id,
11           created_at AS org_created_at
12       FROM galaxy.prod_orgs_created
13   ) AS org_table
14   JOIN (
15       SELECT
16           org_id,
17           created_at AS service_created_at
18       FROM galaxy.prod_services_created
19   ) AS service_table ON org_table.org_id = service_table.org_id
20)
21
22SELECT
23   month,
24   COUNT(DISTINCT org_id) AS orgs_per_month,
25   AVG(time_difference_seconds) / 86400 AS average_time_difference_days,
26   quantileExact(0.25)(time_difference_seconds) / 60 AS lower_quartile_minutes,
27   quantileExact(0.5)(time_difference_seconds) / 60 AS median_time_difference_minutes,
28   quantileExact(0.75)(time_difference_seconds) / 60 AS upper_quartile_minutes,
29   MIN(time_difference_seconds) / 60 AS min_time_difference_minutes,
30   MAX(time_difference_seconds) / 86400 AS max_time_difference_days,
31   COUNTIf(time_difference_seconds > 86400) AS count_greater_than_one_day,
32   COUNTIf(time_difference_seconds > 604800) AS count_greater_than_one_week,
33   COUNTIf(time_difference_seconds > 2419200) AS count_greater_than_one_month
34FROM TimeDifferences
35GROUP BY month
36ORDER BY month;
User paths #
Tracking user paths through the product requires examining sequences of events. For this, window functions are essential. Our example below analyzes user activity over the past 14 days to understand their progress through onboarding and instance creation workflows. Specifically, it aims to identify the common behavior of users who skip a specific step in the product - onboarding in this case.
To do this, it calculates the earliest time (signup_time) when each user created their account, determined by the first occurrence of the event 'user-created'. The query also uses a windowFunnel function with a 7-day time window to measure how far users progressed through a predefined series of onboarding actions. These steps include account creation, organization setup, navigating to an onboarding page, submitting a form to create a new service, and creating an instance.
Additionally, the query tracks the number of times users chose to skip onboarding (skipOnboardingClick) and counts the number of instance creation events (CREATE_INSTANCE or createdInstance). Finally, it groups the results by user_id and filters the output to include only users who made progress through the onboarding funnel (indicated by a level greater than 0) and who skipped onboarding at least once.
  1SELECT
2    user_id,
3    minIf(created_at, event = 'user-created') AS signup_time,
4    windowFunnel(6048000000000000)(created_at, event = 'user-created',
5      event = 'org-created', (event = 'signin') AND
6      (path(JSON_VALUE(payload, '$."properties"."page"')) = '/onboard'),
7      (component = 'createNewService') AND (event = 'submitButtonClick'),
8      ((component = 'AuditRecordUtils') AND (event = 'CREATE_INSTANCE'))
9      OR (event = 'createdInstance')) AS level,
10    countIf((component = 'onboardingLayout')
11      AND (event = 'skipOnboardingClick')) AS skipped_onboarding,
12    countIf(((component = 'AuditRecordUtils')
13      AND (event = 'CREATE_INSTANCE')) OR (event = 'createdInstance')) AS created_instance_check
14FROM galaxy.prod_forensics
15WHERE created_at >= (now() - toIntervalDay(14))
16GROUP BY user_id
17HAVING (level > 0) AND (skipped_onboarding > 0)
Retention & Churn #
Acquiring customers represents only the first step in any successful business - retaining them is equally essential. We can measure this retention through churn, where a "churned" customer is one who has not been retained. Measuring churn involves computing the percentage of users who stop or reduce a specific action during a time period where this action represents successful retention. Once churned users can be identified (or, better, those at risk of churning), we can correlate this with other statistics and identify issues in the product - potentially using other tools such as session replays.
In our case, we measure churn as a customer's spend was above a threshold X in one month but fell below Y (can be the same as X) the following month. The value of X and Y here depends on usage profiles and can be adapted to looking at different customer sizes.
This analysis is an example of one that requires an external dataset - specifically our billing data. This table is available in our warehouse as dbt_marts_general.usage_history and is periodically synced from M3ter. We use this table below with conditionals to compute customer spend for the current and previous months.
  1WITH 100 as previous_spend, 100 as new_spend
2SELECT organization__id AS organization__id,
3      max(organization__created_at) AS "Organization Created At",
4      argMax(organization__billing_model, timestamp_hour) AS "Current Billing Model",
5      argMax(organization__marketplace_name, timestamp_hour) AS "Marketplace",
6      argMax(organization__email_domain, timestamp_hour) AS "Email Domain",
7      argMax(account__name, timestamp_hour) AS "Account",
8      argMax(organization__owner_name, timestamp_hour) AS "Owner",
9      sumIf(organization__dollar_usage, toStartOfMonth(timestamp_hour) = toStartOfMonth(now('UTC') - INTERVAL 2 MONTH)) AS "2 Months Ago - MRR",
10      sumIf(organization__dollar_usage, toStartOfMonth(timestamp_hour) = toStartOfMonth(now('UTC') - INTERVAL 1 MONTH)) AS "Last Month - MRR"
11FROM dbt_marts_general.usage_history
12WHERE timestamp_hour >= toDateTime('2023-01-01 00:00:00')
13 AND timestamp_hour < toDateTime('2024-11-28 13:00:00')
14 AND (organization__email_domain NOT IN ('clickhouse.com', 'clickhouse.cloud', 'clickhouse.com_deleted'))
15GROUP BY organization__id
16HAVING ("2 Months Ago - MRR" > previous_spend AND "Last Month - MRR" < new_spend) AND ("Current Billing Model" = 'PAYG' OR "Current Billing Model" = 'Other')
17ORDER BY "2 Months Ago - MRR" DESC
Relating to top of funnel activities #
The above analytics focus on in-product analytics. As mentioned above, like many companies we aim to correlate product behaviour with top of funnel activities performed prior to usage of the service. For this we need to correlate product accounts (organizations in our case) with website traffic.
For ClickHouse, the latter dataset is represented by google analytics which we periodically sync to our warehouse. On signing up to ClickHouse Cloud, a user's google analytics id is passed (via the URL). This id is consumed by the client library for galaxy and included in event payloads. This allows us to in turn analyze the historical and future use of content by an organization signed up to ClickHouse Cloud. Extracting the Google Analytics id for each account requires us to process the payload:
  1SELECT
2    created_at AS signup_date,
3    replaceOne(JSONExtractString(payload, 'data', 'tracker', 'utm_ga'), 'GA1.1.', '') AS ga
4FROM galaxy.prod_forensics
5WHERE namespace = 'signup'
6ORDER BY created_at DESC
With this list of google analytics ids we can answer questions such as "what content do people read before creating an account?"
  1WITH gas AS
2	(
3    	SELECT replaceOne(JSONExtractString(JSONExtractRaw(JSONExtractRaw(payload, 'data'), 'tracker'), 'utm_ga'), 'GA1.1.', '') AS ga
4    	FROM raw_galaxy.prod_forensics
5    	WHERE (namespace = 'signup') AND (ga != '')
6    	ORDER BY created_at DESC
7	)
8SELECT
9	title,
10	uniq(user_pseudo_id) AS users,
11	countIf(event_name = 'page_view') AS views
12FROM dbt_marts_google_analytics.events_daily
13WHERE (user_pseudo_id IN (gas)) AND (title != '')
14GROUP BY title
15ORDER BY users DESC
16LIMIT 10
A/B testing with GrowthBook #
SaaS businesses look to optimize activation and conversion ratios. This invariably requires some experimentation with product onboarding and usage flows, with a need to measure the effects of changes to key metrics. Performing this methodically requires an A/B testing framework, where different users are exposed to different variations of a feature or flow, and their behavior is measured to assess the impact of each on key metrics. At ClickHouse, we use GrowthBook, an open-source experimentation platform, to manage and analyze these experiments. GrowthBook aligns with our preference for open-source tools, offering the flexibility to integrate seamlessly with our existing analytics stack while maintaining transparency and control over our experimentation framework.
In our implementation, each experiment and the specific variation a user is exposed to are captured within the payload field of an event. This allows us to track and analyze user behavior at a granular level, linking experiment data directly with key performance indicators such as activation and conversion.
For example, we identify organizations that have participated in a specific experiment and the variation they were exposed to with simple filters. Previous analysis can then be performed on these organizations.
  1SELECT
2   f.org_id,
3   f.user_id AS user_id,
4   JSONExtractString(f.payload, 'experimentId') AS experiment_id,
5   JSONExtractString(f.payload, 'variationId') AS variation_id
6FROM
7   galaxy.prod_forensics f
8WHERE
9   f.namespace LIKE '%growth%'
10   AND JSONExtractString(f.payload, 'experimentId') = 'pricing-service-creation';
Using a simpler view #
As you can see from our earlier queries, the majority of our product analytics typically focuses on a subset of less than 50 columns. We have shown some examples of using sources beyond our product analytics, joining against billing and google analytics data. For even more complex analysis, we use up to another 10 tables or materialized views from our warehouse. To streamline analysis, we create a unified, usable view of the data.
This growth view, which is effectively a large LEFT JOIN, serves as the foundation for most analytical tasks, simplifying many of the above queries significantly and allowing less proficient users to answer questions through Superset visualizations. For example, the computing monthly statistics for acquisition, activation and conversion becomes a simple query:
  1SELECT
2   toStartOfMonth(organization__created_at) AS cohort_month,
3   count() AS total_organizations,
4   sum(organization__service_created) AS total_services_created,
5   sum(organization__data_added) AS total_data_added,
6   sum(organization__cc_added) AS total_cc_added
7FROM
8   dbt_marts_growth.growth
9WHERE
10   organization__created_at >= today() - interval 6 month
11GROUP BY
12   cohort_month
13ORDER BY
14   cohort_month ASC;
This view is materialized as a table and can be periodically rebuilt using either dbt (with an INSERT INTO SELECT) or a Refreshable Materialized View in ClickHouse.
Looking forward & conclusion #
This blog has walked through the process of building a product analytics solution using ClickHouse, touching on critical aspects like schema design, common queries, materialized views, and integrating additional datasets. We’ve shared insights from our own journey building Galaxy, our in-house analytics platform, which has enabled us to derive actionable insights from over 20 billion events.
Building your own product analytics stack offers unparalleled flexibility and control. It allows you to customize data collection, perform advanced analyses, and integrate seamlessly with your broader data ecosystem. However, this flexibility comes with the need for expertise in database management, data modeling, and SQL.
It’s also important to acknowledge that this blog provides only a snapshot of what’s possible. Product analytics is a vast domain with nuanced requirements that vary by organization. While we’ve shared examples of common queries and workflows, these are only starting points. Each use case may demand unique approaches, and deeper challenges like data governance, user attribution, and multi-touchpoint analysis often require tailored solutions.
For those who are willing to invest in building their own solution, the rewards can be immense—providing not only better insights but also a competitive edge. We hope this blog inspires you to explore ClickHouse for your product analytics needs and empowers you to design a system tailored to your business objectives.
