Introduction #
The pace of development at ClickHouse is often a pleasant surprise to newcomers with our launch week announcing a number of features which make using ClickHouse easier than ever. As someone who enjoys building analytical applications on top of ClickHouse, one of these new features, API endpoints, particularly caught my eye. On playing with the feature, I realized a lot of demo code could now be made significantly simpler while also speeding up the development of new features.
API endpoints, announced in beta, allow you to expose a secure HTTP endpoint which consumes parameters and uses this to populate and execute a predefined SQL query.
API endpoints do more than make an interface simpler - they add separation of concerns. As well as making it simpler to update an application query, without having to modify or redeploy the code, this allows teams to easily expose analytics without needing to write SQL or interact directly with a ClickHouse database owned by different teams.
To demonstrate this we update one of our demo applications, ClickPy, adding new GitHub analytics in a few minutes. We hope the learnings here can be applied to your own ClickHouse applications, making adding new features significantly easier.
To accompany this blog, we’ve included a small cookbook which includes the standalone code for the visualizations added in this blog.
What is ClickPy? #
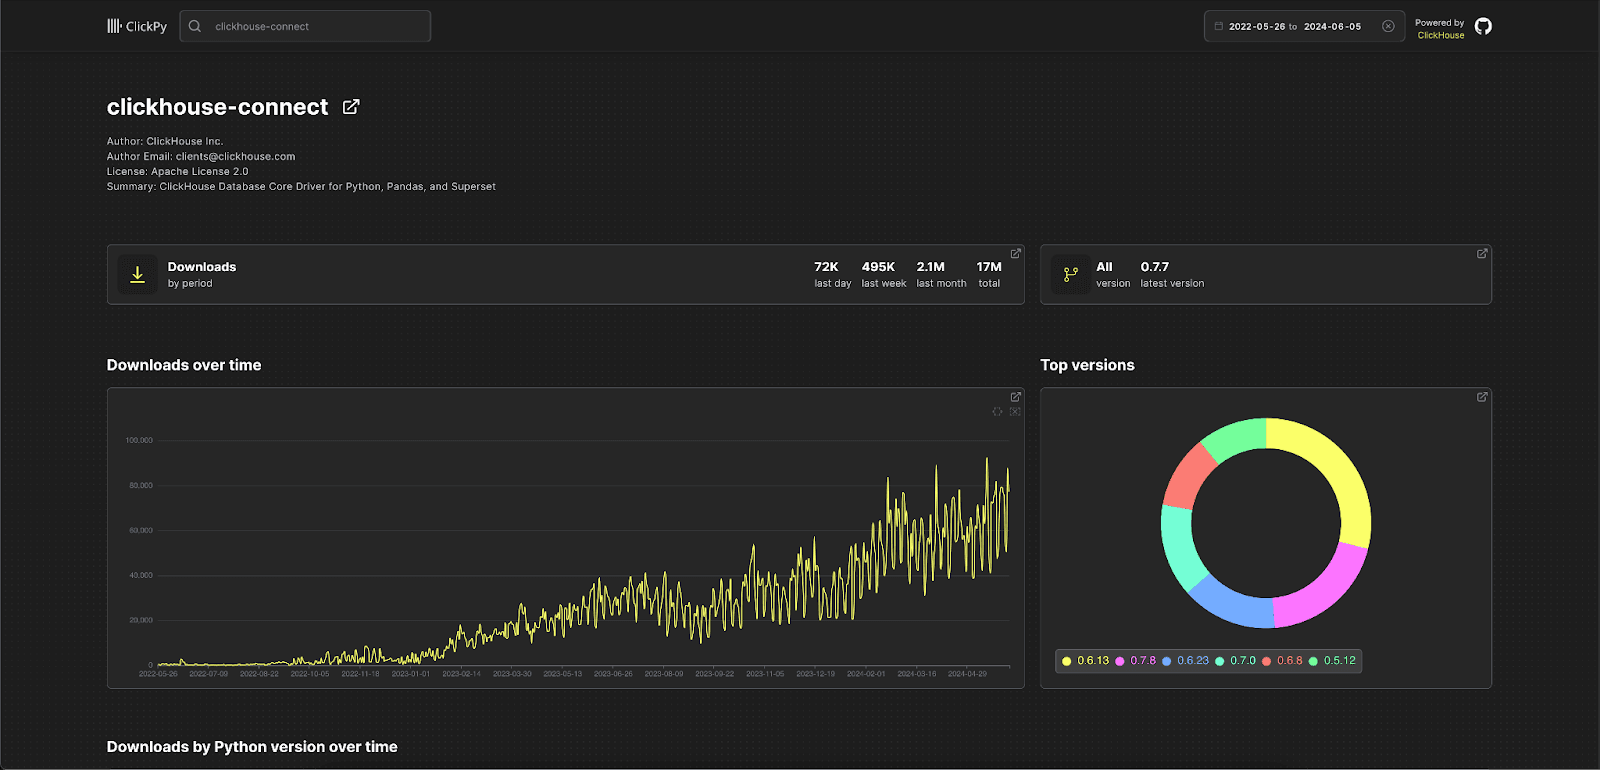
Earlier this year, we announced ClickPy - a simple real-time dashboard that allows users to view download statistics on Python packages. This app is powered by PyPI data, with a row for every Python package download that has ever occurred! Every time you run pip install, we get a row in ClickHouse!

This dataset is now over a trillion rows with around 1.2b rows added daily and is the perfect example of how big data analytics can be performed with ClickHouse.
The application itself is pretty simple based on React, NextJs and Apache ECharts. The secret sauce, as we document in the open-source repo, is the use of ClickHouse materialized views to compute aggregates at insert time thus ensuring queries respond in milliseconds and users get a snappy and responsive experience.
Adding a new dataset #
Many Python packages are open-source and thus often have their own GitHub repositories. The PyPi data captures this through thehomepage and project_urls columns in the projects table e.g. for clickhouse-connect, the official ClickHouse Python client, and the boto3 library.
SELECT
	name,
	argMax(home_page, upload_time) AS home_page,
	argMax(project_urls, upload_time) AS project_urls
FROM pypi.projects
WHERE name IN ('clickhouse-connect', 'boto3')
GROUP BY name
FORMAT Vertical

Row 1:
──────
name:     	boto3
home_page:	https://github.com/boto/boto3
project_urls: ['Documentation, https://boto3.amazonaws.com/v1/documentation/api/latest/index.html','Source, https://github.com/boto/boto3']

Row 2:
──────
name:     	clickhouse-connect
home_page:	https://github.com/ClickHouse/clickhouse-connect
project_urls: []

2 rows in set. Elapsed: 0.018 sec. Processed 27.48 thousand rows, 2.94 MB (1.57 million rows/s., 167.52 MB/s.)
Peak memory usage: 26.51 MiB.
One of the other popular datasets users often use to experiment with ClickHouse is GitHub events. This captures every star, issue, pull request, comment and fork event made on GitHub, with around 7.75 billion events as of June 2024. Provided by GitHub and updated hourly, this seemed like the perfect complement to our PyPi dataset.
CREATE TABLE github.github_events
(
	`file_time` DateTime,
	`event_type` Enum8('CommitCommentEvent' = 1, 'CreateEvent' = 2, 'DeleteEvent' = 3, 'ForkEvent' = 4, 'GollumEvent' = 5, 'IssueCommentEvent' = 6, 'IssuesEvent' = 7, 'MemberEvent' = 8, 'PublicEvent' = 9, 'PullRequestEvent' = 10, 'PullRequestReviewCommentEvent' = 11, 'PushEvent' = 12, 'ReleaseEvent' = 13, 'SponsorshipEvent' = 14, 'WatchEvent' = 15, 'GistEvent' = 16, 'FollowEvent' = 17, 'DownloadEvent' = 18, 'PullRequestReviewEvent' = 19, 'ForkApplyEvent' = 20, 'Event' = 21, 'TeamAddEvent' = 22),
	`actor_login` LowCardinality(String),
	`repo_name` LowCardinality(String),
	`repo_id` LowCardinality(String),
	`created_at` DateTime,
	`updated_at` DateTime,
	`action` Enum8('none' = 0, 'created' = 1, 'added' = 2, 'edited' = 3, 'deleted' = 4, 'opened' = 5, 'closed' = 6, 'reopened' = 7, 'assigned' = 8, 'unassigned' = 9, 'labeled' = 10, 'unlabeled' = 11, 'review_requested' = 12, 'review_request_removed' = 13, 'synchronize' = 14, 'started' = 15, 'published' = 16, 'update' = 17, 'create' = 18, 'fork' = 19, 'merged' = 20),
	`number` UInt32,
	… // columns omitted for brevity
)
ENGINE = MergeTree
ORDER BY (repo_id, event_type, created_at)
The full schema along with details on loading this dataset and some example queries, can be found here. We use a simple script executed hourly to load new events as they are published by GitHub. Our script differs from the documented instructions in that it also extracts a repo.id, required for statistics we wish to compute. Our schema also modifies the ORDER BY key with a repo_name specified first, since ClickPy enforces this as a filter.
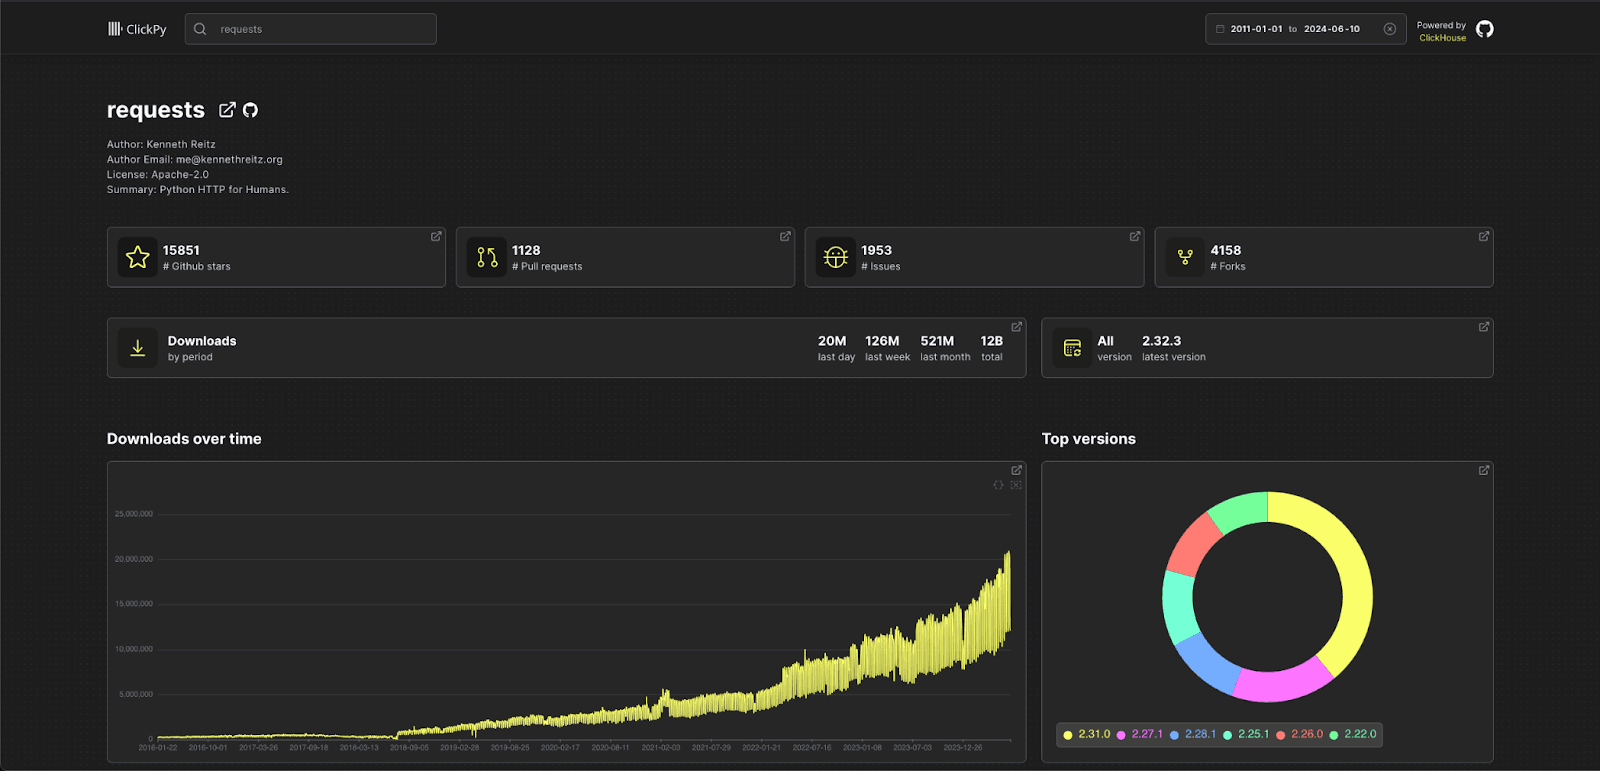
The objective here was pretty simple: add some simple metrics to our main ClickPy analytics page if the package the user was viewing was hosted on GitHub. More specifically, the number of stars, watches, issues and PRs.

For now we keep this simple. We plan to enrich ClickPy further with this data and add more engaging visuals. Stay-tuned.
A cleaner approach #
Previously every visual in ClickPy was powered by a SQL query. Most visuals have a function similar to the following:
export async function getDownloadsOverTime({package_name, version, period, min_date, max_date, country_code, type}) {
	const columns = ['project', 'date']
	if (version) {  columns.push('version') }
	if (country_code) { columns.push('country_code') }
	if (type) { columns.push('type')}
	const table = findOptimalTable(columns)
	return query('getDownloadsOverTime',
       `SELECT
    	  toStartOf${period}(date)::Date32 AS x,
    	  sum(count) AS y
	FROM ${PYPI_DATABASE}.${table}
	WHERE (date >= {min_date:String}::Date32) AND (date < {max_date:String}::Date32) AND (project = {package_name:String})
	AND ${version ? `version={version:String}`: '1=1'} AND ${country_code ? `country_code={country_code:String}`: '1=1'} AND ${type ? `type={type:String}`: '1=1'} GROUP BY x
	ORDER BY x ASC`,
       {
    	  package_name: package_name,
    	  version: version,
    	  min_date: min_date,
    	  max_date: max_date,
    	  country_code: country_code,
    	  type: type,
	})
}
The above powers the downloads per day line chart and is executed server side. This seems a little messy and results in a large query file to maintain.
Ideally this would just be a simple HTTP call with only the parameters, with a separate API layer maintaining all this SQL logic.
Enter API endpoints #
In ClickHouse Cloud any SQL query can be converted into an API endpoint in a few simple clicks, with SQL parameters automatically detected and converted to POST parameters.
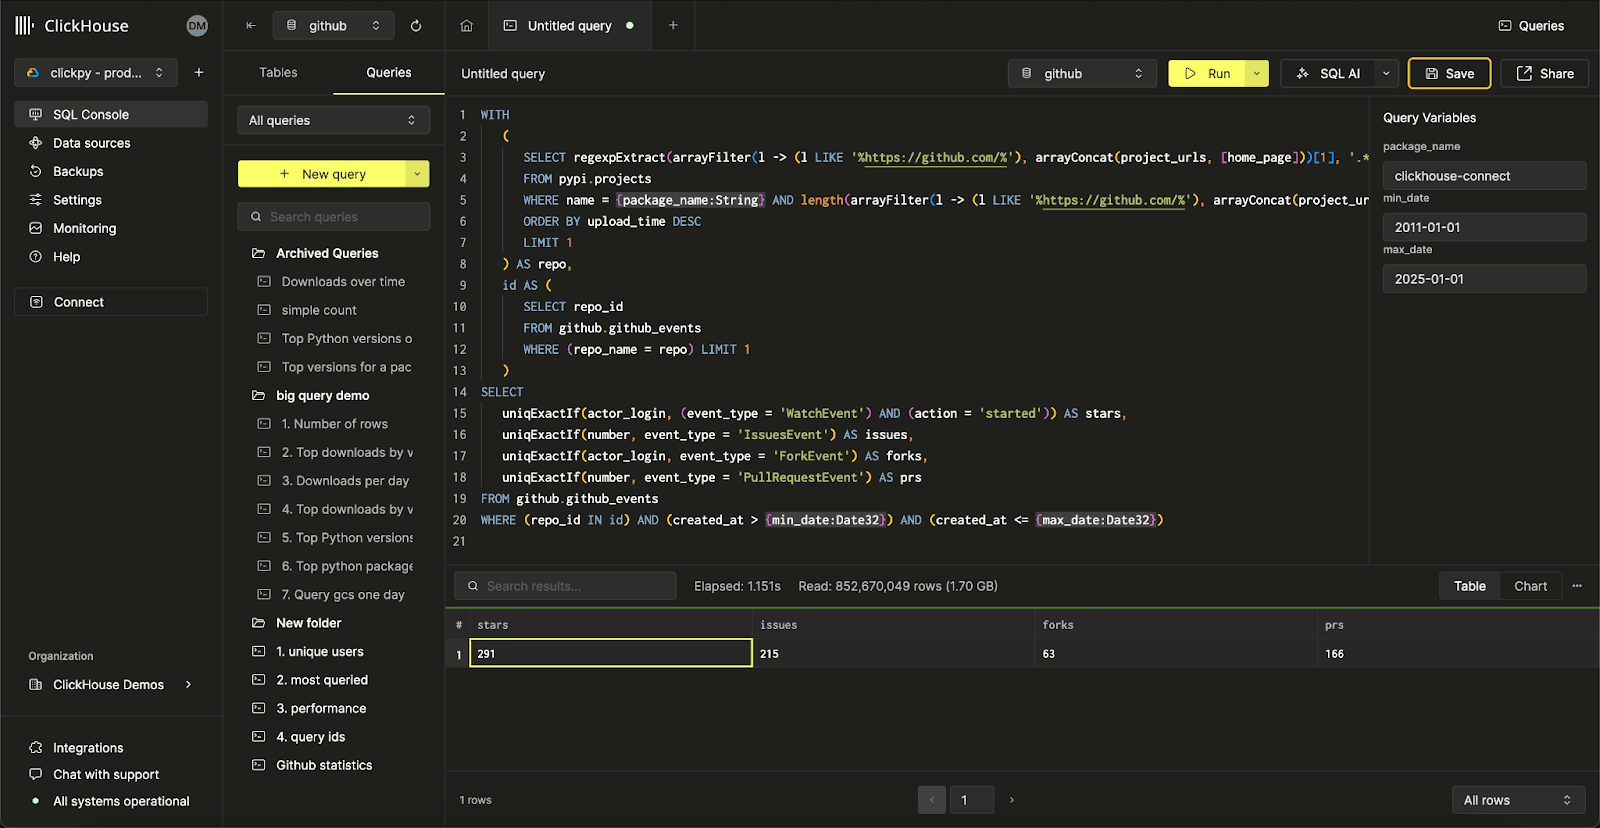
Let's assume we encapsulate all of our statistics in a single endpoint. The query to compute the number of stars, issues, watches and PRs:
SET param_min_date = '2011-01-01'
SET param_max_date = '2024-06-06'
SET param_project_name = 'clickhouse-connect'

WITH
   (
    	SELECT regexpExtract(arrayFilter(l -> (l LIKE '%https://github.com/%'), arrayConcat(project_urls, [home_page]))[1], '.*https://github.com/(.*)')
    	FROM pypi.projects
    	WHERE name = {package_name:String} AND length(arrayFilter(l -> (l LIKE '%https://github.com/%'), arrayConcat(project_urls, [home_page]))) >= 1
    	ORDER BY upload_time DESC
    	LIMIT 1
   ) AS repo,
   id AS (
   	SELECT repo_id
   	FROM github.github_events
   	WHERE (repo_name = repo) LIMIT 1
   )
SELECT
   uniqExactIf(actor_login, (event_type = 'WatchEvent') AND (action = 'started')) AS stars,
   uniqExactIf(number, event_type = 'IssuesEvent') AS issues,
   uniqExactIf(actor_login, event_type = 'ForkEvent') AS forks,
   uniqExactIf(number, event_type = 'PullRequestEvent') AS prs
FROM github.github_events
WHERE (repo_id IN id) AND (created_at > {min_date:Date32}) AND (created_at <= {max_date:Date32})
The above accepts 3 parameters which map to UI filters: The repo name of interest as a string as well as the min and max date range. The first CTE identifies whether the homepage or project_urls has a link with prefix https://github.com and thus whether the project has an associated GitHub repository. Using the GitHub project path a repository name is constructed and used to identify the repository id.
The use of repository id is important for subsequent queries as repository names can change. Our stats are computed from the main table github.github_events, using conditionals
In ClickHouse Cloud, these parameters are automatically detected and exposed as text boxes the user can populate:

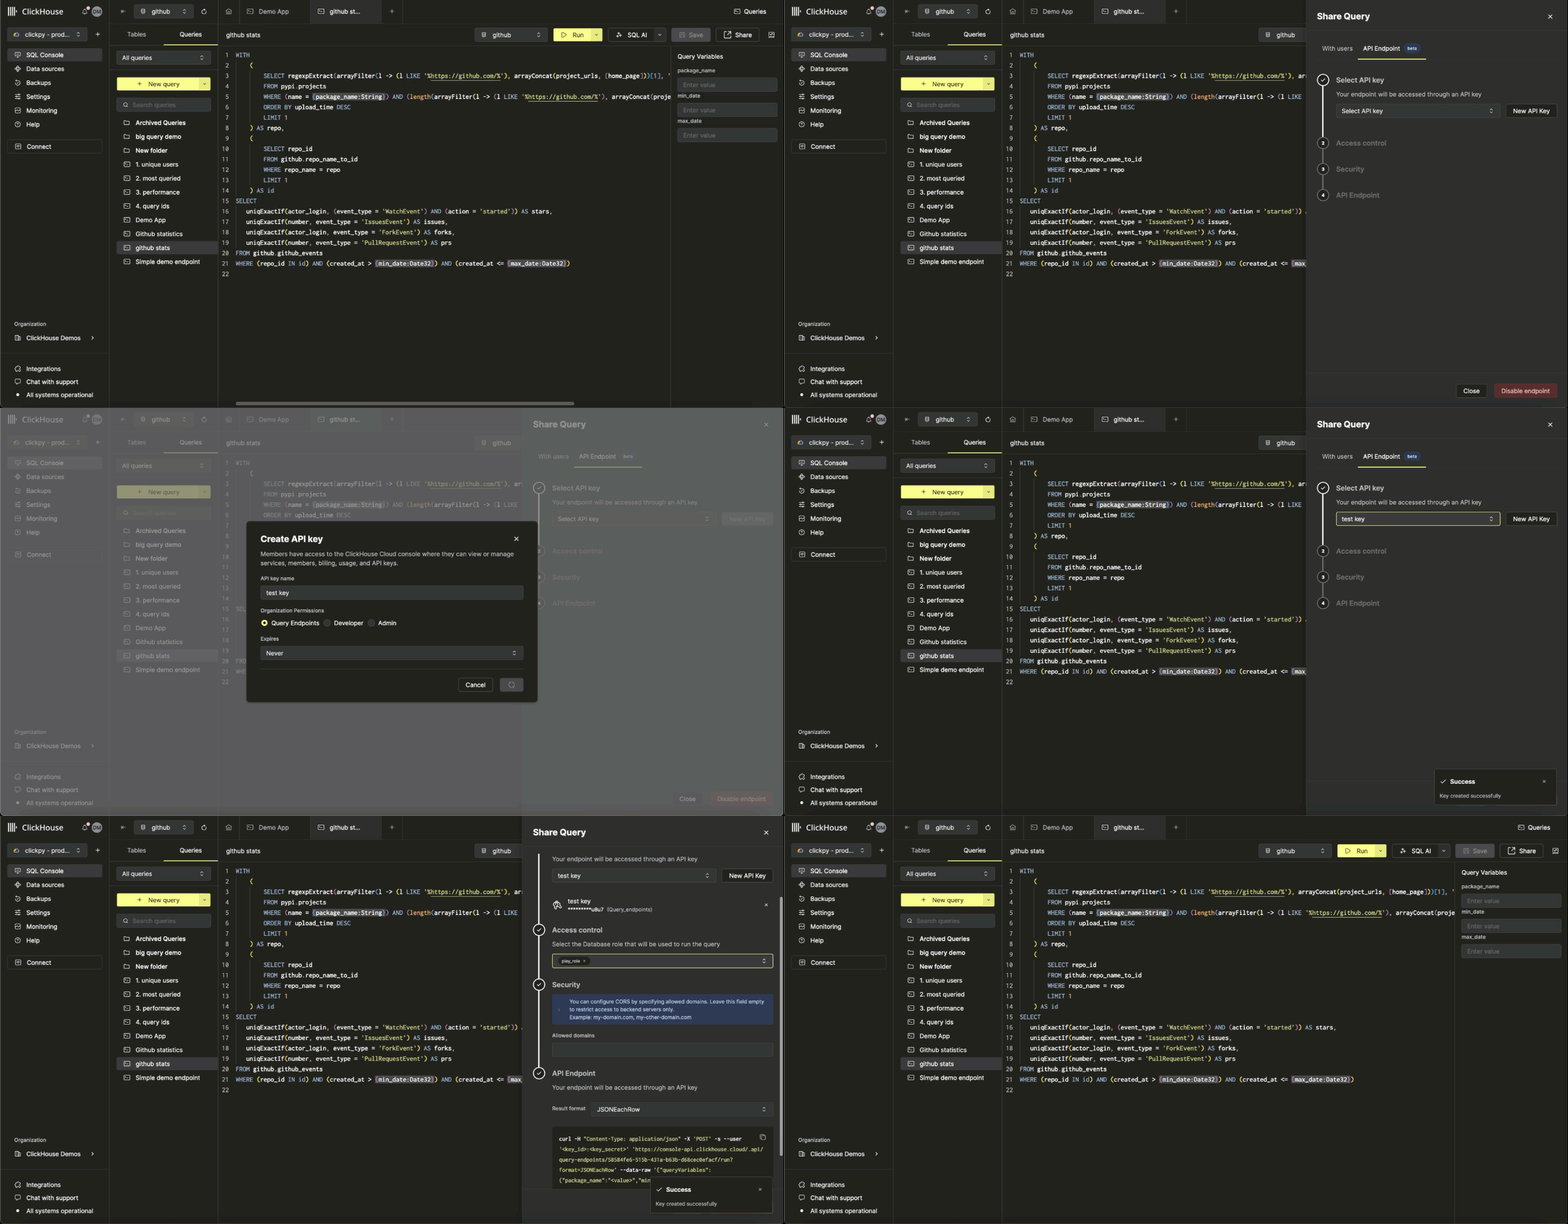
To convert this query into an endpoint, we simply need to click Share -> API Endpoint, saving the query with a name and creating an API token to use with "Query Endpoints" permissions. Ensure the endpoint is uses a read-only only:
Note how we associate the "Play role" with the endpoint. This is a role that ensures this endpoint can only be used to respond to queries on the required tables, as well as imposing quotas that are keyed off IP addresses, thus limiting the number of requests a single user can make. For users wishing to invoke endpoints from browsers, CORS headers can also be configured with a list of allowed domains. A default "Read only" role provides a simpler getting started.
This provides us with a HTTP endpoint we can now execute using curl, with the response returned in JSON:
curl -H "Content-Type: application/json" -X 'POST' -s --user '<key_id>:<key_secret>' 'https://console-api.clickhouse.cloud/.api/query-endpoints/9001b12a-88d0-4b14-acc3-37cc28d7e5f4/run?format=JSONEachRow' --data-raw '{"queryVariables":{"project_name":"boto3","min_date":"2011-01-01","max_date":"2024-06-06"}}'

{"stars":"47739","issues":"3009","forks":"11550","prs":"1657"}
An astute reader might notice we pass the url parameter "format":"JSONEachRow" to control the output format. Users can specify any of the over 70 output formats supported by ClickHouse here. For example, for CSVWithNames:
curl -H "Content-Type: application/json" -X 'POST' -s --user '<key_id>:<key_secret>' 'https://console-api.clickhouse.cloud/.api/query-endpoints/9001b12a-88d0-4b14-acc3-37cc28d7e5f4/run?format=CSVWithNames' --data-raw '{"queryVariables":{"project_name":"boto3","min_date":"2011-01-01","max_date":"2024-06-06"}}'

"stars","issues","forks","prs"
47739,3009,11550,1657
Putting it together #
The above leaves us with just needing to build our visuals and integrate the API endpoint above.
The React code for components is pretty simple with the most relevant snippets below. More curious readers can find the code here.
// main panel containing stats
export default async function GithubStats({ repo_name, min_date, max_date }) {
  const stats = await getGithubStats(repo_name, min_date, max_date);
  return stats.length > 0 ? (
   <div className="flex h-full gap-4 flex-row flex-wrap xl:flex-nowrap">
    <div className="flex gap-4 w-full sm:flex-row flex-col">
      <SimpleStat value={stats[0]} subtitle={"# Github stars"} logo={"/stars.svg"} />
      <SimpleStat value={stats[1]} subtitle={"# Pull requests"} logo={"/prs.svg"} />
    </div>
    <div className="flex gap-4 w-full sm:flex-row flex-col">
      <SimpleStat value={stats[2]} subtitle={"# Issues"} logo={"/issues.svg"}/>
      <SimpleStat value={stats[3]} subtitle={"# Forks"} logo={"/fork.svg"} />
    </div>
   </div>
  ) : null;
}

// a single state component
export default function SimpleStat({ value, subtitle, logo }) {
 return (
   <div className="min-w-[250px] rounded-lg bg-slate-850 flex gap-4 p-4 h-24  w-full min-w-72 border border-slate-700">
     <div className="items-center flex grow">
       <Image
         width={16}
         height={16}
         className="h-16 w-16 min-w-16 min-h-16 bg-neutral-850 rounded-lg"
         src={logo}
         alt={subtitle}
      />
       <div className="ml-2 mr-4">
         <p className="text-xl mr-2 font-bold">{value}</p>
         <p className="text-slate-200">{subtitle}</p>
       </div>
     </div>
   </div>
 );
}
This code invokes the function getGithubStats which in turn invokes the generic function runAPIEndpoint function passing the endpoint and its parameters:
export async function runAPIEndpoint(endpoint, params) {
	const data = {
    	queryVariables: params,
    	format: 'JSONEachRow'
  	};
  	const response = await fetch(endpoint, {
    	method: 'POST',
    	headers: {
      	'Content-Type': 'application/json',
      	'Authorization': `Basic ${btoa(`${process.env.API_KEY_ID}:${process.env.API_KEY_SECRET}`)}`
    	},
    	body: JSON.stringify(data)
  	})
  	return response.json()
}

export async function getGithubStats(package_name, min_date, max_date) {
	return runAPIEndpoint(process.env.GITHUB_STATS_API, {
    	  package_name: package_name,
    	  min_date: min_date,
    	  max_date: max_date
	})
}
And we're done!

A complete example #
While the source code for ClickPy is available on Github, users may wish to experiment with a simpler example. For this we’ve prepared a trimmed down version of the application where users can enter a Python package and Github stats are rendered. To render a few details about the package, along with Github statistics, our query returns columns from the projects table:
SET param_package_name='boto3'

WITH
  (
        SELECT version
        FROM pypi.projects
        WHERE name = {package_name:String}
        ORDER BY arrayMap(x -> toUInt8OrDefault(x, 0), splitByChar('.', version)) DESC
        LIMIT 1
  ) AS max_version,
  project_details AS (
     SELECT
        name,
        max_version,
        summary,
        author,
        author_email,
        license,
        home_page,
        trim(TRAILING '/' FROM regexpExtract(arrayFilter(l -> (l LIKE '%https://github.com/%'), arrayConcat(project_urls, [home_page]))[1], '.*https://github.com/(.*)')) AS github
     FROM pypi.projects
     WHERE (name = {package_name:String})
     ORDER BY upload_time DESC
     LIMIT 1
  ),
  id AS (
      SELECT repo_id
      FROM github.repo_name_to_id
      WHERE repo_name IN (SELECT github FROM project_details) LIMIT 1
  ),
  stats AS (
     SELECT
        uniqExactIf(actor_login, (event_type = 'WatchEvent') AND (action = 'started')) AS stars,
        uniqExactIf(number, event_type = 'IssuesEvent') AS issues,
        uniqExactIf(actor_login, event_type = 'ForkEvent') AS forks,
        uniqExactIf(number, event_type = 'PullRequestEvent') AS prs
     FROM github.github_events_v2
     WHERE (repo_id IN id)
  )
 SELECT * FROM project_details, stats FORMAT Vertical

Row 1:
──────
name:     	requests
max_version:  2.32.3
summary:  	Python HTTP for Humans.
author:   	Kenneth Reitz
author_email: me@kennethreitz.org
license:  	Apache-2.0
home_page:	https://requests.readthedocs.io
github:   	psf/requests
stars:    	22032
issues:   	1733
forks:    	5150
prs:      	1026

1 row in set. Elapsed: 0.472 sec. Processed 195.71 million rows, 394.59 MB (414.49 million rows/s., 835.71 MB/s.)
Peak memory usage: 723.12 MiB.
This allows us to render some pretty simple statistics:

curl -H "Content-Type: application/json" -X 'POST' -s --user 'MdhWYPEpXaqiwGMjbXWT:4b1dKbabyQTvuKUWOnI08oXVbUD4tkaxKKjEwz7ORG' 'https://console-api.clickhouse.cloud/.api/query-endpoints/297797b1-c5b0-4741-9f5b-3d6456a9860d/run?format=JSONEachRow' --data-raw '{"queryVariables":{"package_name":"requests"}}'
The source code for this application can be found here.
Recommended usage #
The above examples execute the endpoint call on the server side to keep the example simple. While users can safely expose API credentials on the client side, this should be done with caution. Specifically:
- Ensure endpoints use an API token assigned “Query Endpoint” permissions to avoid leaking credentials with wider permissions (e.g., to create services) beyond those required.
- At a minimum, ensure the Read-only role is assigned. If using endpoints for internal projects this may be sufficient. For external projects, we recommend creating a dedicated role and ensuring that quotas are assigned as we did for our earlier example. These quotas can be keyed off IP, thus allowing administrators to limit the number of queries for a user per unit time - effectively creating rate limits. For example our public endpoint for the demo app uses the “endpoint_role” and following quota:
CREATE QUOTA endpoint_quota KEYED BY ip_address FOR INTERVAL 1 hour MAX queries = 100, result_rows = 1, read_rows = 3000000000000, execution_time = 6000 TO endpoint_role*
An example role with the full permissions can be found here.
- Configure the “Allowed Domains” for CORs when creating the endpoint, limiting this to the domain hosting your application.
Conclusion #
While we used an existing application to demonstrate endpoints, adding new functionality in a few minutes, users can use the same features to rapidly prototype and build their own applications. We have also provided a simple example for users to recreate the GitHub stats visual as an application.


