The ClickHouse monitoring dashboard
Previous videoReplicating Data From PostgreSQL to ClickHouse CloudNext videoThe many deployment modes of ClickHouse
Mark Needham, Product Marketing Engineer
Learn how to diagnose three common ClickHouse issues using the built-in monitoring dashboard. This tutorial covers how to detect small batch sizes, resource-intensive queries, and suboptimal primary key design using ClickHouse's advanced monitoring features.
You'll learn how to:
- Set up and access the monitoring dashboard
- Monitor batch insertions and part merging behavior
- Identify CPU-intensive query patterns
- Detect inefficient primary key designs through bytes-read metrics
Perfect for ClickHouse administrators and developers who want to improve their system monitoring skills. Includes practical examples using ClickHouse Cloud.
Recent videos
View all Videos
Open House, ClickHouse
How to build a great database (Alexey Milovidov)
The principles behind building a great database, and the new frontiers shaping the field.

ClickHouse, ClickHouse Cloud
How to build a unified data stack with Postgres and ClickHouse
ClickHouse
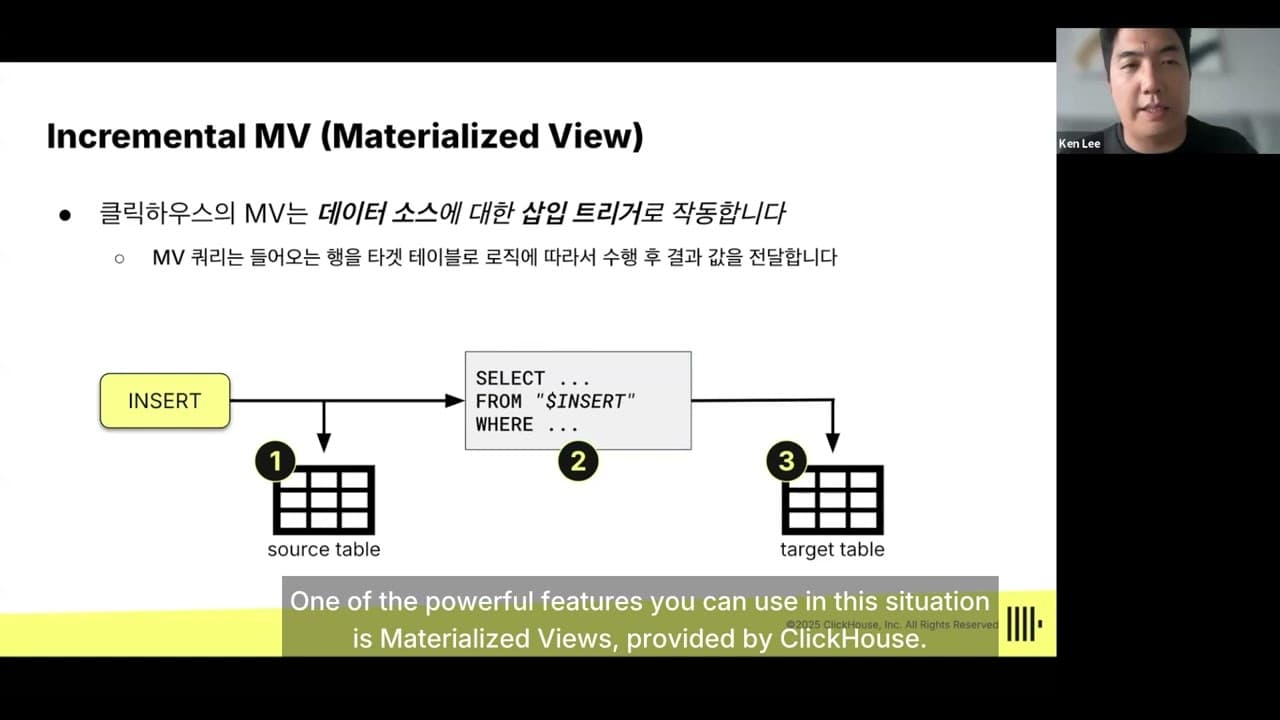
ClickPipes와 Materialized View로 구현하는 실시간 데이터 변환과 평탄화 기반 분석 실현
Ken Lee, Solution Architect, ClickHouse

ClickHouse Cloud, ClickHouse