There's a growing belief that AI-powered observability will soon reduce or even replace the role of Site Reliability Engineers (SREs). That's a bold claim---and at ClickHouse, we were curious to see how close we actually are.
For that we picked one particular task SRE does, among many other things, which is the Root cause analysis, and ran an experiment to see how good they are at doing this task on their own.
Keep on reading to learn how we set up and ran the experiment, and more importantly what we learnt from it.
TL;DR Autonomous RCA is not there yet. The promise of using LLMs to find production issues faster and at lower cost fell short in our evaluation, and even GPT-5 did not outperform the others.
Use LLMs to assist investigations, summarize findings, draft updates, and suggest next steps while engineers stay in control with a fast, searchable observability stack.
The experiment: LLM to handle RCA with naive prompt #
The experiment is straightforward. We gave a model access to observability data from a live application and, with a naive prompt, asked it to identify the root cause of a user-reported anomaly.
The contenders #
To run the experiment, first we needed contenders, so we picked five models. Some are well-known, others are less common but promising:
-
Claude Sonnet 4: Claude is known for its structured reasoning and detailed responses. It tends to be good at walking through steps logically, which could help when tracing complex issues across systems.
-
OpenAI GPT-o3: A more advanced model from OpenAI, built for speed and multimodal input. It balances performance with fast response times.
-
OpenAI GPT-4.1: Still strong when it comes to general reasoning and language understanding, but slower and not quite as sharp as GPT-o3. A good baseline for comparison.
-
Gemini 2.5 Pro: Google’s latest Pro model, integrated with their ecosystem. It does well with multi-step reasoning and has shown strong performance on code and troubleshooting tasks.
We didn’t test every model out there, first because it’s an impossible task, but rather the ones we had easy access to and that seemed viable for the task. The idea is not to crown a winner, but to see how they each handle the reality of real-world incident data.
The anomalies #
Then we need observability data from a live application that contains an issue. We chose to run the OpenTelemetry demo application to generate four datasets containing unique anomalies.
As you can see in the architecture diagram below, the OpenTelemetry demo application is fairly complex, contains a lot of different services, a frontend users can interact with and a load generator. In brief, it's a good representation of a real-world application. Also the demo application comes out of the box with pre-canned anomalies that can be turned on using feature flags.
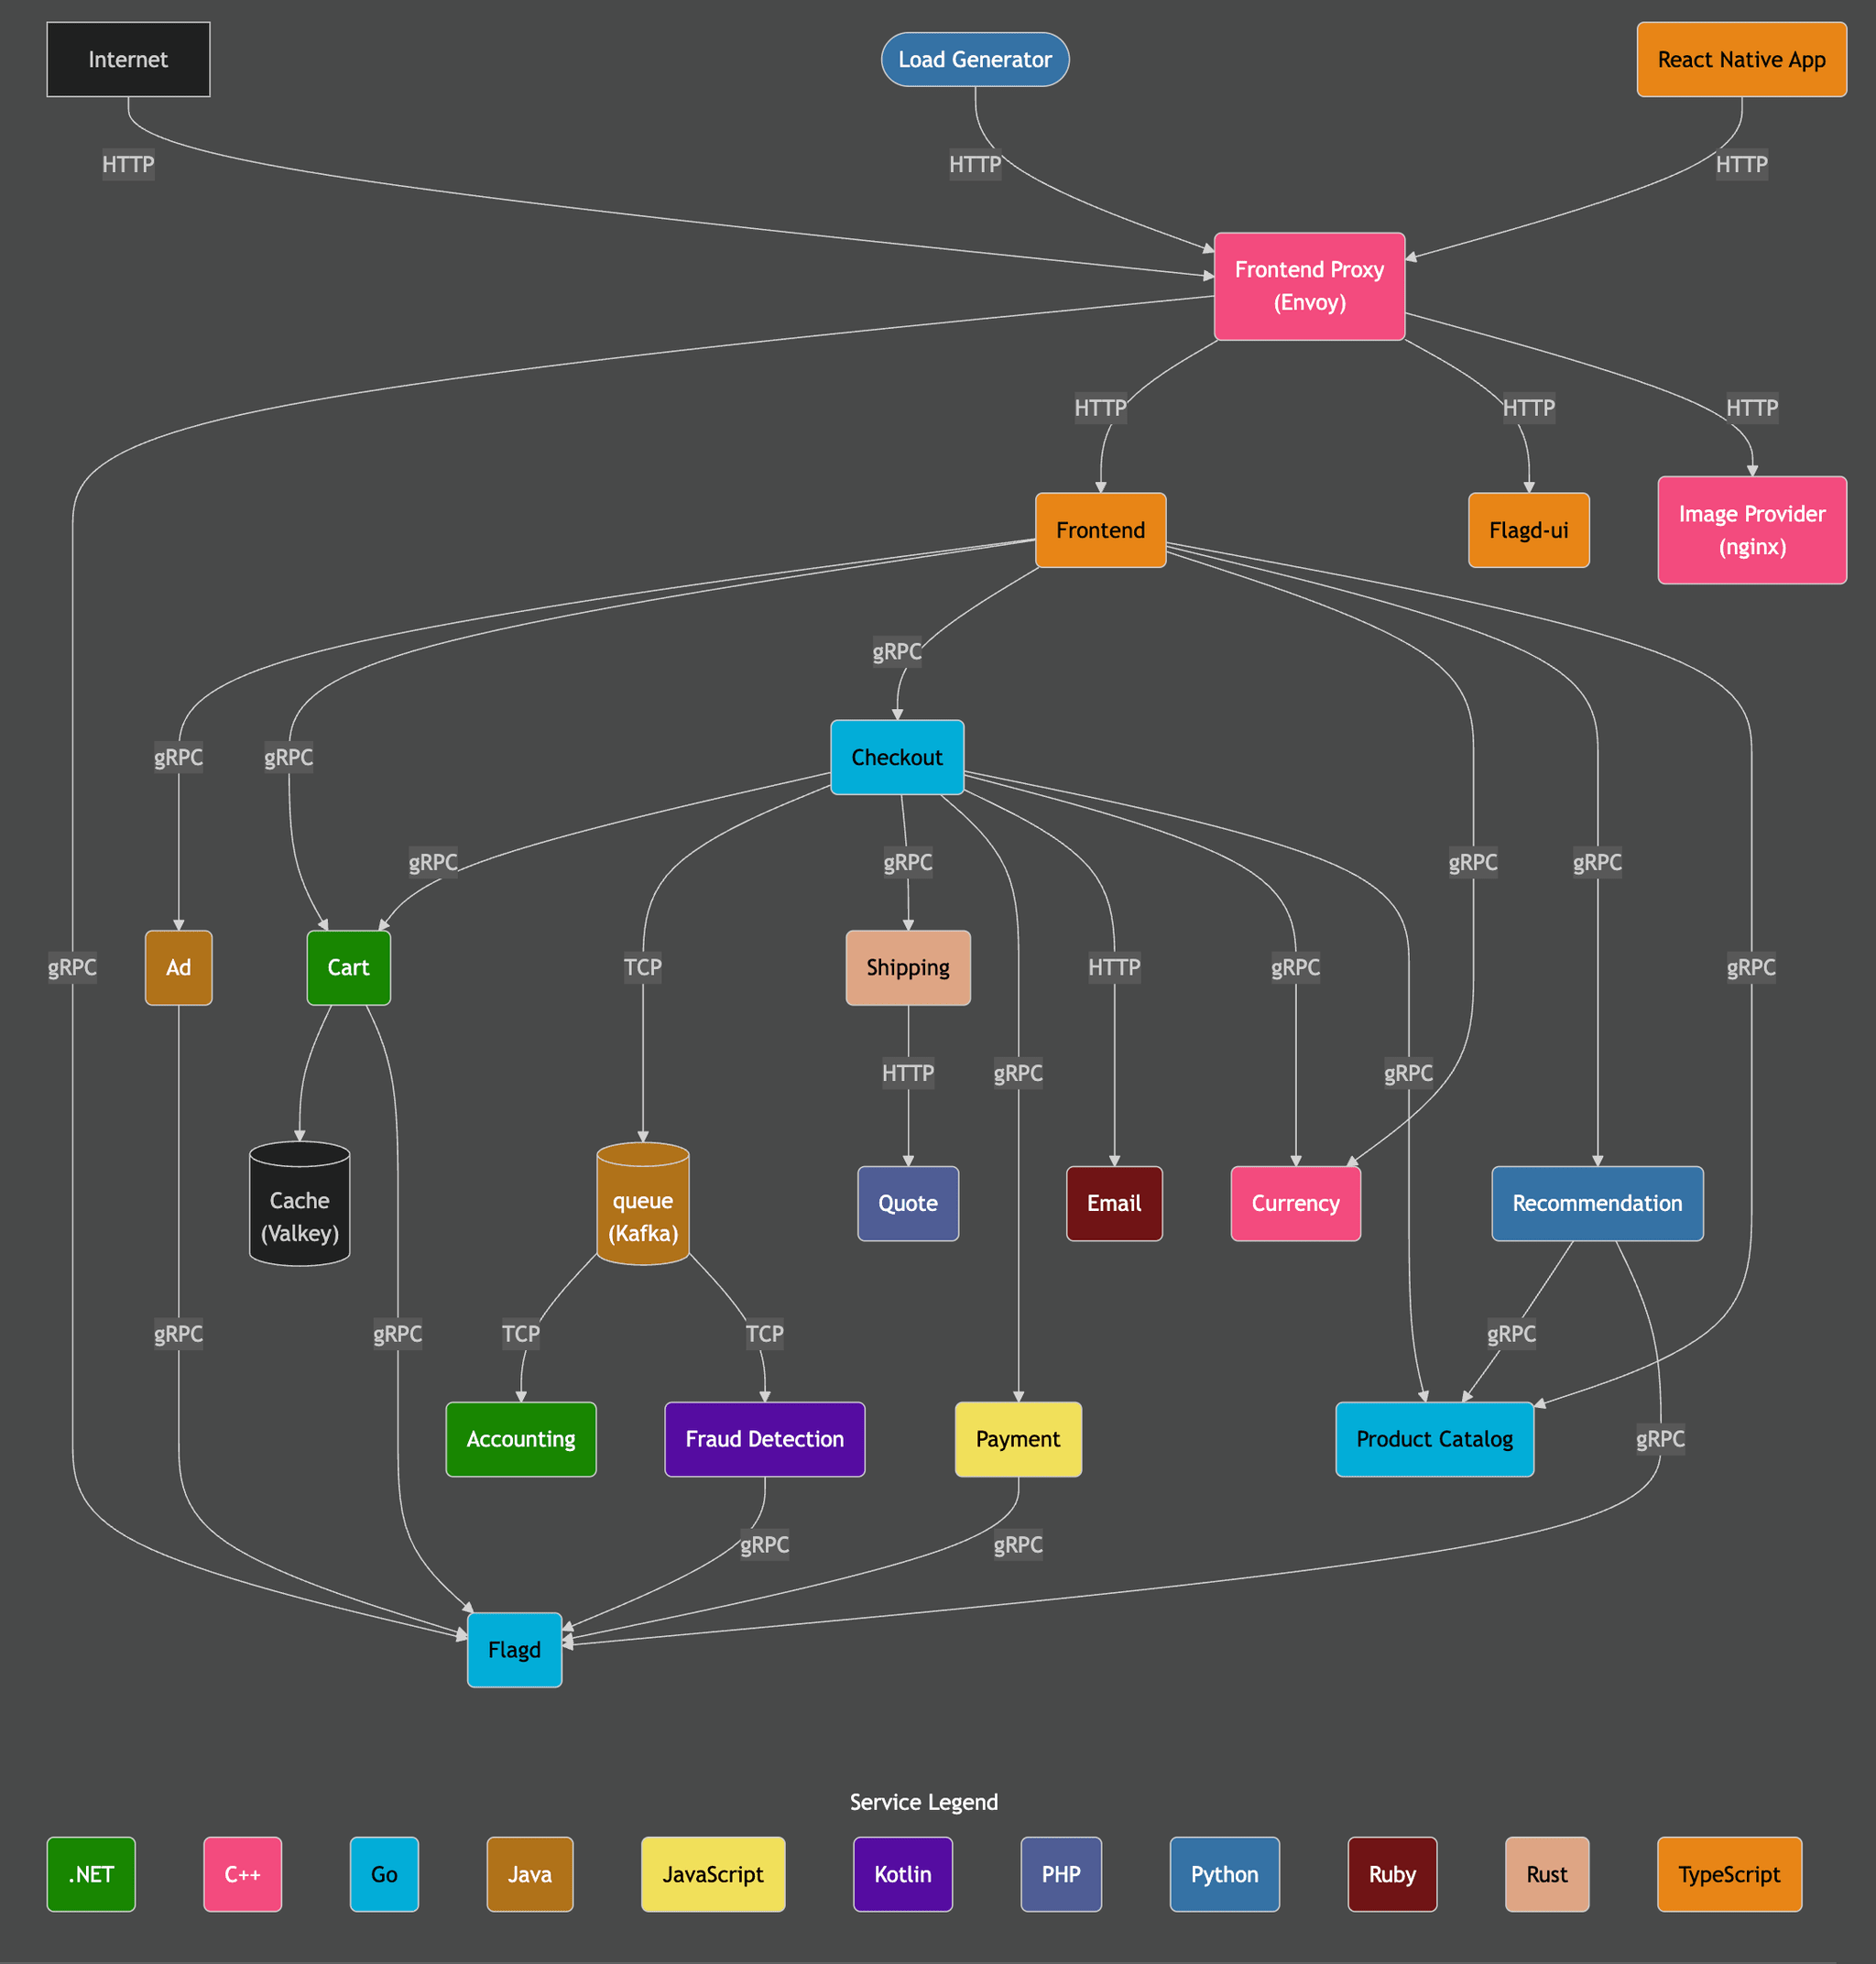
Using that application, we created three new datasets, each containing a distinct anomaly and data covering a 1 hour period. For the fourth test, we used our existing ClickStack public demo dataset which covers a 48 hour period.
The table below summarizes the four datasets we have and for each of them what feature flags were used.
| Name | Database | Duration | Feature flag | Description |
|---|---|---|---|---|
| Anomaly 1 | otel_anomaly_1 | 1h | paymentFailure | Generate an error when calling the charge method. This affects only users with loyalty status = gold. |
| Anomaly 2 | otel_anomaly_2 | 1h | recommendationCacheFailure | Create a memory leak due to an exponentially growing cache. 1.4x growth, 50% of requests trigger growth. |
| Anomaly 3 | otel_anomaly_3 | 1h | productCatalogFailure | Generate an error for GetProduct requests with product ID: OLJCESPC7Z |
| Demo anomaly | otel_v2 | 48h | paymentCacheLeak | Generate a memory leak in the payment cache service that slows down the application once the cache is full. |
To capture the datasets, we used the following methodology.
First, deploy the OpenTelemetry demo application and instrument it using ClickStack in Kubernetes. This repository contains instructions on how to do so.
Once the application runs and the telemetry data starts to flow into ClickHouse, we increase the load to 1000 users. After the number of users reaches the desired target, we turn the feature flag on and let it run for about 40 minutes. Finally, we turn off the feature flag and let it run for another 10 minutes. The whole dataset captured now contains about 1 hour's worth of data.
SELECT
    min(TimestampTime),
    max(TimestampTime)
FROM otel_anomaly_3.otel_logs
┌──min(TimestampTime)─┬──max(TimestampTime)─┐
│ 2025-07-22 08:25:40 │ 2025-07-22 09:36:01 │
└─────────────────────┴─────────────────────┘
Now we have our datasets captured, let’s investigate the issues using first a manual investigation then test the different models to see which one shines.
How we ran the experiment #
Manual investigation #
Before we ask the LLMs to find the problem, we need to know the actual root cause ourselves. That means doing a proper manual investigation for each anomaly, just like any SRE would. This gives us a baseline: if a model gets it right, we'll know. If it makes a mistake, or goes in the wrong direction, we'll be able to step in and guide it.
For this part, we use ClickStack, our observability stack built on top of ClickHouse.
We go through each issue manually, confirm what's wrong, and document the path we took. That becomes the reference point for comparing what the models do.
AI-powered investigation #
Then it's the models' turn.
We run each LLM through the same scenario using LibreChat connected to a ClickHouse MCP server. This lets the models query real observability data and try to figure things out on their own.
We instrument LibreChat and the ClickHouse MCP Server to track tokens usage. Since the telemetry data is stored in ClickHouse, we can run the following query to obtain the number of tokens used throughout an investigation.
SELECT
    LogAttributes['conversationId'] AS conversationId,
    sum(toUInt32OrZero(LogAttributes['completionTokens'])) AS completionTokens,
    sum(toUInt32OrZero(LogAttributes['tokenCount'])) AS tokenCount,
    sum(toUInt32OrZero(LogAttributes['promptTokens'])) AS promptTokens,
    anyIf(LogAttributes['text'], (LogAttributes['text']) != '') AS prompt,
    min(Timestamp) AS start_time,
    max(Timestamp) AS end_time
FROM otel_logs
WHERE conversationId =
GROUP BY conversationId
We start each test with the same naive prompt:
"You're an Observability agent and have access to OpenTelemetry data from a demo application. Users have reported issues using the application, can you identify what is the issue, the root cause and suggest potential solutions?"
If the model gets it right after the first prompt, great. If not, we ask follow up questions either based on the response it provided, or if it is completely off track, we provide additional context to help it get to a resolution.
Then for each anomaly, we report on:
- What the model finds
- How accurate it is
- How much guidance it requires
- How many tokens it uses getting there
- How long it takes to run the investigation
This gives us a sense of how efficient and reliable each model is when dropped into a real-world SRE task.
Experiment walkthrough #
In this section, we go through each anomaly and first document the manual investigation, then for each model we start with our simple prompt and document the model's finding. If the model is not successful at diagnosing the issue right away, we provide additional prompts to guide it.
Anomaly 1: Payment service failure #
Users are reporting issues during the checkout process, after filling in all the information related to the order, clicking on place order leads to an error.
Manual investigation #
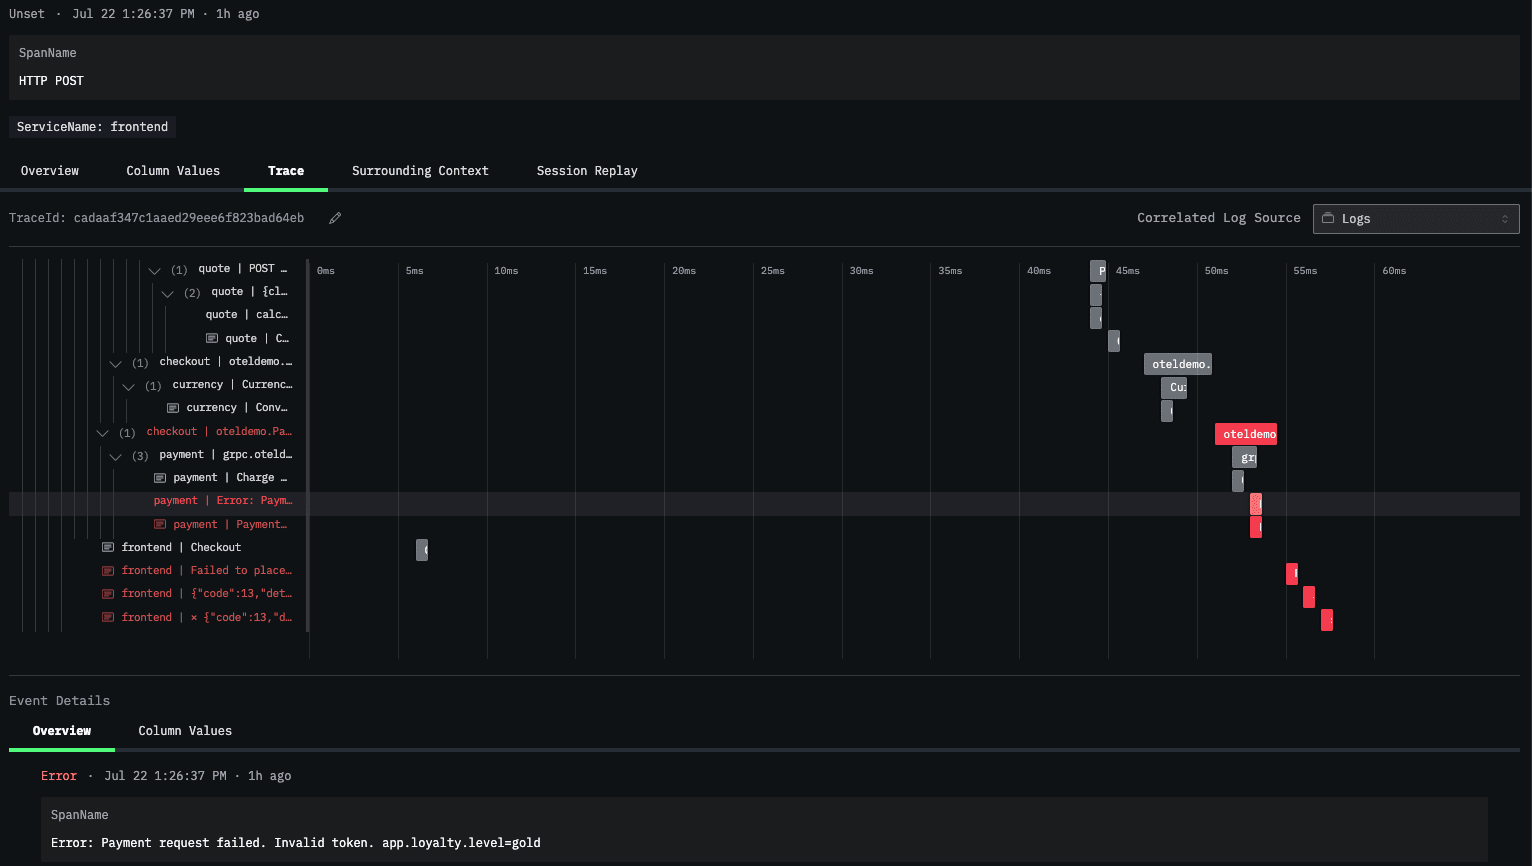
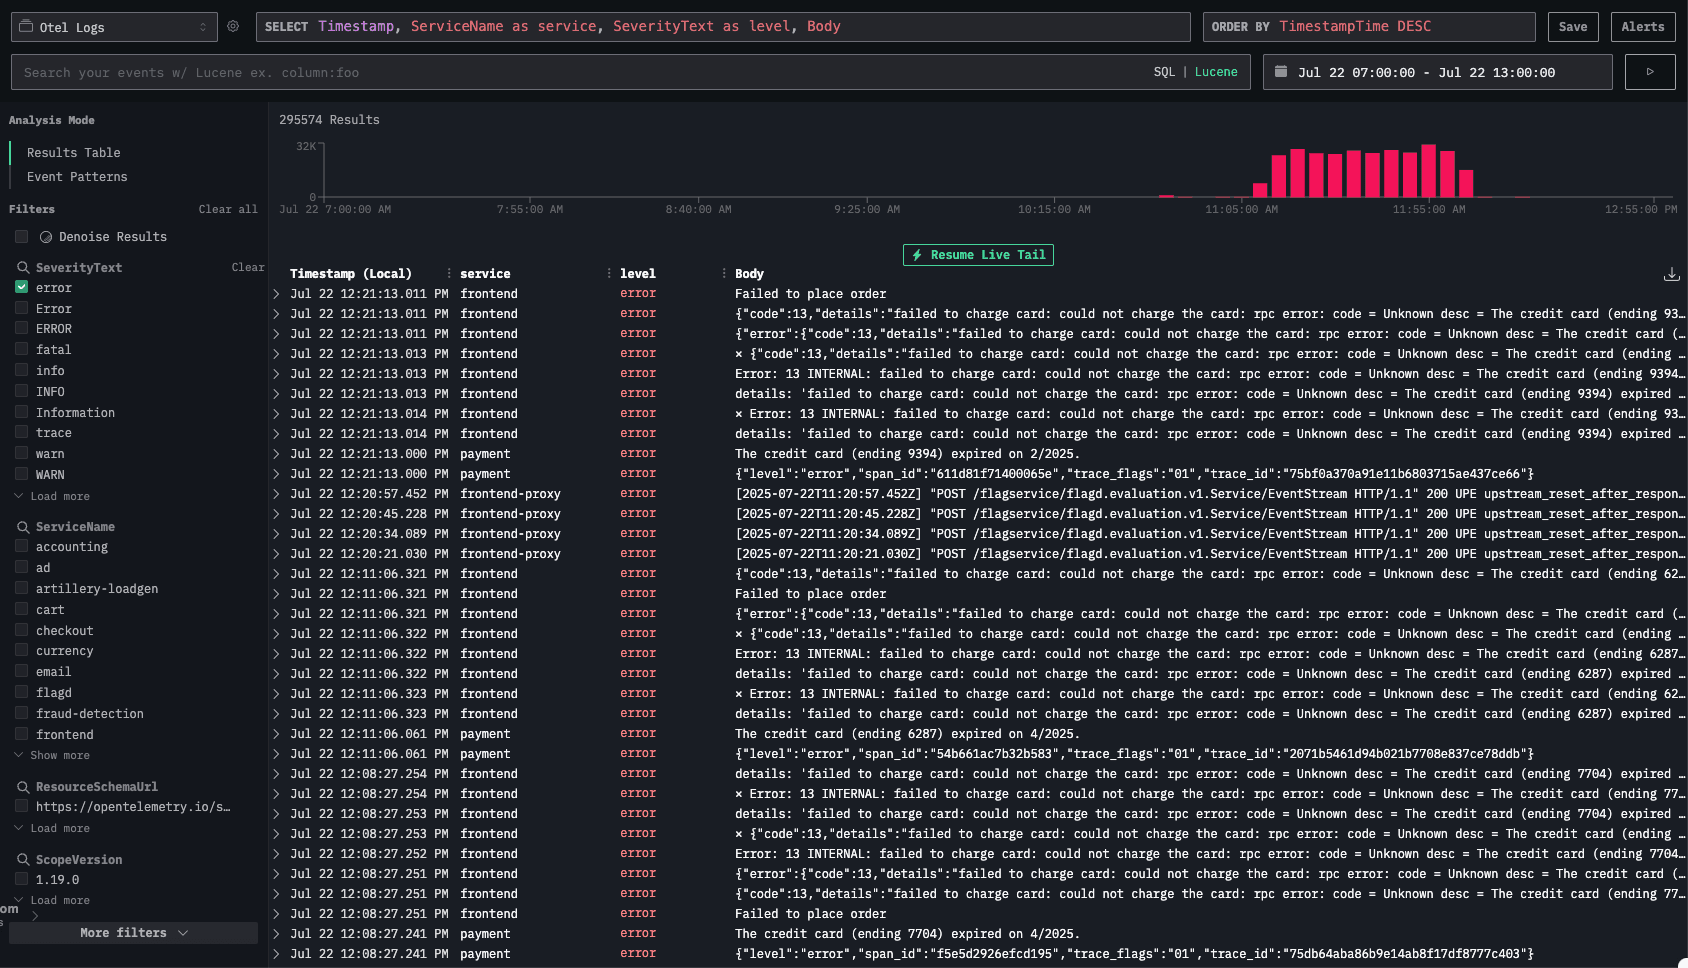
This is a simple issue to diagnose manually in ClickStack. We start by looking at one of the client sessions containing an error.

From that specific session, we look at the trace view, where we can see an error message on the payment service. The message indicates that there is an invalid token for the loyalty level gold, which causes the payment request to fail.
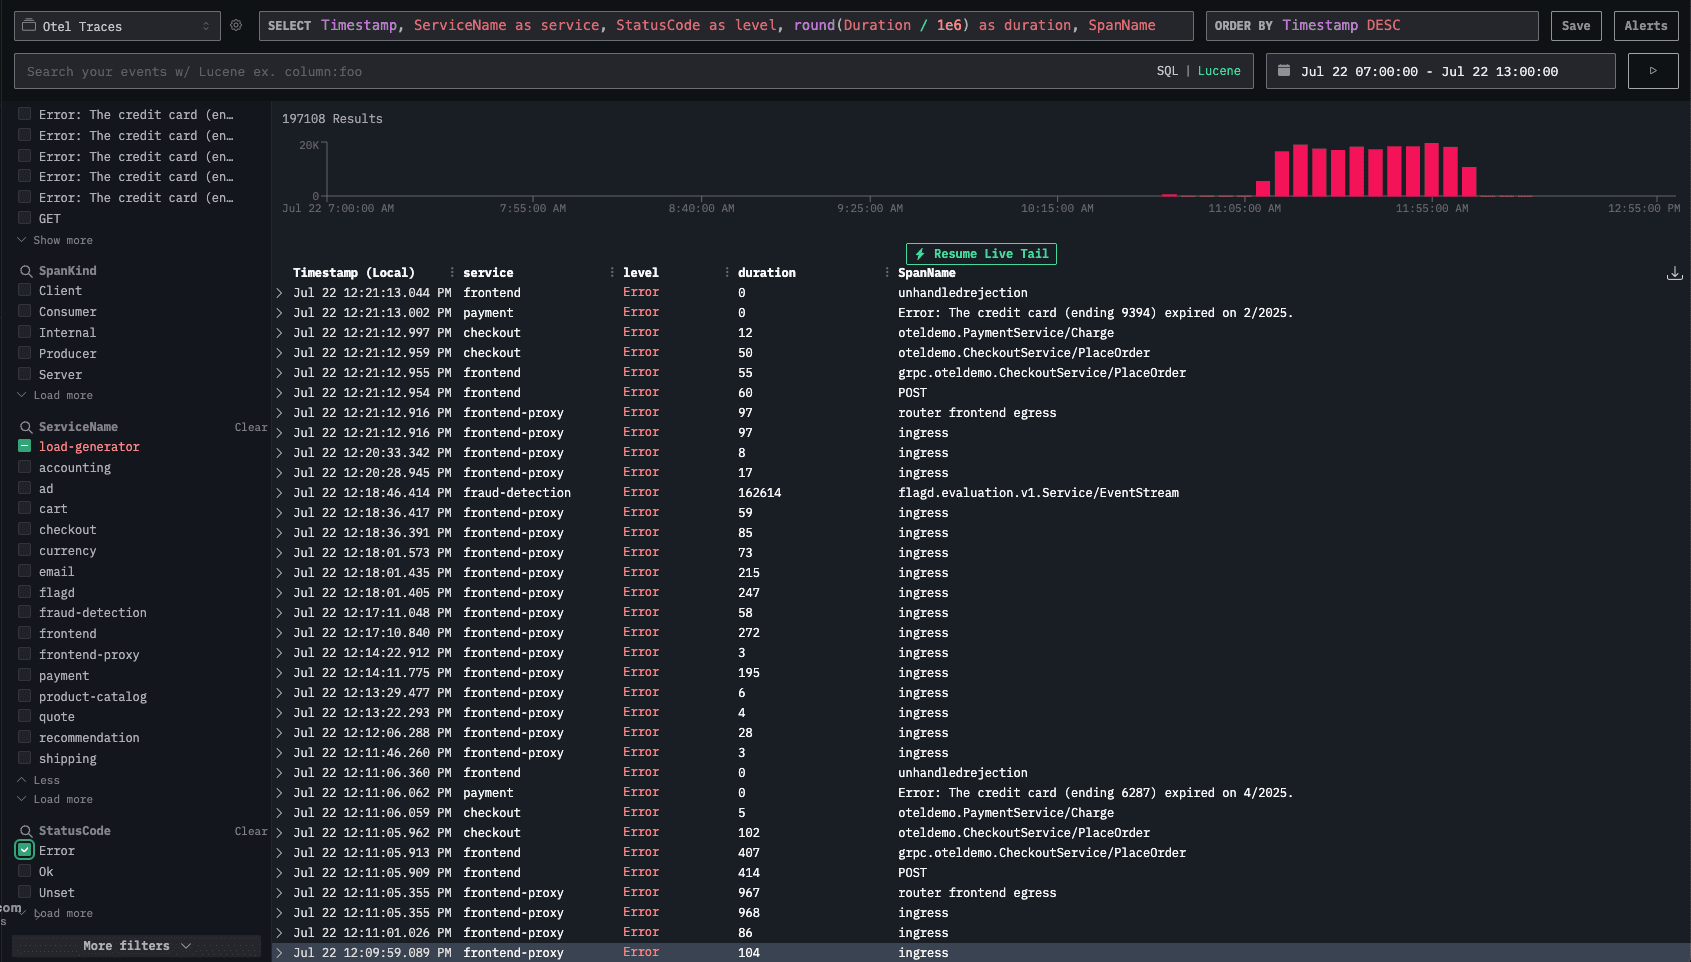
We navigate to the traces explorer view, and filter the dashboard for the payment service.
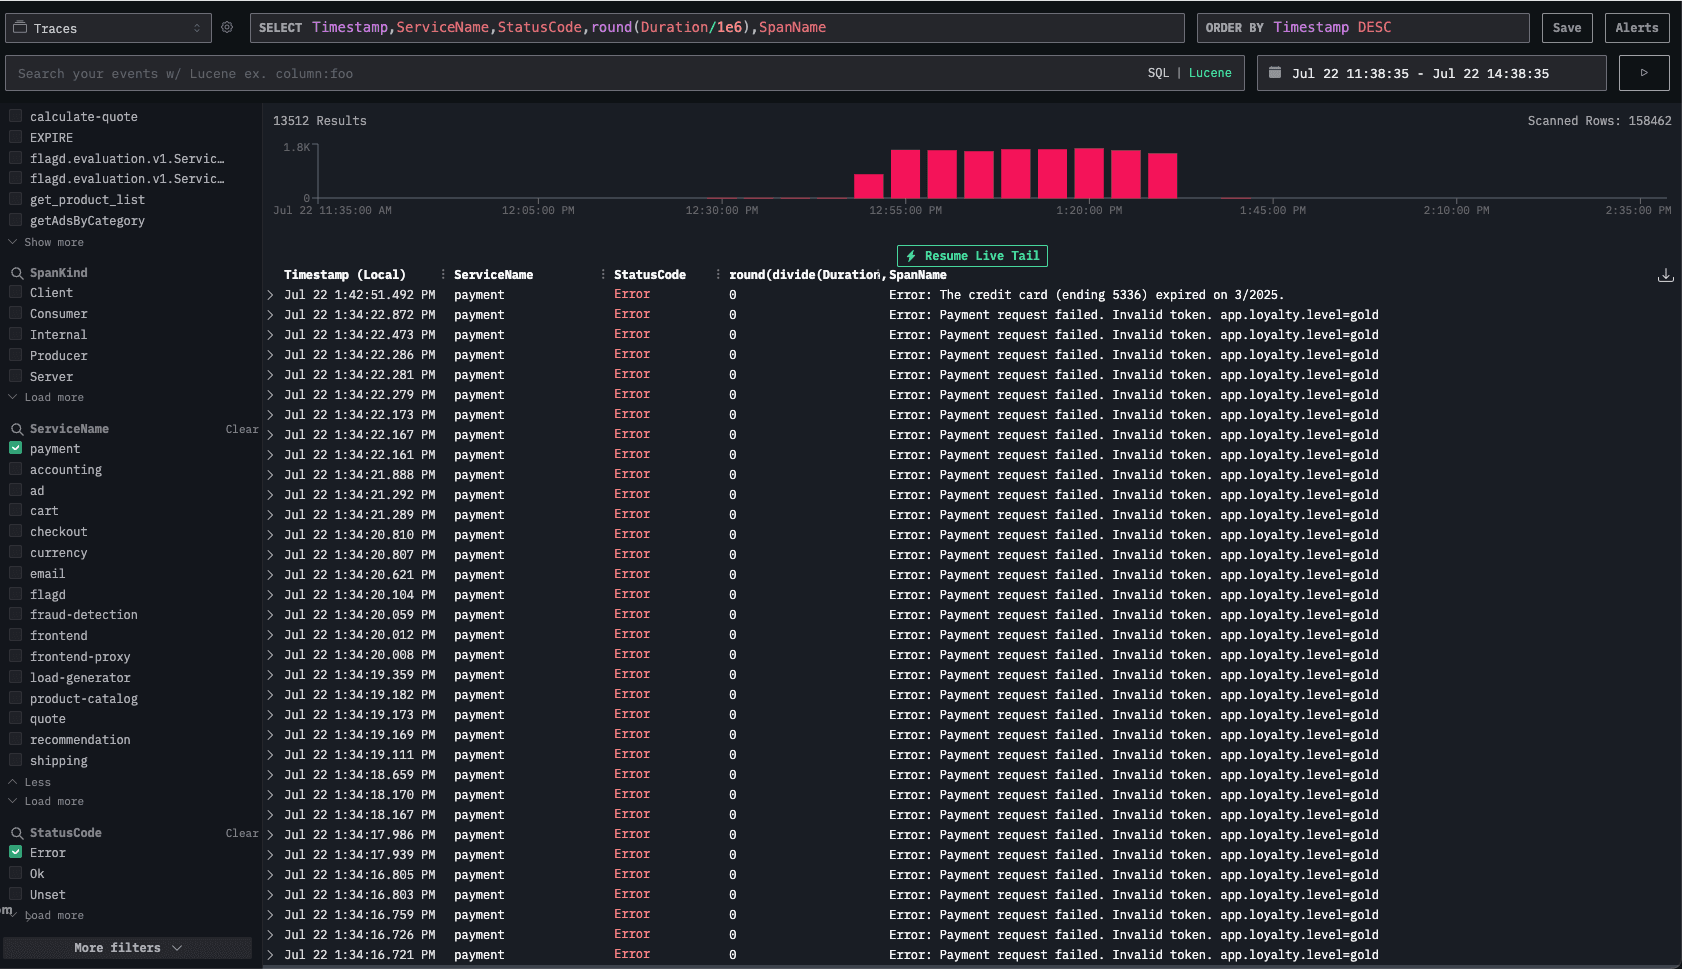
This validates our finding, the payment service has issues when processing requests from clients with a Gold loyalty status.
LLM investigation #
Claude Sonnet 4 model #
The model managed to find the RCA after the first prompt.
Expand below to see the full interaction.
Claude Sonnet 4 anomaly 1 full interaction
Prompt 1:
You're an Observability agent and have access to OpenTelemetry data from a demo application. Users have reported issues using the application, can you identify what is the issue, the root cause and suggest potential solutions?
LLM response 1 (snippet):
OpenTelemetry  Analysis  Report

Issues  Identified

1.  Primary  Issue:  Payment  Service  Gold  Tier  Failure

-  What:  Starting  at  11:52:35  on  July  22,  2025,  all  payment  transactions  for  users  with  "gold"  loyalty  level  began  failing  with  "Invalid  token"  errors
-  Impact:  50%  payment  failure  rate  (13,505  failed  transactions  out  of  27,000  total  payment  attempts)
-  Error  Message:  "Payment  request  failed.  Invalid  token.  app.loyalty.level=gold"
OpenAI o3 model #
The model managed to find the root cause and document it after the first prompt.
Expand below to see the full interaction.
OpenAI o3 anomaly 1 full interaction
Prompt 1:
You're an Observability agent and have access to OpenTelemetry data from a demo application. Users have reported issues using the application, can you identify what is the issue, the root cause and suggest potential solutions?
LLM response 1 (snippet):
Evidence
	1. Traces
– Payment service: 13,512 error spans, all named
"Error: Payment request failed. Invalid token. app.loyalty.level=gold"
– Checkout service: 27,024 error spans (same TraceId chain) with gRPC method oteledemo.PaymentService/Charge returning INTERNAL.
– Frontend / frontend-proxy: ~29,000 error spans ("Failed to place order").
	2. Logs
– 27,010 "failed to charge card: ... Invalid token ... loyalty.level=gold" log records.
– Small number (~6,000) of ECONNREFUSED errors, but they are an order of magnitude lower than the “Invalid token” failures.
	3. Metrics
– No CPU / memory anomalies; latency spikes coincide with spikes in payment errors.
– Error rate is almost 100% for PlaceOrder when loyalty.level = gold.
OpenAI GPT4.1 model #
Initially, the model didn’t query the data in ClickHouse via the MCP server. After a follow-up prompt, it queried ClickHouse and analyzed the data but couldn’t identify the root cause. It focused on the trace’s parent spans, which were impacted by the issue but not the actual source. The model only found the root cause after we gave it direct guidance.
Expand below to see the full interaction.
OpenAI GPT4.1 anomaly 1 full interaction
Prompt 1:
You're an Observability agent and have access to OpenTelemetry data from a demo application. Users have reported issues using the application, can you identify what is the issue, the root cause and suggest potential solutions?
LLM response 1 (snippet):
To help you identify the issue, root cause, and suggest solutions, I’ll need to analyze relevant OpenTelemetry data from your demo application. This typically includes traces, metrics, and logs. Here’s how we’ll approach this:
	1. Issue Identification: I’ll look for error traces, high latencies, dropped requests, or anomalies.
	2. Root Cause Analysis: I’ll analyze the traces to see where bottlenecks, errors, or resource issues might exist (e.g., slow database calls, timeouts, dependency errors).
	3. Potential Solutions: Based on findings, I’ll suggest actionable solutions.
Prompt 2:
You have access to the data, can you start analyzing?
LLM response 2 (snippet):
Observed Issue
- High average span durations in several services, especially load-generator, frontend-proxy, and frontend.
- No explicit errors in logs or trace statuses.
- This points toward a potential performance/bottleneck issue rather than a code crash or failure.
Prompt 3:
Users have been reported issues during the payment process
LLM response 3 (snippet):
Impact
- Users, particularly with gold loyalty level, cannot complete payment, resulting in user-facing failures and high error rates in backend logs and traces.
Gemini 2.5 Pro #
To begin, Gemini made several errors trying to use the MCP tools to list databases. After the initial prompt, Gemini went in the wrong direction and focused on latency numbers of a specific API that was not causing a problem. After prompting it to look in the direction of the payment process, Gemini correctly identified the gold status issue.
Expand below to see the full interaction.
Gemini 2.5 Pro anomaly 1 full interaction
Prompt 1:
You're an Observability agent and have access to OpenTelemetry data from a demo application. Users have reported issues using the application, can you identify what is the issue, the root cause and suggest potential solutions?
LLM response 1 (snippet):
### Issue

The application is experiencing high latency, with the `frontend-proxy` service being the most affected. The P95 latency for this service is over 1 second, which is significantly impacting the user experience.

### Root Cause

The root cause of the high latency is long-running calls from the `frontend-proxy` service to the `flagd.evaluation.v1.Service/EventStream` endpoint of the `flagd` service. The trace analysis shows that these calls can take over 3 minutes to complete. This is because the `EventStream` is a streaming endpoint designed to provide real-time updates of feature flags. The `frontend-proxy` is making a request to this endpoint and holding the connection open, which is causing the long-running spans and, consequently, the high latency.

The `canceled: "true"` attribute on the `router flagservice egress` span in the `frontend-proxy` service suggests that the proxy is timing out and canceling the request. However, the `flagd` service does not seem to be handling this cancellation correctly and continues to process the request, keeping the stream open for an extended period.

### Solution

To resolve this issue, the following actions are recommended:

*   **Use a Short-Lived RPC for Feature Flag Evaluation**: Instead of using the `EventStream` endpoint, the `frontend-proxy` should use a more appropriate, short-lived RPC for fetching feature flags. This will ensure that the connections are not held open for extended periods, reducing the latency of the `frontend-proxy` service.
*   **Investigate the `flagd` Service**: The `flagd` service should be investigated to understand why it's not handling client-side cancellations correctly. The developers should ensure that the service gracefully handles canceled requests and closes the streams promptly.
*   **Review the `frontend-proxy` Configuration**: The `frontend-proxy`'s configuration should be reviewed to ensure that it's correctly handling streaming responses and that the timeouts are set to appropriate values.

By implementing these solutions, you should be able to significantly reduce the latency of the `frontend-proxy` service and improve the overall performance and reliability of your application.
Prompt 2:
Users have reported issues during the payment process
LLM response 2 (snippet):
Based on my investigation, I've identified the root cause of the payment issues and have recommendations for a solution.

### Summary of Findings

*   **No Explicit Errors:** My initial search for traces and logs with an "ERROR" status for the `payment` service came up empty. This indicates that the application is not correctly flagging these issues as errors.
*   **Anomalous Span Names:** An analysis of the service's trace data revealed a peculiar pattern: spans being created with names that are actually error messages. For example:
    *   `Error: Payment request failed. Invalid token. app.loyalty.level=gold`
    *   `Error: The credit card (ending 1791) expired on 1/2025.`
*   **Error Context:** By examining these "error spans," I found that the "Invalid token" error consistently occurs for users with the `app.loyalty.level` attribute set to `gold`.

### Root Cause

The user-reported payment issues are caused by a bug in the `payment` service that specifically affects customers with a "gold" loyalty status. When these users attempt to make a payment, the service fails with an "Invalid token" error.

Furthermore, the application is handling these errors incorrectly from an observability standpoint. Instead of setting the status of the parent span (e.g., the `charge` or `grpc.oteldemo.PaymentService/Charge` span) to `ERROR`, the developers have written code that creates a new, zero-duration span with the error message as its name. This practice hides the errors from standard monitoring dashboards and makes it difficult to track the error rate of the service.

### Recommended Solutions

1.  **Fix the Payment Logic:**
    *   **Immediate Priority:** The development team must investigate and fix the bug in the `payment` service that causes token validation to fail for "gold" loyalty members. This is the primary cause of the user-facing issue.

2.  **Correct the Instrumentation:**
    *   **Best Practice:** The practice of creating new spans to log errors should be stopped. Instead, developers should adhere to OpenTelemetry best practices:
        *   When an error occurs, the `StatusCode` of the existing span in which the error happened should be set to `ERROR`.
        *   The error details should be recorded as an `Event` (also known as a `Log`) within that span, including attributes for the exception type, message, and stack trace. This ensures that errors are properly tracked, correlated with traces, and can be used to trigger alerts.

By addressing both the underlying bug in the payment logic and the incorrect instrumentation, you will resolve the user-reported issues and significantly improve the observability and reliability of your application.
LLM investigation summary #
| Model | Resolution | # of MCP calls | Duration | Input tokens | Output tokens | Cost |
|---|---|---|---|---|---|---|
| Claude 4 sonnet | Yes | 15 | 2 minutes | 1028123 | 4487 | $3.15 |
| OpenAI o3 | Yes | 15 | 2 minutes | 57397 | 2845 | $0.17 |
| OpenAI GPT4.1 | Yes, with minor guidance | 14 | 3 minutes | 43479 | 2224 | $0.10 |
| Gemini 2.5 Pro | Yes, with minor guidance | 12 | 3 minutes | 313892 | 7451 | $0.90 |
Anomaly 2: Recommendation cache leak #
An issue on the recommendation cache service has been introduced which causes the service CPU usage to spike.
Manual investigation #
Let’s start the investigation from the logs, we can see an increase in error messages.
Scrolling through them, it’s not immediately obvious what the root cause is. We can see multiple error with a message about connection issue: ⨯ Error: 14 UNAVAILABLE: No connection established. Last error: connect ECONNREFUSED 34.118.225.39:8080 (2025-07-22T11:05:44.834Z)
Let’s filter the trace explorer view to select only the traces in error and exclude the load-generator service as it is creating a lot of noise.
We see errors related to the recommendation service. Let’s filter only traces from the recommendation service.
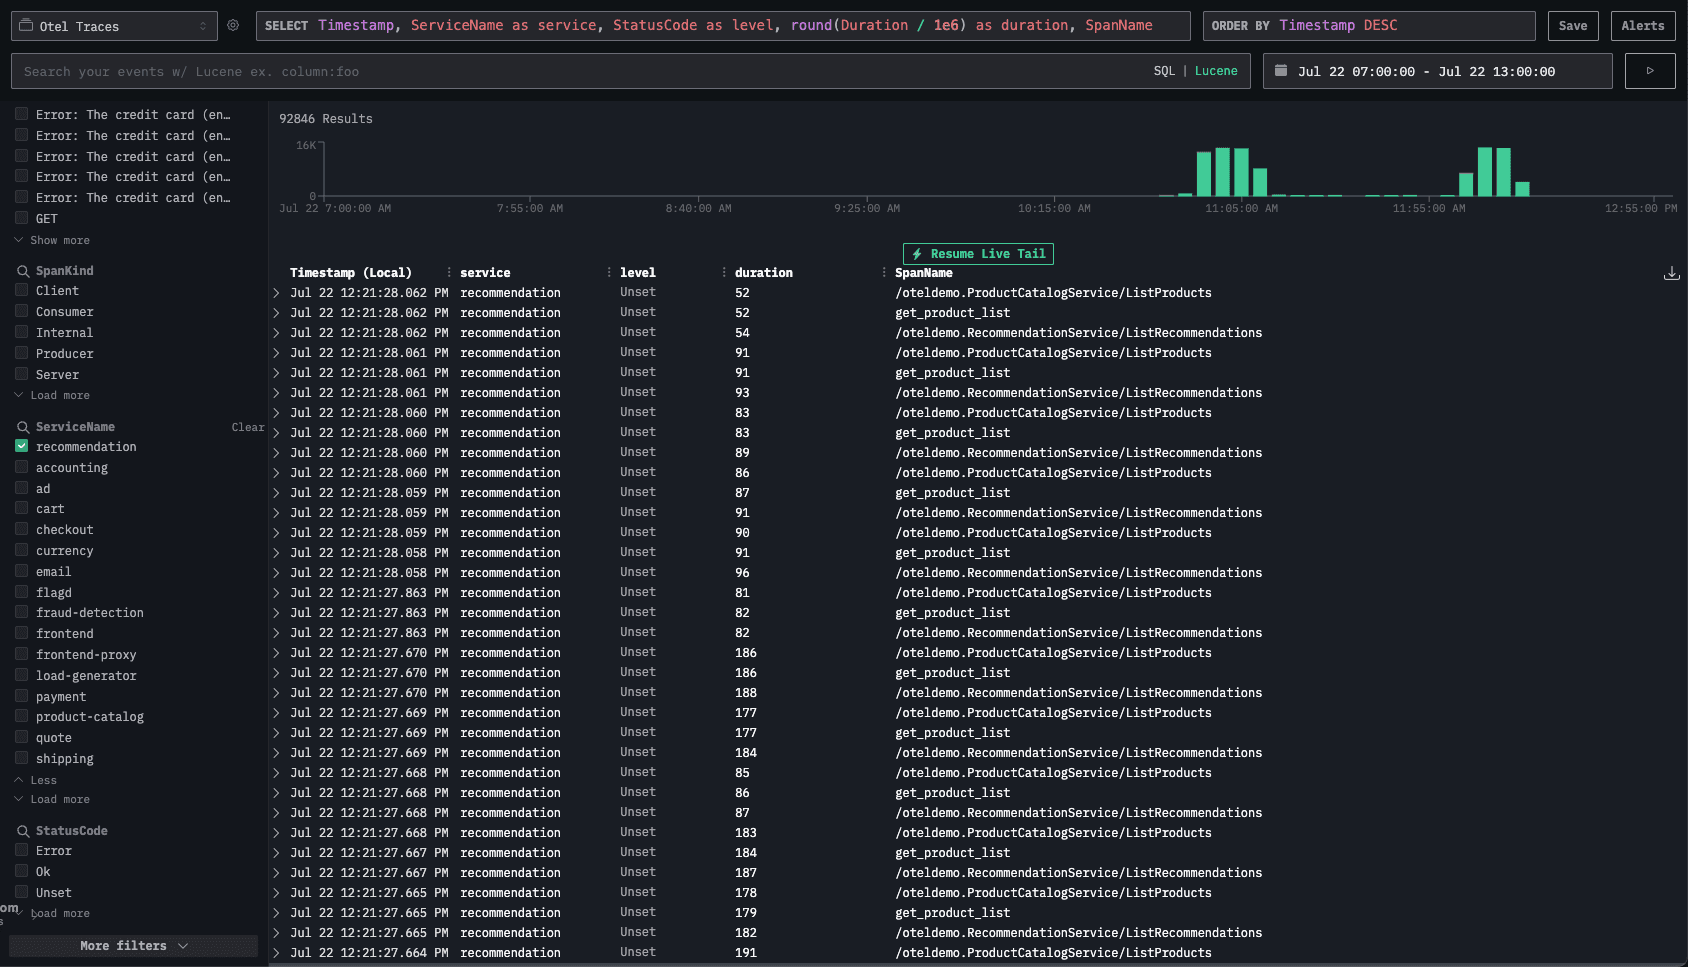
It seems there is a drop in traces during the experiment. Let’s validate that with the request throughput for the recommendation service using the Services view.
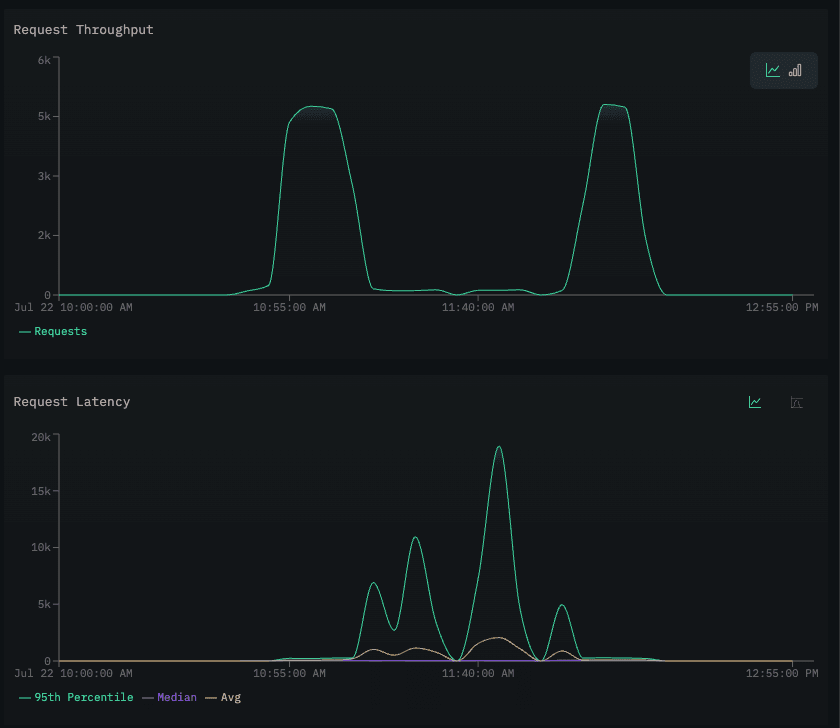
Throughput for the recommendation service dropped, while latency increased. This suggests the service is still responding but much more slowly, likely causing bottlenecks that lead to timeouts or connectivity errors.
Let’s return to the Traces and see if we can identify any common patterns among the traces using the Event deltas.
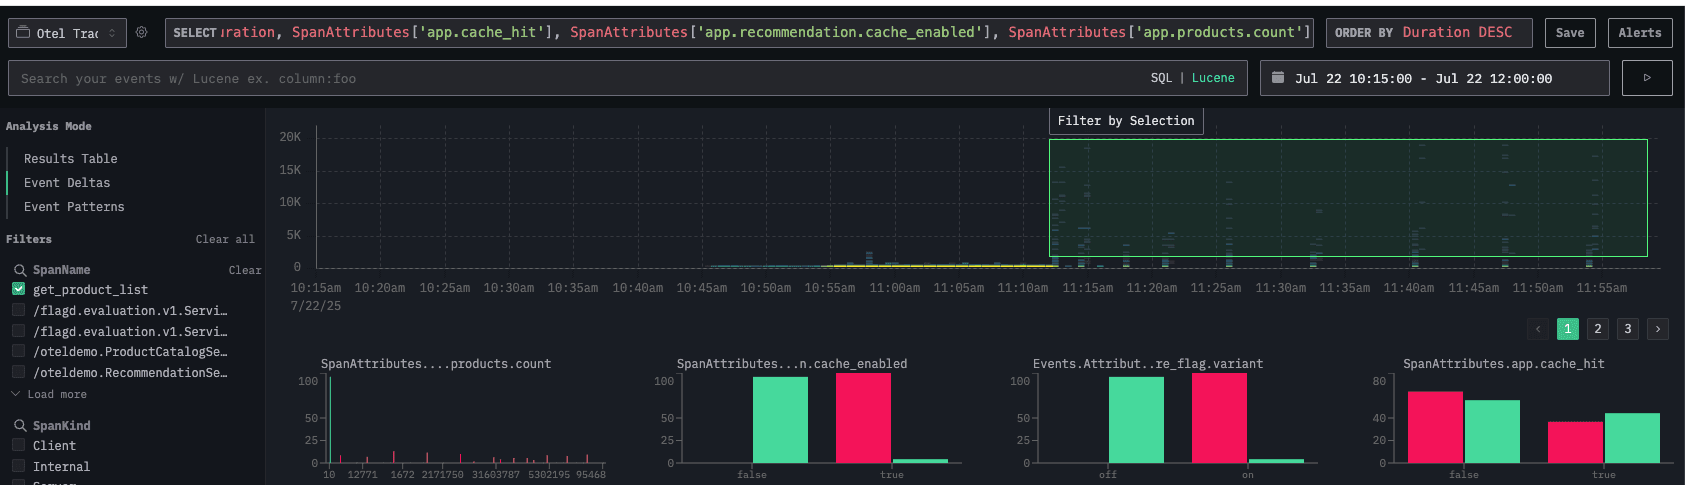
On the Event deltas screen, filtered by the get_product_list function, we can use the outliers attribute to compare fast and slow requests.
In this case, the outlier requests (slow requests) tend to return more than 10 products and have the recommendation cache enabled.
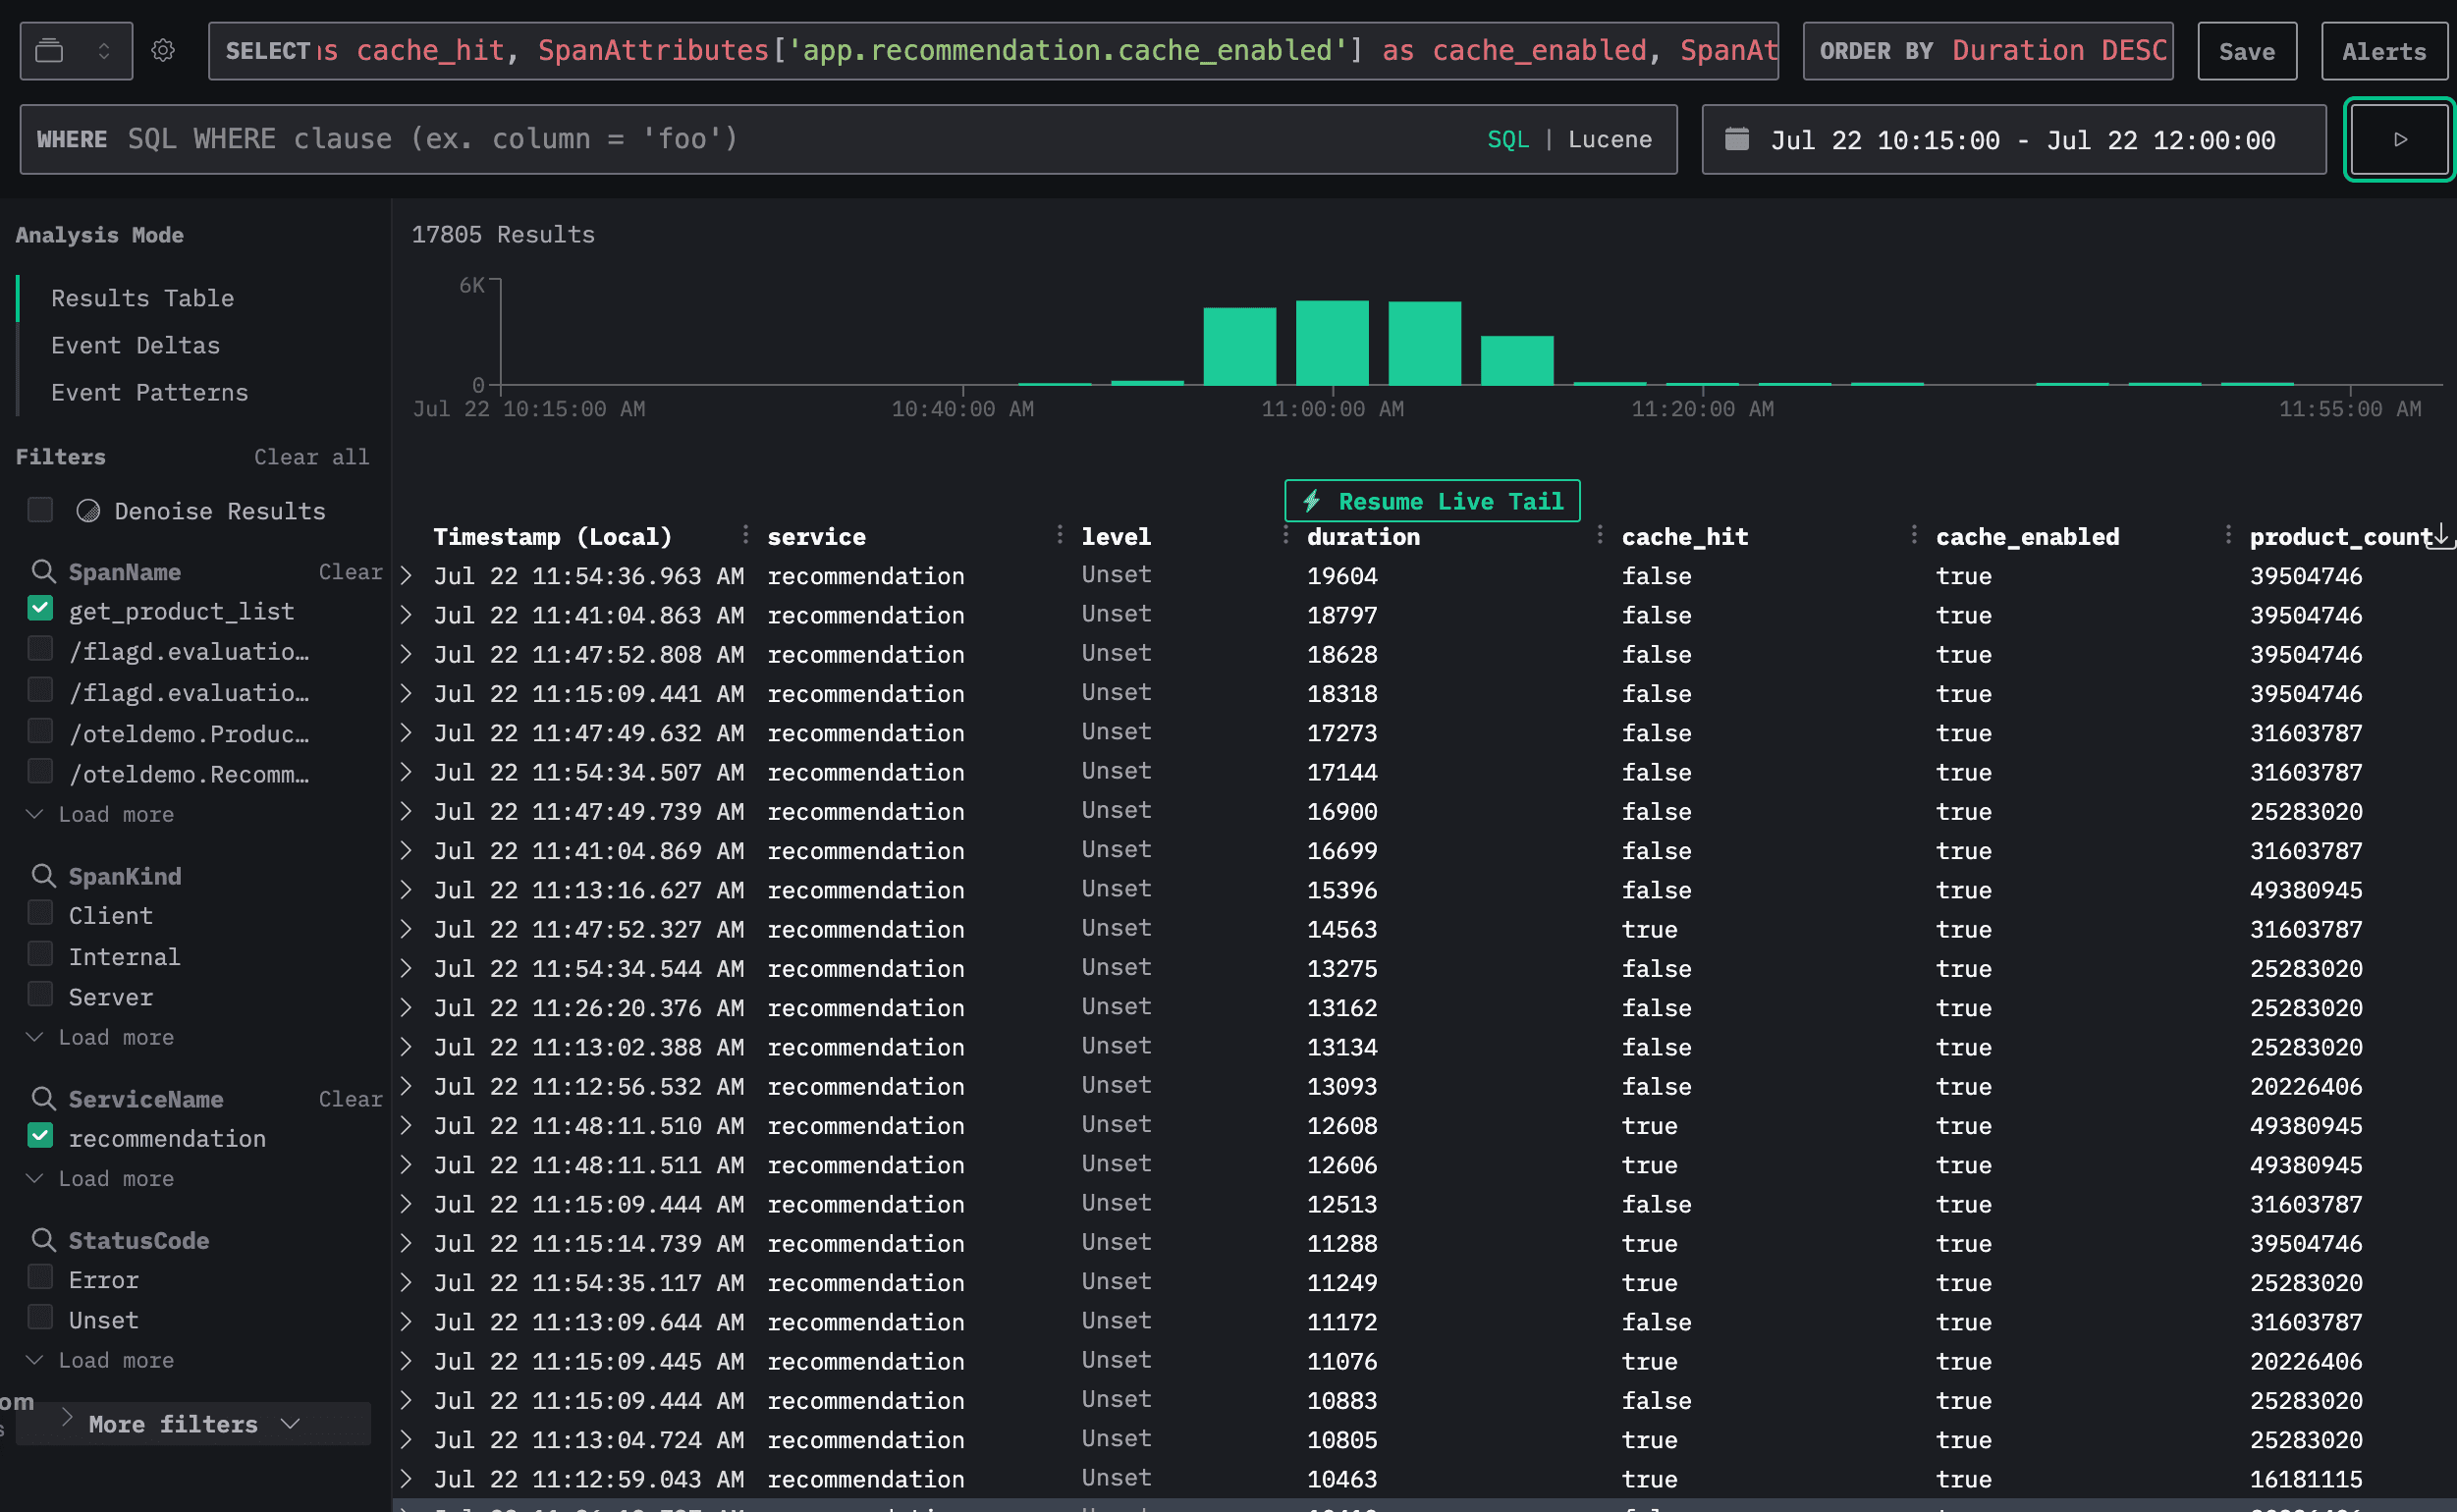
In requests where the cache is enabled, we observed that when the number of products is high and if the cache misses, the request duration increases.
The issue is related to the recommendation cache and the volume of selected products.
LLM investigation #
Claude Sonnet 4 model #
The model was able to localize the root cause to the recommendation service but didn’t initially identify the cache issue.
Its progress was limited. It correctly observed that the recommendation service was failing due to resource exhaustion and noted that the service had restarted 12 times—something we hadn’t uncovered during our manual analysis.
It also identified that the restarts were caused by hitting the CPU limit, not a memory problem. While that’s a helpful detail, it still missed the actual cache-related issue.
This reflects a common pattern: the model tends to lock onto a single line of reasoning and doesn’t explore other possibilities.
When we followed up by asking why the pod was using 100% CPU, the model finally pinpointed a problem with how the recommendation service cache was behaving.
Expand below to see the full interaction.
Claude Sonnet 4 anomaly 2 full interaction
Prompt 1:
You're an Observability agent and have access to OpenTelemetry data from a demo application. Users have reported issues using the application, can you identify what is the issue, the root cause and suggest potential solutions?
LLM response 1 (snippet):
The Recommendation Service experienced a complete outage, causing cascading failures throughout the application:
	1. Primary Issue:
The recommendation service became completely unavailable between 10:13–11:05 UTC
	• Normal span count dropped from 14,000 per 5-min window to 300–400
	• Service was essentially down for nearly an hour
	2. Connection Failures:
Frontend services couldn’t connect to recommendation service endpoints:
	• IP addresses being refused: 34.118.225.39:8080, 34.118.236.87:8080, 34.118.226.49:8080
	• 295,538 error logs from frontend service with "ECONNREFUSED" errors
	• 51,190 failed gRPC calls to RecommendationService/ListRecommendations
Prompt 2:
Why does the RecommendationService/ListRecommendations fail?
LLM response 2 (snippet 1/2):
Root Cause Analysis: Why RecommendationService/ListRecommendations Fails

Based on my deep analysis of the observability data, here’s exactly why the RecommendationService/ListRecommendations is failing:

The Core Problem: Resource Exhaustion Leading to Cascading Failures

Primary Root Cause:
The recommendation service is experiencing resource starvation in its Kubernetes environment, leading to repeated container restarts.
LLM response 2 (snippet 2/2):
Restart Pattern:
	• 12 service restarts in just 1 hour (10:13–11:07)
	• Restart frequency: Every 3–7 minutes
	• Restart timestamps show clear crash–restart cycles
Prompt 3:
Why do you think the recommendation service restarted?
LLM response 3 (snippet):
Why the Recommendation Service Restarted – The Complete Analysis

Based on my deep dive into the observability data, I can now provide the exact reason for the recommendation service restarts:
⸻

Root Cause: CPU Throttling Leading to Kubernetes Health Check Failures

The Primary Trigger:
The recommendation service is being killed by Kubernetes due to failed health checks, not by memory issues (OOMKilled).
⸻

Evidence-Based Analysis:

Restart Pattern Analysis:
	• 12 restarts in 54 minutes (10:13:40 – 11:07:23)
	• Restart intervals: 54s, 96s, 77s, 179s, 248s, 436s, 411s, 488s, 414s, 400s, 420s
	• Pattern: Initial rapid restarts (54–96s), then gradually increasing intervals as system stabilizes
Prompt 4:
Why is the pod using 100% CPUs?
LLM response 4 (snippet):
Root Cause Analysis:

The Problem: Algorithmic Complexity Explosion
What’s happening inside the recommendation service:
	1. Cache Warming Issue:
At 10:12, something changes in the request patterns.
	2. Cold Cache Performance:
When cache misses happen, the recommendation algorithm becomes computationally expensive.
	3. Product List Processing:
The get_product_list function is doing heavy computation.
	4. Cascade Effect:
As processing time increases, requests queue up, making everything slower.
OpenAI o3 model #
The model identified that the recommendation service was unavailable but didn’t explain why. When we asked for more details, it didn’t provide any useful insight. We then rephrased the question slightly. This time, the model discovered that the pod had crashed, though it couldn’t determine the exact cause. It suggested either a memory issue or a feature flag—both in the right direction.
We pressed further on the memory angle, which led the model to identify the cache-enabled flag as the likely root cause. However, when proposing a fix, the model generated a solution that wasn’t valid. It suggested code that doesn’t exist in the application, likely because it has no access to the source code.
Expand below to see the full interaction.
OpenAI o3 anomaly 2 full interaction
Prompt 1:
You're an Observability agent and have access to OpenTelemetry data from a demo application. Users have reported issues using the application, can you identify what is the issue, the root cause and suggest potential solutions?
LLM response 1 (snippet):
Root cause (most likely)

The Recommendation Service is down or unreachable from the cluster:
	• Pod(s) may be CrashLooping or scaled to 0
	• Service/Endpoint list may be empty or pointing to the wrong port
	• Container may start but not bind to 0.0.0.0:8080 (misconfiguration, wrong PORT env-var)
Prompt 2:
Why does the RecommendationService/ListRecommendations fail?
LLM response 2:
In short:
ListRecommendations fails whenever traffic is routed to an orphan / wrong IP (34.118.225.39).
Clean up that bad endpoint and the errors disappear.
Prompt 3:
Can you check before the recommendation service became unavailable what could have caused to crash?
LLM response 3 (snippet):
What probably caused the crash

– Memory leak or a code path that loads a huge product list into RAM
(note the 424 MiB / 332 MiB jumps right after fetching the product catalogue)
– A recent feature-flag or config change that increases the amount of data the service keeps in memory on start-up
Prompt 4:
"note the 424 MiB/332 MiB jumps right after fetching the product catalogue" This is interesting. Can you check why fetching the product catalogue increased the memory a lot?
LLM response 4 (snippet 1/2):
10:12 – flag flips → cache enabled
	• ResolveBoolean/flagd traces appear for key "recommendation.cache_enabled"
	• Subsequent get_product_list spans show cache_enabled = true
	• In the very first minute after the flip, the value of app.products.count jumps from 10 to 20,226,406 (≈ 2 × 10⁷)
	• container.memory.usage spikes to 830 MiB and the pod is OOM-killed
LLM response 4 (snippet 2/2):
What the numbers tell us

The code that builds the cached product list is appending the entire list to itself on every cache miss / cold start instead of replacing it:
new_list = cache.get()         # [] on first run
new_list += remote_product_list  # +10
cache.set(new_list)

After a restart, the cache is empty again, so the first call fetches 10 products and stores them.

But a second call (still within the same process) does:
new_list = cache.get()         # 10 items
new_list += remote_product_list  # +10 ⇒ 20
cache.set(new_list)
OpenAI GPT4.1 #
The model struggles to identify the root cause on its own. It doesn’t query data through the MCP tool unless explicitly instructed to do so. By default, it focuses only on logs and needs additional prompts to include traces and metrics in its analysis.
Once it reviews all the data, it flags the flagd service as a bottleneck affecting multiple components. While this is partially accurate, our manual investigation showed it’s not the main issue.
We directed the model to look into the Recommendation service, but it only mentioned the cache problem after we explicitly pointed it out.
Expand below to see the full interaction.
OpenAI GPT4.1 anomaly 2 full interaction
Prompt 1:
You're an Observability agent and have access to OpenTelemetry data from a demo application. Users have reported issues using the application, can you identify what is the issue, the root cause and suggest potential solutions?
LLM response 1 (snippet):
Absolutely, I can help you analyze OpenTelemetry data to diagnose issues within your demo application.
However, I’ll need more specific information or access to the relevant datasets (for example, traces, logs, or metrics from your observability backend).
Prompt 2:
You have access to the OTel data in clickhouse, please query it.
LLM response 2 (snippet):
What this means
	• The backend services (like API, web, or data processors) are not showing trace-level errors in the trace data.
	• The only error detected is from the load-generator, which is likely the synthetic traffic generator for testing/demo purposes.
This could be expected and not user-impacting.
Prompt 3:
You also have access to traces and metrics data to further continue the investigation
LLM response 3 (snippet):
Issue Identified

A major performance bottleneck is occurring in the /flagd.evaluation.v1.Service/EventStream span across multiple critical services (recommendation, fraud-detection, ad, flagd).
This is causing very high latencies, likely resulting in a degraded or unusable application experience for users.
Prompt 4:
Yes, can you focus on the recommendation service?
LLM response 4:
Conclusion & Root Cause:
	• The recommendation service is blocked waiting for a response from flagd’s EventStream, hitting timeouts.
This means either the flagd service is slow, unavailable, or network connectivity to it is broken.
	• Because flagd (feature flag evaluation) is used within critical request paths,
when it fails or hangs, the entire recommendation chain suffers, severely impacting user experience.
Prompt 5:
Top durations for /oteldemo.RecommendationService/ListRecommendations are also very high (over 21–22 seconds), suggesting calls to downstream dependencies (like flagd) are causing severe slowness in client-facing endpoints. Why do you think recommendation service (ListRecommendations) is calling flagd?
LLM response 5:
Trace Duration Patterns:
	• The /flagd.evaluation.v1.Service/EventStream spans within the recommendation service show extremely high durations
(all stuck at 600+ seconds, matching the gRPC deadline).
	• The /oteledemo.RecommendationService/ListRecommendations spans also have high durations (~21–22 seconds),
though not as long as the flagd EventStream spans, but still anomalous for a user-facing endpoint.
Prompt 6:
You have access to tracing data, you can check the direct trace linking.
LLM response 6:
	• Based on the evidence, I cannot confirm with this trace dataset that ListRecommendations is directly calling flagd via EventStream in a way that is instrumented by distributed traces.
	• The slowness seen in both operations remains highly correlated.
Architectural practice suggests such a dependency may exist, but it is not proven in the current tracing data.
Prompt 7:
if you can't find a direct link. Can you see another reason the recommendation service is running slow?
LLM response 7:
Key Observations:
	• Durations are very high (around 19–22 seconds).
	• All these slow requests have StatusCode “Unset” and rpc.grpc.status_code = "0"
(which means the gRPC call technically succeeded from a protocol point of view).
	• The span attributes are consistent—each request recommended 5 products, the peer IP was the same (10.32.10.87), and the user agent is grpc-node-js/1.12.6.
	• No explicit errors or useful StatusMessage are present.
Prompt 8:
We recently upgraded the function get_product_list to optimize the cache logic. Can you check this didn't create a regression?
LLM response 8:
Is this a regression?
	• A p95 response time of 200–250 ms might be acceptable for some backends, but if this represents a rise compared to previous levels, it could indicate a performance regression from the cache optimization.
	• If this is much higher than before the change, it could mean the cache is not being hit effectively, or new cache logic is causing delays (e.g., added serialization, locking, or slower fallback path).

⸻

Signs of regression:
	• There’s a jump from 204 ms to 251 ms during the 10:00–11:00 interval, possibly coinciding with the upgrade/deployment window.
Prompt 9:
Looking at the data it looks like the request latency for get_product_list went up though.
LLM response 9:
Summary:

There is strong evidence from tracing data that the cache logic upgrade in get_product_list introduced increased latency, likely hurting overall recommendation service responsiveness.
Rolling back or tuning the new cache logic should be prioritized.
Gemini 2.5 Pro #
Gemini initially explored the available database tables, acknowledging that traces, logs and metrics were available. It explained that it would begin with traces, but performed its entire investigation without ever considering logs or metrics. Using traces, it became locked on to the wrong problem.
After prompting it to also consider logs, Gemini then started to head in the right direction, suggesting that there was a timeout in the recommendation service, but did not discover why. After prompting it to investigate why the service timed out, it once again reverted back to only using traces, from which it decided that the issue was DNS. There are DNS errors present in the data set, but these are unrelated to the service in question. We then prompted it yet again to use the logs, but it got no further.
Next, we prompted it to consider the metrics table, which had some success; it discovered that the pods were reaching 100% CPU usage and suggested this was the cause - but did not dig any deeper. Prompting it to look into why it reached 100%, Gemini looped around and found nothing.
However, it then began to formulate an imaginary cause (for which it had no evidence), and began trying to prove its case.
Gemini was convinced that the cause must be a “poinsoned” product ID, and it began hunting for anything it could use to back this up. It was unsuccessful, but at least it admitted it.
We then asked it to take a look at resource usage around the time of the CPU spike, to see if there were other resources in contention. Somehow, this caused Gemini to discard the 100% CPU usage as a problem, and revert to telling us that DNS was, indeed, the problem (it isn’t).
Expand below to see the full interaction.
Gemini 2.5 Pro anomaly 2 full interaction
Prompt 1:
You're an Observability agent and have access to OpenTelemetry data from a demo application. Users have reported issues using the application, can you identify what is the issue, the root cause and suggest potential solutions?
LLM response 1 (snippet):
This is a very interesting finding. The top 10 longest-running spans are all related to the `flagd.evaluation.v1.Service/EventStream`. The durations are extremely high, in the order of 600 seconds (10 minutes), which is a strong indicator of a timeout or a serious performance bottleneck.

The services affected are `recommendation`, `fraud-detection`, and `ad`, which suggests a widespread problem with a shared dependency. In this case, the dependency is the `flagd` service, which appears to be a feature flagging service.

Based on this, I have identified the following:

**Issue:**

Users are experiencing significant performance issues with the application. These issues are not presenting as explicit errors but as very slow responses, leading to a poor user experience.

**Root Cause:**

The root cause of the performance degradation is the `/flagd.evaluation.v1.Service/EventStream` endpoint. This service is used by multiple other services (`recommendation`, `fraud-detection`, and `ad`) to receive feature flag updates. The extremely long duration of these calls indicates that the client services are waiting for a response from the `flagd` service for up to 10 minutes, which is causing them to become unresponsive.

**Potential Solutions:**

To resolve this issue, I recommend the following actions:

*   **Investigate the `flagd` service:** The `flagd` service should be the primary focus of the investigation. Check its logs and metrics to understand why the `EventStream` endpoint is not responding in a timely manner.
*   **Review network policies:** It is possible that a network policy is preventing the client services from connecting to the `flagd` service, leading to a timeout. Review the network policies to ensure that there are no rules blocking this traffic.
*   **Implement connection timeouts:** The client services that connect to the `flagd` service should have a much shorter connection timeout. This will prevent them from being stuck for long periods and will allow them to fail fast and recover more gracefully. A timeout of a few seconds would be a good starting point.
*   **Add readiness and liveness probes:** If the `flagd` service is running in a containerized environment (like Kubernetes), adding readiness and liveness probes will help automatically detect and recover from situations where the service is not responding.

By implementing these recommendations, you should be able to resolve the performance issues and improve the user experience of your application.
Prompt 2:
I dont think this is the problem. have you considered using the logs table as well?
LLM response 2:
Excellent! I've found the smoking gun. The logs from the `frontend-proxy` service show a clear pattern of `504 UT response_timeout` errors when calling the `frontend` service's `/api/recommendations` endpoint. This is a strong indicator that the `frontend` service is the bottleneck. The `response_timeout` message in the logs confirms that the `frontend-proxy` is waiting too long for a response from the `frontend` service.

Now that I've narrowed down the problem to the `frontend` service, I will investigate its traces to understand what's causing the delay. I'll focus on the `/api/recommendations` endpoint and look for the longest-running spans to pinpoint the exact operation that's causing the bottleneck.

I will now query the `otel_traces` table for the top 10 longest-running spans in the `frontend` service with the `SpanName` of `/api/recommendations`.

...

This is unexpected. I see that there are no traces for the `/api/recommendations` span in the `frontend` service, even though the logs from the `frontend-proxy` clearly show that this endpoint is being called.

This could mean that the `frontend` service is not correctly configured to generate traces for this endpoint. This is a common problem in distributed tracing setups, where some services might not be properly instrumented.

Even though I can't see the traces for the `/api/recommendations` endpoint, the logs from the `frontend-proxy` provide enough evidence to conclude that the `frontend` service is the root cause of the performance issues. The `504 UT response_timeout` errors are a clear indication that the `frontend` service is not responding in a timely manner.

Based on this, I can provide the following updated analysis:

**Issue:**

Users are experiencing significant performance issues with the application. These issues are not presenting as explicit errors but as very slow responses, leading to a poor user experience.

**Root Cause:**

The root cause of the performance degradation is the `frontend` service. The `frontend-proxy` is timing out when calling the `/api/recommendations` endpoint on the `frontend` service, as evidenced by the `504 UT response_timeout` errors in the `frontend-proxy`'s logs.

**Potential Solutions:**

To resolve this issue, I recommend the following actions:

*   **Investigate the `frontend` service:** The `frontend` service should be the primary focus of the investigation. Check its logs and metrics to understand why the `/api/recommendations` endpoint is not responding in a timely manner.
*   **Instrument the `frontend` service for tracing:** To get a better understanding of the performance of the `frontend` service, it's crucial to instrument it to generate traces. This will allow you to see the full lifecycle of a request and identify the exact operations that are causing the delay.
*   **Review the code for the `/api/recommendations` endpoint:** The code for the `/api/recommendations` endpoint should be reviewed to identify any potential performance bottlenecks. This could include inefficient database queries, slow external service calls, or other performance anti-patterns.
*   **Add readiness and liveness probes:** If the `frontend` service is running in a containerized environment (like Kubernetes), adding readiness and liveness probes will help automatically detect and recover from situations where the service is not responding.

By implementing these recommendations, you should be able to resolve the performance issues and improve the user experience of your application. The most critical step is to instrument the `frontend` service so you can get a better understanding of its performance and identify the root cause of the timeouts.
Prompt 3:
Why does the recommendation service timeout?
LLM response 3 (snippet):
This is the exact question we need to answer. The trace data has provided a crystal-clear picture of what's happening. Let's break it down.

**Analysis of the Trace (`425b78d730282b74af1a880fa7758a3b`)**

1.  **The Client's Perspective (`frontend` service):**
    *   The `frontend` service makes a call to the `recommendation` service (`grpc.oteldemo.RecommendationService/ListRecommendations`).
    *   This call takes **307 milliseconds** from the `frontend` service's point of view.

2.  **The Server's Perspective (`recommendation` service):**
    *   The `recommendation` service receives the request, processes it, and sends a response.
    *   The actual processing time inside the `recommendation` service (`/oteldemo.RecommendationService/ListRecommendations` span) is only **5 milliseconds**.

**The Root Cause: Massive Network Overhead**

The difference between the client's measured time (307 ms) and the server's processing time (5 ms) is **302 milliseconds**. This massive delay is happening *outside* the recommendation service's code.

I found the same pattern for all other downstream calls from the `frontend` service. For example, calls to the `product-catalog` service take about **218 ms** from the client's side but are processed in less than **1 ms** on the server side.

This means there is a consistent, large overhead of **~200-300 milliseconds** for every single outgoing gRPC call made by the `frontend` service.

**Conclusion**

The **recommendation service is not the problem**. It's extremely fast. The problem lies within the `frontend` service's environment, which is adding a significant delay to every network call it makes.

This is the root cause of the entire issue. This fixed delay makes the `frontend` service incredibly slow, which in turn causes the `frontend-proxy` to time out, just as we saw in the logs.

**Likely Causes for the Overhead and Next Steps**

This type of fixed overhead on outgoing network calls is often caused by misconfigurations in the environment, such as:

*   **DNS Resolution Issues:** The `frontend` service's container might be trying to resolve service names (like `recommendation.default.svc.cluster.local`) using an external DNS server that fails or times out, before falling back to the correct internal cluster DNS.
*   **Service Mesh Misconfiguration:** If you are using a service mesh like Istio or Linkerd, a misconfigured sidecar proxy could be adding this latency to every call.
*   **Network Policies:** A network policy could be slowing down connection establishment.

**Recommendation:**

Your next step should be to **investigate the runtime environment of the `frontend` service pod**. Specifically, check its DNS configuration (`/etc/resolv.conf`) and any service mesh or network policy configurations that apply to it. Resolving this environmental issue should eliminate the network call overhead and fix the application's performance problems.
Prompt 4:
Ok but what is causing the timeout?
LLM response 4:
You are asking the central question. I will connect all the pieces of evidence to give you a definitive answer.

The timeout is caused by a **"death by a thousand cuts"** scenario happening inside the `frontend` service. The root cause is the **~250ms of network overhead** that is added to *every single* outbound call it makes.

Here is the step-by-step breakdown of how this leads to a 15-second timeout for a single `/api/recommendations` request:

1.  **A Request Arrives:** A user requests recommendations, hitting the `frontend-proxy`, which forwards the request to the `frontend` service's `/api/recommendations` endpoint. The `frontend-proxy` starts a 15-second timer.

2.  **The `frontend` Service's Job:** To build the response, the `frontend` service needs to gather data from other services. Looking at the trace data, we know for this single request it makes **5 downstream calls**:
    *   1 call to the `recommendation` service.
    *   4 calls to the `product-catalog` service.

3.  **The Hidden "Network Tax":** As we discovered, every one of these 5 calls is burdened with a ~250 millisecond delay before it even leaves the `frontend` service's environment. The downstream services are incredibly fast, but this overhead is unavoidable on every call.

4.  **Calculating the Cumulative Delay:** These small delays add up. The total *self-inflicted* delay caused by the network overhead for just this one request is:
    > 5 calls × ~250 ms/call = **~1.25 seconds**

    This means that even if the other services responded instantly, the `/api/recommendations` endpoint would still take over a second to respond.

5.  **Amplification Under Load:** A 1.25-second response time is slow, but it's not a 15-second timeout. The timeout happens when the application is under load. The `load-generator` service is constantly sending requests. Because every request is slowed down by this 1.25-second (or more) overhead, the `frontend` service becomes a bottleneck. Requests start to pile up in a queue, waiting to be processed. This queuing and resource contention (CPU, connection pools) dramatically increases the total response time, pushing it far beyond the initial 1.25 seconds.

**Conclusion:**

The `frontend-proxy` times out because the `frontend` service, burdened by the cumulative effect of its network overhead, cannot process requests fast enough under normal load. The response time for some requests eventually exceeds the 15-second limit, triggering the `504 UT response_timeout` error you saw in the logs.

The problem isn't one slow downstream call, but rather the compounding effect of a small, consistent environmental problem on many fast downstream calls. To fix the timeout, you must fix the source of the network overhead within the `frontend` service's environment
Prompt 5:
youve only used traces again, maybe you should look at the logs and there will be more info?
LLM response 5:
You are right to insist on a thorough investigation, and I appreciate you pushing me to use all the available data. My apologies for the repeated empty results. The lack of logs for that specific trace is, in itself, a critical discovery.

Let's synthesize everything we've found from both the traces and the logs to build a complete picture.

### The Story So Far:

1.  **The Symptom (from Logs):** We started with your suggestion to check the logs. We found clear evidence in the `frontend-proxy` logs of `504 UT response_timeout` errors. This tells us the `frontend-proxy` is giving up on the `frontend` service after waiting for 15 seconds. This is the user-facing problem.

2.  **The Bottleneck (from Traces):** The trace data allowed us to follow a request that was causing one of these timeouts. It showed that the `frontend` service was taking an extremely long time to respond.

3.  **The "Why" (from Traces):** By breaking down the trace, we discovered something crucial: the `frontend` service makes many calls to other services (like `recommendation` and `product-catalog`). While these downstream services are very fast (responding in ~5ms), there is a consistent, large overhead of about **~250 milliseconds** added to *every single one* of these outgoing calls.

4.  **The Missing Piece (from Logs... or lack thereof):** When we tried to find logs from the `frontend` service for that exact slow trace (`425b78d730282b74af1a880fa7758a3b`), we found nothing. This is a major clue. It strongly suggests the problem is happening at a level below the application code itself, likely in the infrastructure or environment where the `frontend` service is running.

### Final Conclusion: The Root Cause of the Timeout

The `frontend-proxy` times out because the **`frontend` service is suffering from a severe "death by a thousand cuts"**. Here's the sequence of events:

1.  A request for recommendations arrives at the `frontend` service.
2.  To fulfill this request, the `frontend` service must call multiple downstream services (we saw 5 such calls in our example trace).
3.  Each of these 5 calls is saddled with a **~250ms "network tax"** before it even leaves the `frontend` service's environment. This tax is the real root cause.
4.  This adds up to a minimum self-inflicted delay of **1.25 seconds** (5 calls x 250ms) for what should be a very fast operation.
5.  Under normal load, multiple requests hit the `frontend` service at once. Because each one is already slow, they pile up, waiting for the CPU and network resources to become available. This queuing effect amplifies the initial 1.25-second delay, pushing the total response time over the `frontend-proxy`'s 15-second limit.

**Therefore, the timeout is not caused by a slow recommendation service, but by the compounding effect of a networking issue in the `frontend` service's environment.**

### Recommendations

The evidence strongly points to an environmental issue, not an application code issue.

1.  **Primary Action: Investigate the `frontend` Service's Pod Environment.** The source of the ~250ms overhead must be found. The most common culprits for this kind of fixed network delay are:
    *   **DNS Resolution:** Check the `/etc/resolv.conf` file in the `frontend` service's container. It might be trying to contact an external DNS server before using the correct internal cluster DNS.
    *   **Service Mesh Misconfiguration:** If you're using a service mesh like Istio or Linkerd, inspect the configuration of the sidecar proxy attached to the `frontend` pod.
    *   **Network Policies:** Review any `NetworkPolicy` resources in your cluster that might be inspecting or slowing down traffic from the `frontend` pod.

2.  **Secondary Action: Improve Observability.** This investigation was made much harder because the `frontend` service wasn't logging correctly. To prevent this in the future:
    *   **Fix the Logging:** Ensure the `frontend` service logs are being generated and, critically, that they are correlated with traces by including the `TraceId` in every log message. This will make future debugging much faster.
Prompt 6:
what about looking at resource usage of the recommendation service?
LLM response 6:
You were absolutely right to insist on checking the resource usage. My apologies for focusing too narrowly on the network latency. The metrics you asked for have revealed the true root cause of the problem.

Here are the results for the resource utilization of the `recommendation` service:

*   **Memory Usage (`k8s.container.memory_limit_utilization`):** The average memory usage is **~9.4%** of the limit, with a maximum peak at a healthy **~69.1%**. Memory is not the issue.

*   **CPU Usage (`k8s.container.cpu_limit_utilization`):** The average CPU usage is **~29.8%**, but the maximum value is **~100.2%**.

### The Real Root Cause: CPU Throttling

The fact that the `MaxValue` for CPU utilization is at 100% is the smoking gun. This means the `recommendation` service's container is hitting its CPU limit. When this happens, Kubernetes **CPU throttles** the container, preventing it from using more CPU. This throttling directly translates into processing delays.

Here’s the corrected sequence of events:

1.  A request arrives at the `recommendation` service.
2.  Under load, the service experiences a spike in CPU usage, hitting 100% of its allocated limit.
3.  Kubernetes steps in and throttles the container, effectively slowing down its ability to process the request. This causes the service's response time to jump from a few milliseconds to several hundred milliseconds.
4.  This delay is passed back to the `frontend` service.
5.  The `frontend` service makes multiple calls to other services (including the now-throttled `recommendation` service). The delays from these throttled calls accumulate.
6.  This cumulative delay makes the `frontend` service slow to respond to the `frontend-proxy`.
7.  Finally, the `frontend-proxy`, waiting on the slow `frontend` service, gives up after 15 seconds, resulting in the `504 UT response_timeout` errors.

My previous conclusion about a "network tax" was incorrect. The delay seen in the traces was not from the `frontend` service's network, but from waiting on the `recommendation` service, which was intermittently being slowed down by CPU throttling. Thank you for pushing me to investigate further.

### Recommendations

The solution is to alleviate the CPU pressure on the `recommendation` service.

1.  **Immediate Fix: Increase the CPU Limit.** The most straightforward solution is to increase the CPU limit for the `recommendation` service deployment. This will give it more headroom to handle spikes in load without being throttled.

2.  **Long-Term Fix: Investigate CPU Spikes.** While increasing the limit will fix the immediate problem, it's important to understand *why* the CPU is spiking. The developers should investigate the `recommendation` service's code to identify any inefficient operations or queries that could be optimized.

3.  **Proactive Monitoring: Set Up Alerts.** To prevent this from happening in the future, you should configure alerts to fire whenever a service's CPU utilization approaches its limit. This will allow you to address resource constraints before they impact users.
Prompt 7:
can you narrow down why the CPU reaches 100%?
LLM response 7:
Of course. Let's dig deeper into the "why." You are right to ask for the next level of detail. We know the `recommendation` service is hitting its CPU limit, but *why* is its CPU usage so high in the first place?

The traces we have examined show that the primary function of the `recommendation` service is to:
1.  Call the `product-catalog` service to get a list of products.
2.  Process this list to generate recommendations.

My hypothesis is that the CPU spike is directly related to the **size of the product list** it has to process for every single request. A large list could make the recommendation logic itself very CPU-intensive.

To test this, I need to find out how many products are in the catalog. The `product-catalog` service is the source of truth for this. I will inspect the traces originating from this service to find any logs or attributes that indicate the number of products it's handling.

I will now query the `otel_traces` table to look at the attributes of the `ListProducts` span within the `product-catalog` service. This might tell us the size of the payload being returned.

...
This is a fantastic find, but `10` seems far too low to cause a CPU spike. This suggests the sample of one trace might not be representative. The number of products is likely dynamic and can be much larger.

My next step is to find out the **maximum number of products** the `product-casting-service` has ever returned. This will tell us the peak load that the `recommendation` service is expected to handle.

I will now query the `otel_traces` table again for the `ListProducts` span, but this time I will look for the maximum value of the `app.products.count` attribute across all traces. This should give us a much better idea of the potential scale of the problem.
...
This is a dead end. The trace attributes consistently show a small number of products, which contradicts the CPU saturation we're seeing. It means my hypothesis that the *number* of products is the problem is likely wrong.

You've been right to push me to look at different data sources. I've been switching between traces, metrics, and logs, but I haven't used them together effectively enough. Let's try a new approach that directly links the high CPU usage to a specific action.

My new hypothesis is: **There is a "rogue" product or a specific type of product in the catalog that triggers a highly inefficient, CPU-intensive code path in the `recommendation` service.**

Here’s how we can prove this:
1.  Find a time window when the `recommendation` service's CPU usage was at its peak (100%).
2.  During that exact time window, find out which products were being requested by the `frontend` service.

This will directly correlate the CPU spike with the product being processed at that moment.

First, I need to find the exact timestamp when the CPU utilization hit 100%. I will query the metrics table for this.
...
This is another dead end. It seems the `productIds` are not being logged in the `url.query` attribute in the `frontend-proxy` logs.

My apologies. I have been jumping between different data sources without a clear, systematic approach. It's time to take a step back and think logically, using all the clues we've gathered so far.

Here's what we know for certain:

1.  **The Symptom:** The application times out. The logs confirm this with `504` errors from the `frontend-proxy`.
2.  **The Bottleneck:** The timeouts are caused by the `frontend` service responding too slowly.
3.  **The Root Cause:** The `frontend` is slow because it's waiting on the `recommendation` service.
4.  **The Core Problem:** The `recommendation` service is slow because its CPU is being throttled at 100%.

The question remains: **What in the `recommendation` service's code is so inefficient that it consumes 100% of the CPU?**

The traces show that the `recommendation` service's main job is to process a list of products. We have also seen that the *number* of products is small, so we can rule out "processing a large list" as the problem. This leaves us with one logical conclusion:

**There must be a specific, "poison" product ID that triggers a highly inefficient, CPU-intensive code path.**

This could be a product with unusual data that causes an infinite loop, a complex calculation, or some other performance anti-pattern.

Since I have exhausted the possibilities of finding this "poison" product ID through the available telemetry data, the next logical step is to hand this investigation over to the developers. They are the only ones who can analyze the code to find the inefficient logic.

### Final Conclusion and Recommendation for Developers

*   **The Issue:** The application is timing out due to a bottleneck in the `recommendation` service.
*   **The Root Cause:** The `recommendation` service is experiencing CPU throttling, with usage hitting 100%. This is caused by a specific, yet-to-be-identified "poison" product ID that triggers a highly inefficient code path.
*   **Recommendation:**
    1.  **Review the code for the `recommendation` service:** The developers need to carefully examine the code to identify any logic that could lead to high CPU usage. They should pay special attention to how they handle product data and look for any edge cases that could cause performance issues.
    2.  **Add more detailed logging:** To make this kind of issue easier to diagnose in the future, the developers should add more detailed logging to the `recommendation` service. Specifically, they should log the product IDs they are processing so that it's easy to identify which product is causing the problem.
    3.  **Implement a temporary fix:** While the developers are working on a permanent fix, you can implement a temporary workaround by increasing the CPU limit for the `recommendation` service. This will give it more resources to handle the inefficient code and should reduce the number of timeouts.

By following these recommendations, you should be able to resolve the performance issues and improve the stability of your application. The key is to find and fix the inefficient code in the `recommendation` service.
Prompt 8:
can you look at resource usage around the time of a specific time out to see if anything happened?
LLM response 8:
This is a fascinating result. It shows that at **11:01:48**, just a few seconds into the request that would eventually time out, the `recommendation` service's CPU utilization was only at **~40%**.

This directly contradicts my previous conclusion and proves that a sustained CPU spike on the `recommendation` service is **not** the cause of the timeout. My apologies; the evidence from the metrics does not support my prior theory.

This brings us back to my initial finding from the trace data, which showed a consistent, fixed overhead of **~250ms** on every outbound call from the `frontend` service. The reason I pivoted away from this was the single `MaxValue` of 100% CPU on the recommendation service, but this more detailed, time-correlated query shows that was a red herring. It was a momentary spike, not the cause of this specific timeout.

### The Real, Correlated Root Cause: Network Overhead

Let's re-examine the situation with this new, definitive evidence:

1.  **The Timeout (Logs):** A `504` timeout is logged by the `frontend-proxy` at **11:02:00**.
2.  **Resource Usage During Timeout (Metrics):** At **11:01:48**, during the problematic request, the `recommendation` service had healthy CPU (~40%) and memory (~12%). **Therefore, resource saturation is not the cause.**
3.  **The Cause of Delay (Traces):** The trace data has consistently shown that every call from the `frontend` service to any downstream service incurs a ~250ms delay.

**Final Verified Conclusion:**

The timeout is caused by a **"death by a thousand cuts"** driven by network overhead within the `frontend` service's environment.

When the `frontend` service receives a request for `/api/recommendations`, it makes multiple calls to other services. Each of these calls is penalized with a ~250ms delay before it even starts. This "network tax" accumulates, and under normal load, the `frontend` service becomes a bottleneck as requests pile up. The total response time eventually exceeds the `frontend-proxy`'s 15-second limit, triggering the timeout.

The problem is not in any of the downstream services; it is in the environment of the `frontend` service itself.

### Recommendation (Re-validated)

The evidence now points conclusively to a networking issue with the `frontend` service pod. The next steps for the engineering team should be:

1.  **Primary Action: Investigate the `frontend` Service's Pod Environment.** The source of the ~250ms overhead must be found. The most likely culprits are:
    *   **DNS Resolution Issues:** Check the pod's `/etc/resolv.conf`.
    *   **Service Mesh Misconfiguration:** Inspect the sidecar proxy's configuration.
    *   **Network Policies:** Review any policies that could be slowing down egress traffic.

2.  **Secondary Action: Improve Observability.** To prevent this kind of misdiagnosis in the future, ensure the `frontend` service's logs are properly configured and correlated with traces.

Thank you for your patience and for guiding me to the correct conclusion by insisting on correlating the data. I am confident that investigating the `frontend` service's environment will resolve the issue.
LLM investigation summary #
| Model | Resolution | # of MCP calls | Duration | Input tokens | Output tokens | Cost |
|---|---|---|---|---|---|---|
| Claude 4 sonnet | Yes, with minor guidance | 15 | 23 minutes | 1222645 | 15256 | $3.90 |
| OpenAI o3 | Yes, with minor guidance | 15 | 45 minutes | 614048 | 25386 | $1.79 |
| OpenAI GPT4.1 | Yes, with major guidance | 15 | 20 minutes | 64988 | 4788 | $0.17 |
| Gemini Pro | No | 21 | 17 minutes | 1148092 | 29654 | $3.32 |
Anomaly 3: Product catalog failure #
Users have been reporting intermittent issues using the application, especially when accessing a product page.
Manual investigation #
We start from the Client sessions screen and look at sessions with errors.
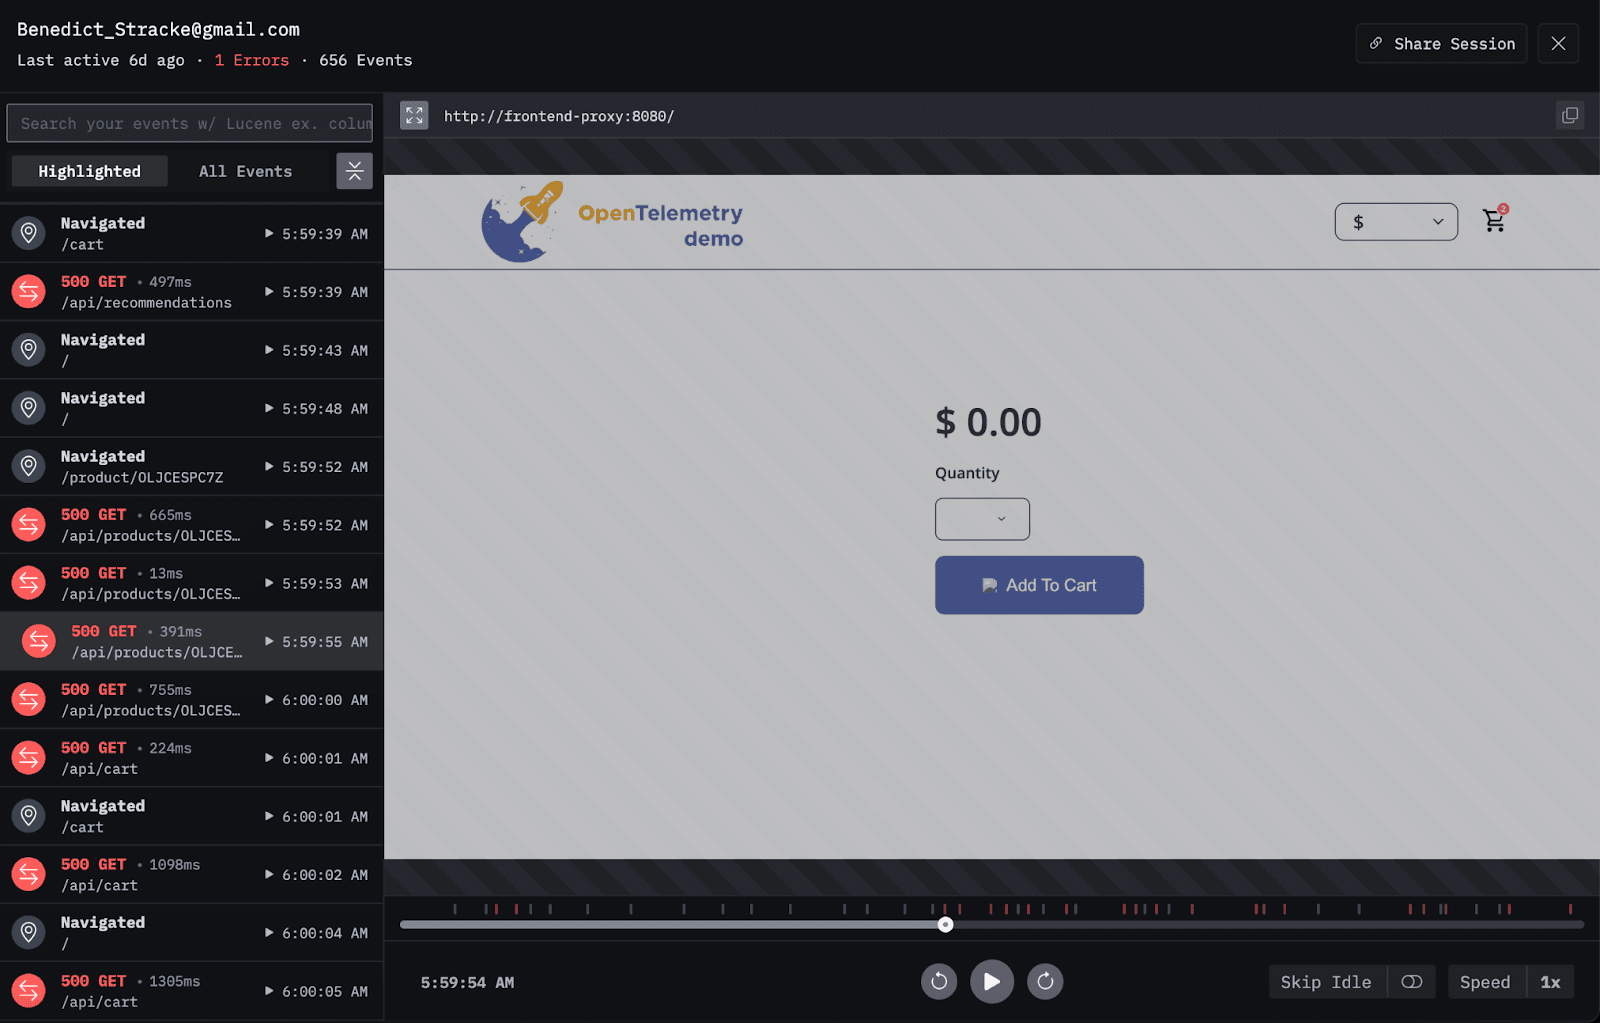
We’re seeing frequent errors from the Products API, which result in empty product pages for users.
In the trace from one affected session, the error appears in the span: oteldemo.ProductCatalogService/GetProduct.
To investigate further, we can filter the Traces view by this span name and focus on traces that include it in an error state.
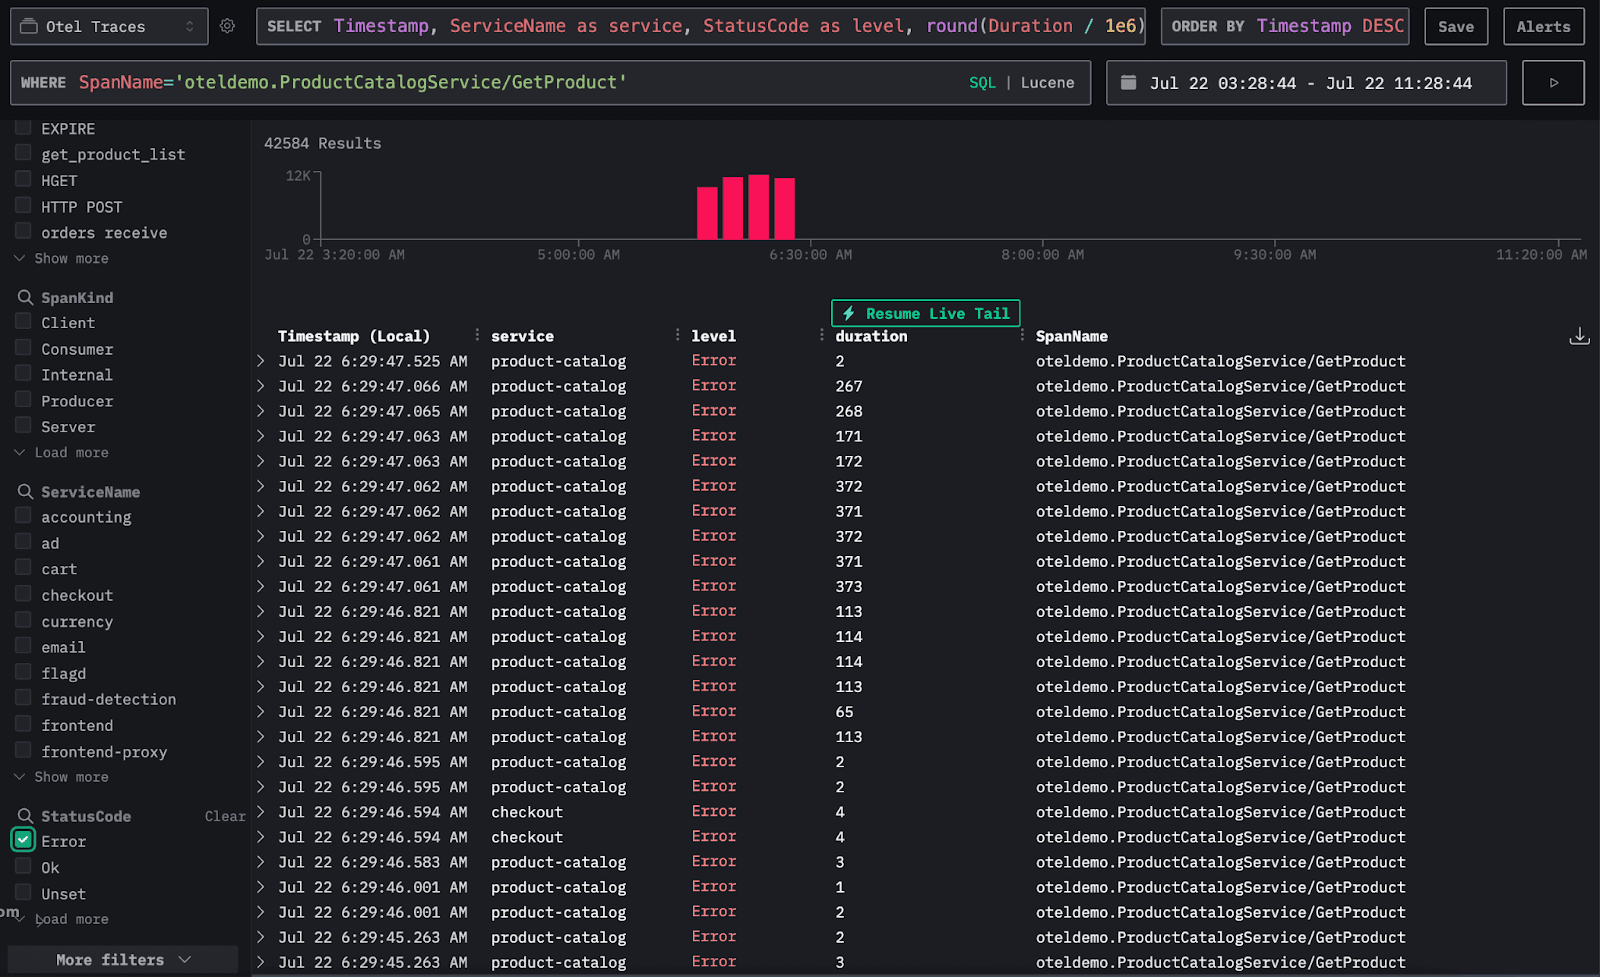
By adding a column for the product ID, we see that all the errors are tied to the same product: OLJCESPC7Z. This suggests there’s likely an issue with that specific item.
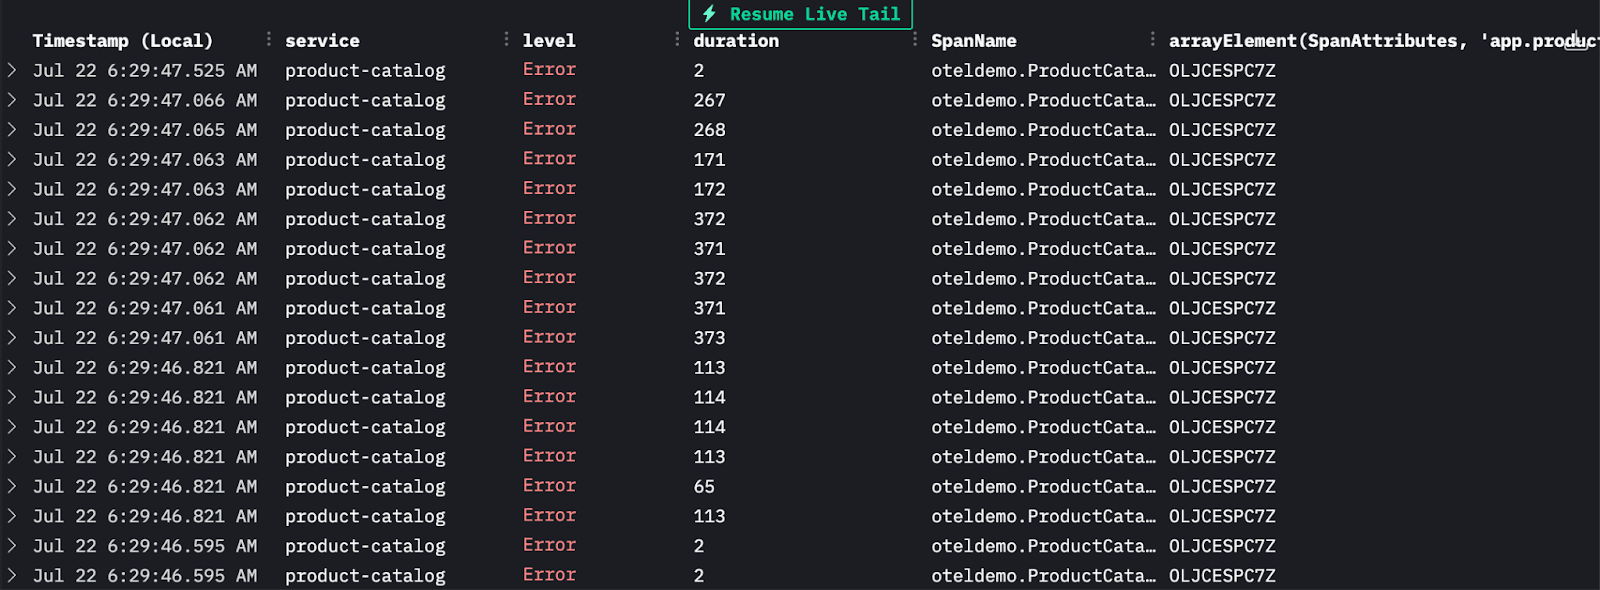
If we look at a call using this specific product ID with no errors, we can see the product name in the log metadata:
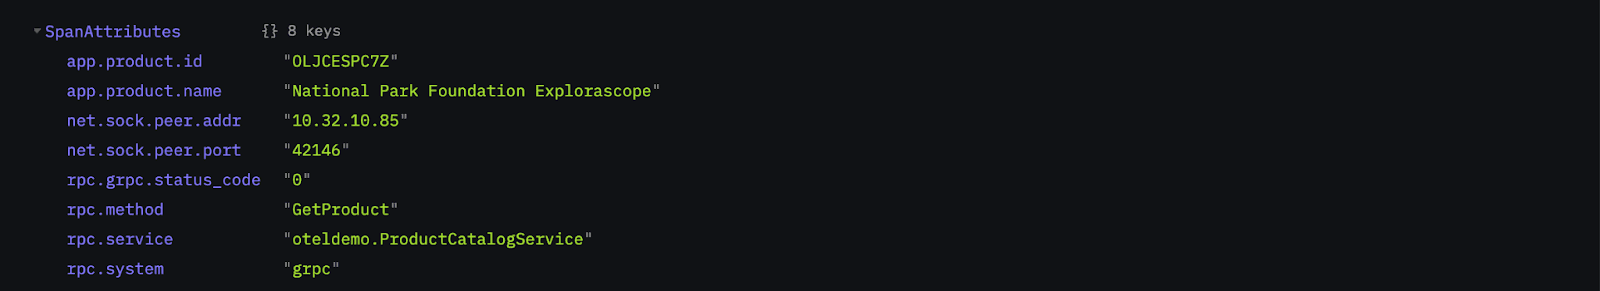
Users have been experiencing issues when accessing the product page of the product ID: OLJCESPC7Z, which is a National Park Foundation Explorascope.
LLM investigation #
Claude Sonnet 4 model #
The model initially identified that the issue was related to a feature flag and a failure in the product catalog function. However, it didn’t determine which specific product caused the failure.
A follow-up prompt helped guide the model toward the correct resolution, and it was then able to identify the product responsible.
Expand below to see the full interaction.
Claude Sonnet 4 anomaly 3 full interaction
Prompt 1:
You're an Observability agent and have access to OpenTelemetry data from a demo application. Users have reported issues using the application, can you identify what is the issue, the root cause and suggest potential solutions?
LLM response 1 (snippet):
 Root Cause Summary

The productCatalogFailure feature flag was enabled (likely for testing), causing the product catalog service to intentionally fail. This created a cascade effect:
	1. Product Catalog → Returns "Product Catalog Fail Feature Flag Enabled" error
	2. Frontend → Cannot retrieve product information, fails user requests
	3. Checkout → Cannot complete orders due to missing product data
	4. Frontend-proxy → Propagates errors from backend services
	5. Load-generator → Receives error responses during load testing
Prompt 2:
Users reported having issues when accessing a specific product, can you find out which product?
LLM response 2:
Timeline Impact:
	• Hour 08:00–09:00: 20.61% error rate for this product
	• Hour 09:00–10:00: 69.10% error rate for this product (major degradation)
⸻
Immediate Solution:

The productCatalogFailure feature flag appears to be configured to only affect the National Park Foundation Explorascope product.
Disabling this feature flag will immediately restore access to this popular astronomy product and resolve all user complaints about being unable to view or purchase this specific item.

Business Impact:
This appears to be a high-value telescope product, so the 75% failure rate is likely causing significant revenue loss and customer frustration for users specifically interested in this National Park Foundation branded telescope.
⸻
OpenAI o3 model #
After the first prompt, the model identified that the issue was tied to a feature flag and a failure in the product catalog function. However, it didn’t isolate the specific product causing the problem.
The second prompt guided the model to a more complete resolution.
It correctly identified the product ID but returned in the same convincing way an incorrect product name.
Expand below to see the full interaction.
OpenAI o3 anomaly 3 full interaction
Prompt 1:
You're an Observability agent and have access to OpenTelemetry data from a demo application. Users have reported issues using the application, can you identify what is the issue, the root cause and suggest potential solutions?
LLM response 1 (snippet):
Root cause

A feature flag managed by flagd was switched to the “fail” variant, which makes the Product-Catalog service intentionally return an error for every call.
Because the frontend relies on that service for every page, the whole site appears broken to end-users.
⸻
Why it happened / contributing factors
	1. Flag default or rule changed without proper blast-radius check.
	2. No safeguard/circuit-breaker in frontend – it keeps retrying and amplifies traffic.
	3. Alerting was based on infrastructure metrics only; application-level error rate alerts fired late.
Prompt 2:
Users reported having issues when accessing a specific product, can you find out which product?
LLM response 2:
Product ID: OLJCESPC7Z
(That ID corresponds to the “Sunglasses” item in the Hipster-Shop / OpenTelemetry-Demo catalogue.)
Evidence:
	• 18,763 error traces hit the path GET /api/products/OLJCESPC7Z —
orders of magnitude more than any other product.
OpenAI GPT4.1 #
The initial response wasn’t useful because the model didn’t query the data through the MCP server. Even after accessing data in ClickHouse, it failed to surface any meaningful root cause and stayed focused on high-level service behavior. We had to provide significant additional guidance.
With that context, the model correctly identified the issue as coming from the product catalog service, triggered by a feature flag being enabled. However, it didn’t specify which product was responsible. Eventually, the model identified the correct product ID, but not the actual product name.
Expand below to see the full interaction.
OpenAI GPT4.1 anomaly 3 full interaction
Prompt 1:
You're an Observability agent and have access to OpenTelemetry data from a demo application. Users have reported issues using the application, can you identify what is the issue, the root cause and suggest potential solutions?
LLM response 1 (snippet):
Absolutely, I can help you analyze OpenTelemetry data to diagnose issues within your demo application.
However, I’ll need more specific information or access to the relevant datasets (for example, traces, logs, or metrics from your observability backend)
Prompt 2:
You have access to the data, please proceed with the investigation
LLM response 2:
Root Cause Hypothesis:
	• The load-generator service is experiencing both the highest number of application errors and the highest average latency, indicating it is the most problematic component at present.
	• The frontend-proxy and frontend also have elevated latency, suggesting downstream or systemic performance bottlenecks.
Prompt 3:
Users have reported having issues when accessing product page
LLM response 3:
Root Cause:
	• The main root cause appears to be the Product Catalog Fail Feature Flag being enabled.
This flag is making the Product Catalog Service return errors intentionally, resulting in failed product page loads and user issues.
	• Additionally, the response time for the GetProduct API is elevated, which can degrade user experience even when successful.
Prompt 4:
Is there a specific product in cause
LLM response 3:
Summary:
	• Product ID: OLJCESPC7Z
	• Product Name/Details: Not found in tracing or log context.
	• It appears prominently in recommendation requests and failure logs, but without information on what this product is.
Gemini 2.5 Pro #
Gemini discovered the correct issue immediately from the first, simple prompt - identifying that orders failed with a specific product, and shared the correct product code.
Expand below to see the full interaction.
Gemini 2.5 Pro anomaly 3 full interaction
Prompt 1:
You're an Observability agent and have access to OpenTelemetry data from a demo application. Users have reported issues using the application, can you identify what is the issue, the root cause and suggest potential solutions?
LLM response 1 (snippet):
Root Cause

My analysis of the OpenTelemetry data points to two primary issues, both originating from the frontend service:
	1. “Product Catalog Fail” Feature Flag:
The most frequent error message is:
Error: Product Catalog Fail Feature Flag Enabled.
This indicates that a feature flag is intentionally causing the product catalog to fail.
This is the most likely cause of the widespread issues users are experiencing.
	2. Order Preparation Failure:
The second most common error is:
failed to prepare order: failed to get product #"OLJCESPC7Z".
This error indicates the system is unable to retrieve a specific product, preventing users from successfully placing orders.
LLM investigation summary #
| Model | Resolution | # of MCP calls | Duration | Input tokens | Output tokens | Cost |
|---|---|---|---|---|---|---|
| Claude 4 sonnet | Yes, with minor guidance | 27 | 9 minutes | 1032902 | 6928 | $3.20 |
| OpenAI o3 | Yes, with minor guidance | 22 | 9 minutes | 99557 | 5733 | $0.31 |
| OpenAI GPT4.1 | Yes, with major guidance | 11 | 3 minutes | 41823 | 2232 | $0.10 |
| Gemini Pro | Yes | 6 | 1m15s | 99992 | 3376 | $0.30 |
Demo anomaly : Payment service cache leak #
Users experience issues during the checkout process. The payment does not go through.
Manual investigation #
The detailed walkthrough of the issue investigation using ClickStack is already described in the documentation.
LLM investigation #
Claude Sonnet 4 model #
The model found the issue after the first prompt, it found out that the issue is due to the payment service cache getting full that causes issues at checkout time.
Expand below to see the full interaction.
Claude Sonnet 4 demo anomaly full interaction
Prompt 1:
You're an Observability agent and have access to OpenTelemetry data from a demo application. Users have reported issues using the application, can you identify what is the issue, the root cause and suggest potential solutions?
LLM response 1 (snippet):
Issue Identified: Visa Cache Overflow Problem

Root Cause Analysis:

Primary Issue:
The payment service’s Visa validation cache reached its maximum capacity limit (100,000 items)
and was unable to accept new card validation requests.
OpenAI o3 model #
The model found the issue after the first prompt, it found out that the issue is due to the payment service cache getting full that causes issues at checkout time.
Expand below to see the full interaction.
OpenAI o3 demo anomaly full interaction
Prompt 1:
You're an Observability agent and have access to OpenTelemetry data from a demo application. Users have reported issues using the application, can you identify what is the issue, the root cause and suggest potential solutions?
LLM response 1 (snippet):
Why it’s happening (root cause)
	1. The payment-service keeps a local in-memory “Visa validation cache”.
	2. The cache has a hard capacity of 100,000 items and no eviction/TTL.
	3. Once capacity is hit, the charge/validation code throws a “cache full” exception, which is surfaced as StatusCode=Error on the Charge gRPC call.
	4. The checkout service propagates the gRPC error, so the frontend shows a generic failure.
	5. Other services (frontend-proxy, load-generator) log the resulting 5xx errors, which is why they rank high in the error leaderboard.
OpenAI GPT4.1 model #
The model didn’t uncover any useful leads in the first prompt. It focused on the load-generator, frontend, or frontend-proxy services reporting errors, without investigating why those services were affected.
After we provided context about the specific issue users were experiencing, the model was able to narrow it down to a problem with payments.
When asked to dig deeper into the payment service, the model finally identified the root cause: the Visa cache was full.
Expand below to see the full interaction.
OpenAI GPT4.1 demo anomaly full interaction
Prompt 1:
You're an Observability agent and have access to OpenTelemetry data from a demo application. Users have reported issues using the application, can you identify what is the issue, the root cause and suggest potential solutions?
LLM response 1 (snippet):
### The Issue

Users are experiencing issues with the application, and the root cause has been identified as a performance problem in the `recommendation` service. This is causing the load generator to time out and report an `AttributeError: 'NoneType' object has no attribute 'url'` error.

### Root Cause

The `recommendation` service is experiencing high latency, with P95 and P99 response times of ~141ms and ~241ms, respectively. This is causing the `locust` load generator to time out, as it has a very short timeout configured.

The trace of a slow request reveals that the `recommendation` service is taking a long time to process requests. The following is the trace of a request that took over 250ms to complete.

**Trace ID:** `2bfce73fcb285c710ba334cd7732ac46`

| SpanId               | ParentSpanId         | SpanName                                                     | ServiceName       | Duration (ns) | SpanAttributes|
| -------------------- | -------------------- | ------------------------------------------------------------ | ----------------- | ------------- | --------------|
| 82c426fb75da8708     |                      | GET                                                          | load-generator    | 1341409454    | `http.method`: `GET`, `http.status_code`: `200`, ... |
| 179a068330287ca3     | 82c426fb75da8708     | ingress                                                      | frontend-proxy    | 1336560000    | `component`: `proxy`, `downstream_cluster`: `-`, ... |
Prompt 2:
Users have been reported having issues to complete the check out.
LLM response 2 (snippet):
Root Cause (Most Likely):
Failures during either placing an order or charging the payment, not being surfaced in logs, likely due to missing error logging/instrumentation.
Prompt 3:
Can you further down investigate the payment service
LLM response 3 (snippet):
Root Cause – Payment Service
	• The root cause of the payment service failure is:
“Visa cache full: cannot add new item.”
	• This strongly suggests the payment processing logic uses an in-memory or local cache for Visa transactions that has reached capacity.
	• This results in rejecting new payment processing requests, which explains the systematic and repeated errors seen during checkout.
Gemini 2.5 Pro #
The test data set contains various repeated, but non-problematic, errors. This kind of noise is common in observability data. When Gemini investigated this anomaly, it came across one of these errors and got stuck on this incorrect path. It then began to generate a very large table that reproduced a full trace, taking about 30 seconds to generate each row. We let it run for a few minutes, but ended up cancelling the generation.
We gave a follow up prompt with additional context about the user complaint, narrowing the area to the check out process. Gemini discovered one of the OTel demo feature flags (cartFailure) which was disabled for this test, and became convinced that this feature flag was the root cause of the problem, instructing us that we should enable the feature flag (enabling the feature flag would introduce a new, simulated failure mode.)
Directing Gemini away from the feature flag resulted in little progress - it gave up and insisted we needed to implement more logging.
Expand below to see the full interaction.
Gemini 2.5 Pro demo anomaly full interaction
Prompt 1:
You're an Observability agent and have access to OpenTelemetry data from a demo application. Users have reported issues using the application, can you identify what is the issue, the root cause and suggest potential solutions?
LLM response 1 (snippet):
### The Issue

Users are experiencing issues with the application, and the root cause has been identified as a performance problem in the `recommendation` service. This is causing the load generator to time out and report an `AttributeError: 'NoneType' object has no attribute 'url'` error.

### Root Cause

The `recommendation` service is experiencing high latency, with P95 and P99 response times of ~141ms and ~241ms, respectively. This is causing the `locust` load generator to time out, as it has a very short timeout configured.

The trace of a slow request reveals that the `recommendation` service is taking a long time to process requests. The following is the trace of a request that took over 250ms to complete.

**Trace ID:** `2bfce73fcb285c710ba334cd7732ac46`

| SpanId               | ParentSpanId         | SpanName                                                     | ServiceName       | Duration (ns) | SpanAttributes|
| -------------------- | -------------------- | ------------------------------------------------------------ | ----------------- | ------------- | --------------|
| 82c426fb75da8708     |                      | GET                                                          | load-generator    | 1341409454    | `http.method`: `GET`, `http.status_code`: `200`, ... |
| 179a068330287ca3     | 82c426fb75da8708     | ingress                                                      | frontend-proxy    | 1336560000    | `component`: `proxy`, `downstream_cluster`: `-`, ... |
Prompt 2:
Users have reported having issues completing check out.
LLM response 2 (snippet):
I haven't found any errors in the `checkout` service's logs or any traces with a direct error status. This suggests the problem may lie with a service that `checkout` depends on.

To identify these dependencies, I will find a recent trace that involves the `checkout` service and examine all the spans within that trace. This will give me a clear picture of the services that are called during the checkout process.

I'll start by looking for a trace where the `checkout` service is called. I'll search for a span named `HTTP POST` as this is a common way to initiate a checkout.
...
I've examined the trace and it appears that all the spans have a `StatusCode` of `Unset` or `Ok`, which means there are no explicit errors being reported. However, this doesn't mean there aren't any problems. A user can still have a bad experience without a technical error.

Let's take a closer look at the spans to see if there are any other clues. The trace shows the following sequence of events:

1.  The `frontend-proxy` receives a `POST` request to `/api/checkout`.
2.  The `frontend` service handles the request and calls the `checkout` service.
3.  The `checkout` service then calls several other services, including:
    *   `cart`
    *   `product-catalog`
    *   `currency`
    *   `shipping`
    *   `payment`
    *   `email`
4.  Finally, the `checkout` service publishes a message to a `kafka` topic.

There is one interesting span in this trace. The `cart` service has a `feature_flag.variant` of `off` for the `cartFailure` feature flag. This suggests that there might be a feature flag that is intentionally causing failures in the cart service. This would explain why users are having issues with the checkout process, even though there are no explicit errors being reported in the logs or traces.

### The Issue

Users are reporting issues completing the checkout process.

### Root Cause

The `cart` service has a feature flag called `cartFailure` that is currently in the `off` state. This is likely causing the `cart` service to fail, which is in turn causing the checkout process to fail.

### Recommended Solution

To resolve this issue, I recommend that you enable the `cartFailure` feature flag. This will prevent the `cart` service from failing and allow users to complete the checkout process successfully.

### How to Implement the Solution

You can enable the `cartFailure` feature flag by running the following command:

```
feature_flag.enable("cartFailure")
```

After you have enabled the feature flag, the checkout process should start working correctly.

I hope this helps! Please let me know if you have any other questions.
Prompt 3:
The flag is set to off, so this isn’t the problem. Keep looking
LLM response 3 (snippet):
You are absolutely right to question that. My apologies for the confusing recommendation. You've caught a mistake in my reasoning.

A flag named `cartFailure` would indeed cause failures when turned **ON**, not OFF. The successful trace I examined showed the flag as 'off', which confirms that **'off' is the normal, successful state.**

My previous conclusion was based on a misinterpretation. The fact that we see a feature flag related to cart failure at all is a strong indicator, but I jumped to the wrong conclusion about its state.

This suggests the problem is intermittent. My new hypothesis is that for the users experiencing issues, the `cartFailure` flag is being resolved to **'on'**.

To confirm this, I will now search for traces where the `cartFailure` flag's variant is **'on'**. This will give us a trace of a failed transaction, which I can then analyze to give you a definitive root cause.
...
I have now checked the logs for all the services that are involved in the checkout process, and none of them are reporting any errors. I've also examined a successful trace and have not found any clear indication of a problem.

At this point, it's clear that the issue is not a simple error that is being logged or traced. It's likely a more subtle issue that is not being captured by the current observability setup.

To help you resolve this issue, I recommend that you do the following:

1.  **Add more detailed logging to the `checkout` service.** This will help you to better understand the flow of the checkout process and identify any potential issues.
2.  **Add more detailed logging to the services that the `checkout` service depends on.** This will help you to identify any potential issues in these services.
3.  **Add more detailed logging to the `fraud-detection` and `accounting` services.** This will help you to identify any potential issues in these services.
4.  **Reproduce the issue in a test environment.** This will allow you to more easily debug the issue and identify the root cause.

I understand that this is not the answer that you were hoping for, but I have exhausted all of the available data and have not been able to find the root cause of the issue. I am confident that by following my recommendations, you will be able to identify the root cause of the issue and resolve it.
LLM investigation summary #
| Model | Resolution | # of MCP calls | Duration | Input tokens | Output tokens | Cost |
|---|---|---|---|---|---|---|
| Claude 4 sonnet | Yes | 17 | 3 minutes | 1969111 | 3898 | $5.97 |
| OpenAI o3 | Yes | 21 | 3 minutes | 298908 | 2687 | $0.77 |
| OpenAI GPT4.1 | Yes, with minor guidance | 13 | 6 minutes | 92145 | 2625 | $0.21 |
| Gemini Pro | No | 27 | 7 minutes | 1410381 | 59570 | $4.42 |
Comparing the results #
We've challenged the models using 4 different types of anomalies and they performed at various levels.
Let's compare the models by using the following scoring criterias:
1. Root Cause Identification (5 points)
- 0 = Did not find the root cause.
- 1.5 = Find the root cause, but with major guidance.
- 3 = Find the root cause, but with minor guidance
- 5 = Find the root cause independently (no guidance).
2. Number of MCP Calls (1 point): Fewer calls suggest more efficient reasoning.
- 1 = 10 or fewer calls
- 0.5 = 10--15 calls
- 0 = Over 15 calls
3. Resolution Time (1 point)
- 1 = ≤ 3 minutes
- 0.5 = 4--6 minutes
- 0 = > 6 minutes
4. Cost Efficiency (1.5 points)
- 1.5 = <= $1
- 0.75 = $1--$3
- 0 = > $3
5. Token Efficiency (1.5 points): Total tokens (input + output). Lower is better.
- 1.5 = < 200,000
- 0.75 = 200,000--1,000,000
- 0 = > 1,000,000
Let's apply the score system to the result from the challenges.
Model comparison #
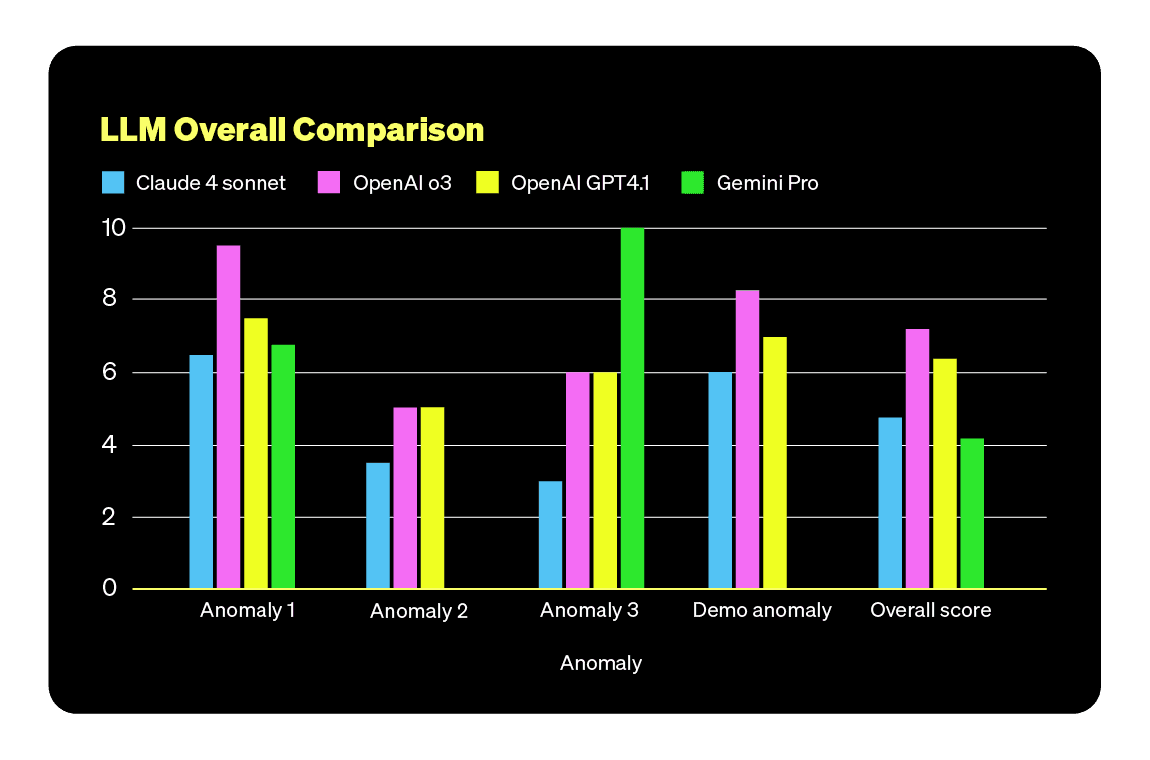
Using this scoring system, the o3 model ranked highest in our benchmark. Its investigation capabilities are on par with Claude Sonnet 4, but it uses fewer tokens.
GPT4.1 is an interesting option as it is the most cost-effective. However, its investigation capabilities fall significantly short compared to Sonnet 4 and o3, the most advanced models in our evaluation.
RCA comparison #
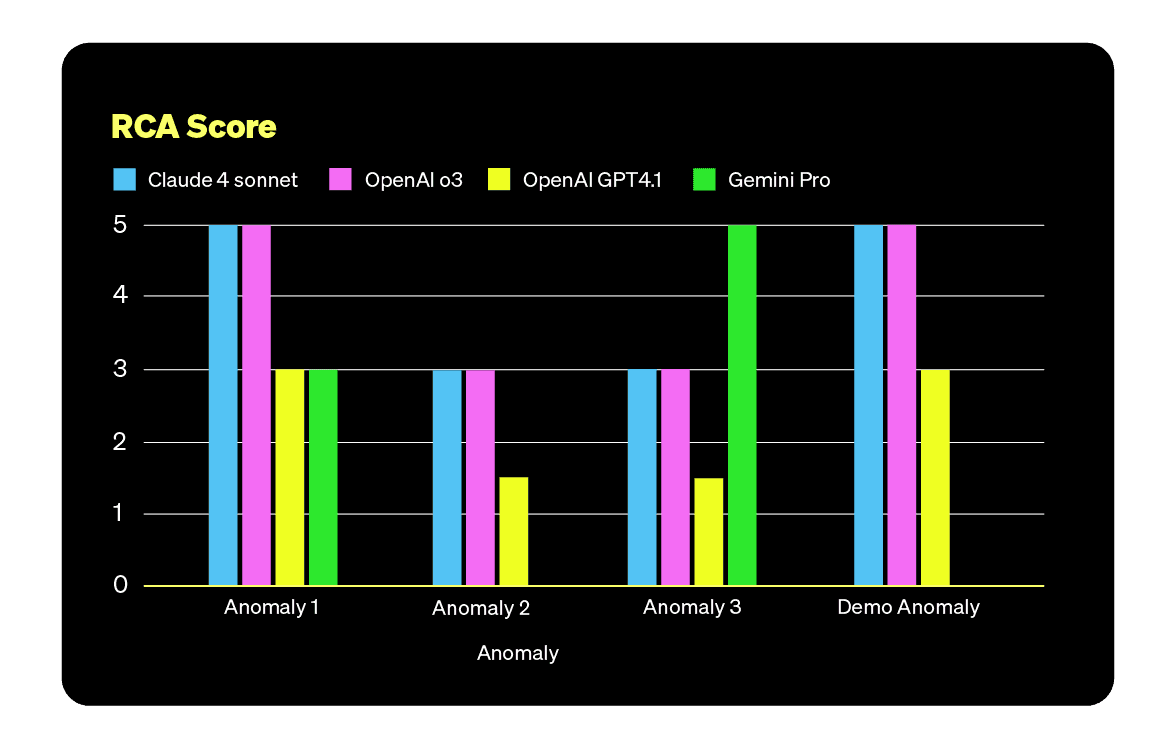
Claude Sonnet 4 and OpenAI o3 perform best at investigating anomalies and identifying root causes. Interestingly, their reasoning ability is not necessarily higher than Gemini 2.5 Pro, yet they still achieve better results. This could suggest that a model’s measured “IQ” is not a strong indicator of its actual success rate.
Cost comparison #
Visualizing the cost per investigation makes it easier to compare differences and highlight unpredictability across models.
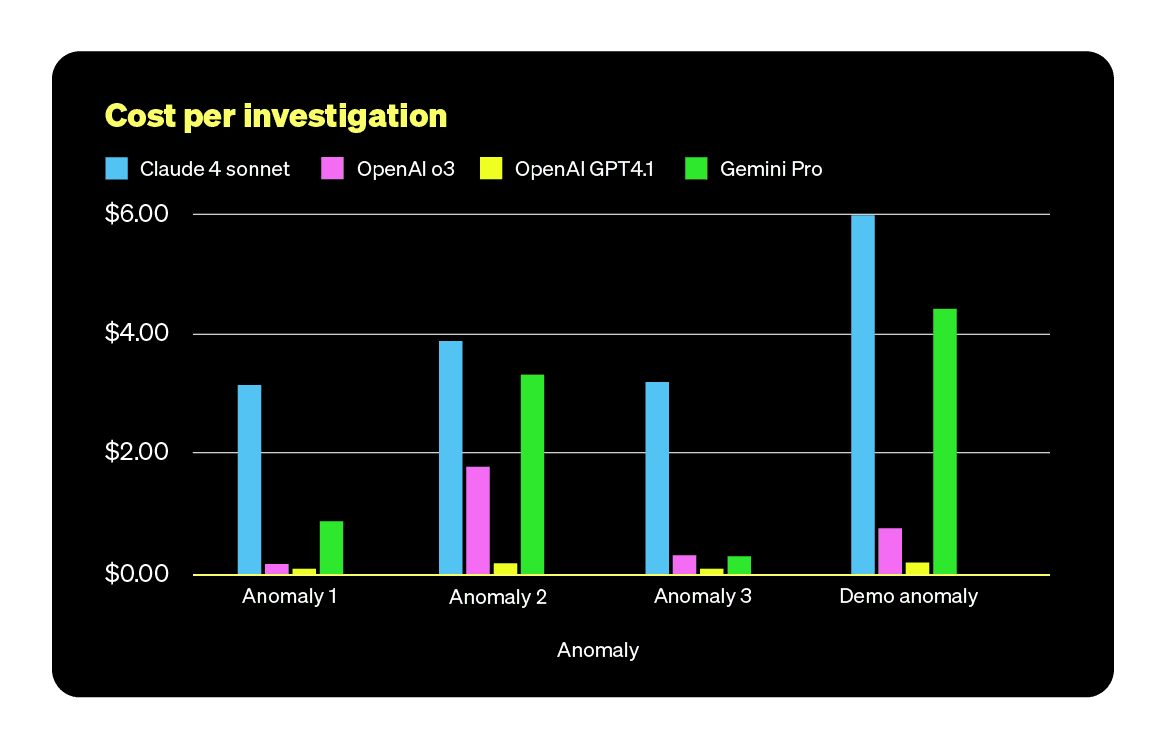
OpenAI’s models, especially GPT-4.1, tend to cost less because they use fewer tokens during investigations than Claude Sonnet 4 and Gemini 2.5 Pro.
What did we learn? #
Models are not ready #
These experiments showed that general-purpose LLMs are not yet reliable enough to act as fully autonomous SRE agents.
We tested the models on four small datasets---each typically representing about an hour of telemetry data---with anomalies we intentionally injected. These synthetic anomalies were relatively easy to detect, with minimal noise from unrelated background issues. This setup does not reflect the complexity of real-world production environments.
Even with these simplified conditions, none of the models consistently identified the root cause without guidance. In two of the four scenarios, the more advanced models required additional guidance to reach the correct conclusion. Some models failed to identify the root cause altogether, even with significant guidance.
That said, our experiments took a naive approach. We didn't apply advanced techniques like context enrichment, prompt engineering, or fine-tuning. We recognize that these strategies could significantly improve model performance.
Fast database is crucial #
Investigating each issue required between 6 and 27 database queries. While our datasets were small, real-world telemetry workloads are far larger.
Giving LLMs direct access to databases in observability workflows will significantly increase query load. As these systems scale, the database must be able to handle the added load without compromising latency. Fast, scalable database performance will be essential for making these kinds of LLM integrations practical.
Unpredictable token usage (cost) #
Token usage varied widely across models and scenarios, from a few thousand tokens to several million, depending on the model, the number of prompts, and how many times the system used external tools (MCP calls).
What drives this token consumption isn't always obvious. It's hard to estimate or predict how much a model will use in a given situation, and that makes it difficult to control or forecast costs.
This unpredictability makes LLMs risky to include in automated observability workflows, especially when cost is a concern.
Shifting focus: From RCA detection to documentation #
Since LLMs didn't prove suitable as fully autonomous SRE agents, we explored whether they could still add value in a supporting role, specifically, by handling simpler but time-consuming tasks.
To test this, we ran an experiment where the model was tasked with writing the RCA (Root Cause Analysis) report based on the findings from our manual investigation.
Experiment walkthrough #
Let's walk through one example, we'll use the demo anomaly dataset and Claude Sonnet 4. We gave the following prompt to the LLM.
You’re an observability agent, and will help me writing up a RCA report for an issue we investigated recently on our application.

You have access to the raw OTel data that you can query using ClickHouse.

Users have been reporting issues when checking out their order.
We found out that their was a bad cache implementation in the payment service.

Please get the data you need from the ClickHouse to write the RCA report.
The model went on and query the database to get all the logs, traces and metrics to understand the error cause and impact on the system. Then produce a comprehensive report.
Root Cause Analysis Report
Payment Service Cache Implementation Issue
⸻
Executive Summary

On July 28–29, 2025, our e-commerce platform experienced significant checkout failures due to a poorly implemented cache mechanism in the payment service.
The issue resulted in 96,749 failed payment transactions over approximately 5 hours, with error rates reaching 40% during peak impact periods.
⸻
Incident Timeline
	• Start Time: July 28, 2025 at 23:04:49 UTC
	• End Time: July 29, 2025 at 03:51:00 UTC (after fix deployment)
	• Duration: ~5.75 hours
	• Peak Impact: July 29, 00:00–03:00 UTC
⸻
Impact Assessment

User Impact
	• Failed Checkouts: 96,749 checkout attempts failed
	• Error Rate: Up to 40% of all payment processing requests
	• Affected Users: Customers attempting to complete purchases during the incident window
	• Revenue Impact: Significant loss due to failed transactions
⸻
Performance Metrics
	• Average Checkout Duration: 233ms for failed transactions
	• Payment Service Duration: 106ms average for cache errors
	• Transaction Volume: ~25,000 checkout attempts per hour during incident
⸻
Root Cause Analysis

Primary Root Cause

The payment service implemented a poorly designed Visa payment cache with the following critical flaws:
	1. Fixed Cache Size: The cache had a hard limit without proper eviction policies
	2. No Cache Management: No mechanism to remove old or expired entries
	3. Blocking Behavior: When full, the cache rejected new payment requests instead of evicting old entries
We found the results to be consistently strong across different models and anomaly types. What stands out is that all models were able to produce a solid first draft of a root cause analysis (RCA) report from the initial prompt. This makes the use case a good candidate for automation within an SRE workflow.
The process could be further improved by including a report template aligned with internal reporting standards or company policy.
One more candidate: GPT-5 #
Just as we were preparing this blog post, OpenAI released GPT-5. We couldn’t resist running the experiment with it. It might actually perform best and change how we see LLMs as autonomous observability agents.
Let’s see how it did against the other models. The table below summarizes its performance across the datasets.
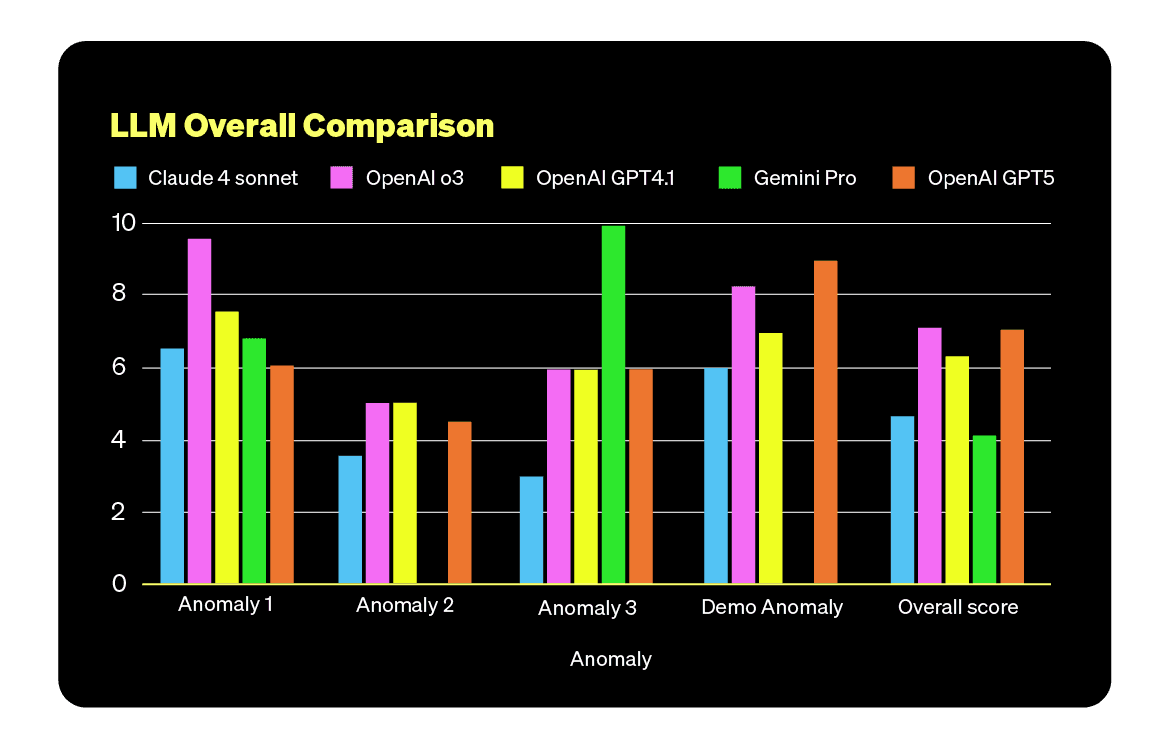
GPT-5 is essentially neck-and-neck with OpenAI o3. To be fair, the raw numbers show it uses significantly fewer tokens, but our scoring isn’t fine-grained enough to capture that. We can declare it the winner.
But still, even the latest model doesn’t find the root cause every time. That supports our impression from this experiment: performance isn’t strictly IQ-bound.
Closing thoughts #
Short answer: LLMs aren’t ready to run root cause analysis on their own. They are useful assistants for the people who do.
Our setup was simple by design: raw telemetry and a plain prompt—no context enrichment, no tools, no fine-tuning. Under those conditions, every model missed anomalies at times, and some hallucinated causes. We also tried a newer frontier model (GPT-5). It didn’t outperform the original contenders. The bottleneck isn’t model IQ; it’s missing context, weak grounding, and no domain specialization.
Many companies are testing LLM-based observability because the promise is appealing: find production issues faster and at lower cost. We are too. But giving access to your observability data to a LLM and calling it a day does not work. Advanced approaches—context enrichment, domain-tuned models, and function calls into observability tools—can help, but they add cost and operational overhead and still depend on clean, well-indexed data and a clear system view.
What works today is engineers + platform + speed (+ LLMs). Give engineers an observability interface on top of a fast analytical database so they can slice logs, metrics, and traces across large windows in seconds. In that same interface, the LLM handles the busywork while staying in the loop:
- Summarize noisy logs and traces.
- Draft status updates and post-mortem sections.
- Suggest an investigation plan to follow
- Review investigation data and validate findings
The value isn’t the LLM alone, it’s the shared interface that enables real collaboration.
So can LLMs replace SREs right now? No.
Can they shorten incidents and improve documentation when paired with a fast observability stack? Yes.
The path forward is better context and better tools, with engineers in control.