ClickStack has taken off - and like all things ClickHouse, fast. Since launch, the open source stack has been embraced by teams looking to replace fragmented, expensive observability stacks with something faster, simpler, and more open.
Today, we’re making that journey even easier: ClickStack is now available in ClickHouse Cloud, in Private Preview - fully integrated and ready to launch with a single click.
ClickStack in ClickHouse Cloud #
Earlier this year, we announced the acquisition of HyperDX - a ClickHouse native UI for observability - and followed that with the launch of ClickStack, our high performance, OpenTelemetry-native observability stack built on ClickHouse.
ClickStack delivers a complete, out-of-the-box experience for logs, metrics, traces, and session replay - powered by the performance and efficiency of ClickHouse, but designed as a full observability stack that’s open, accessible, and ready for everyone.
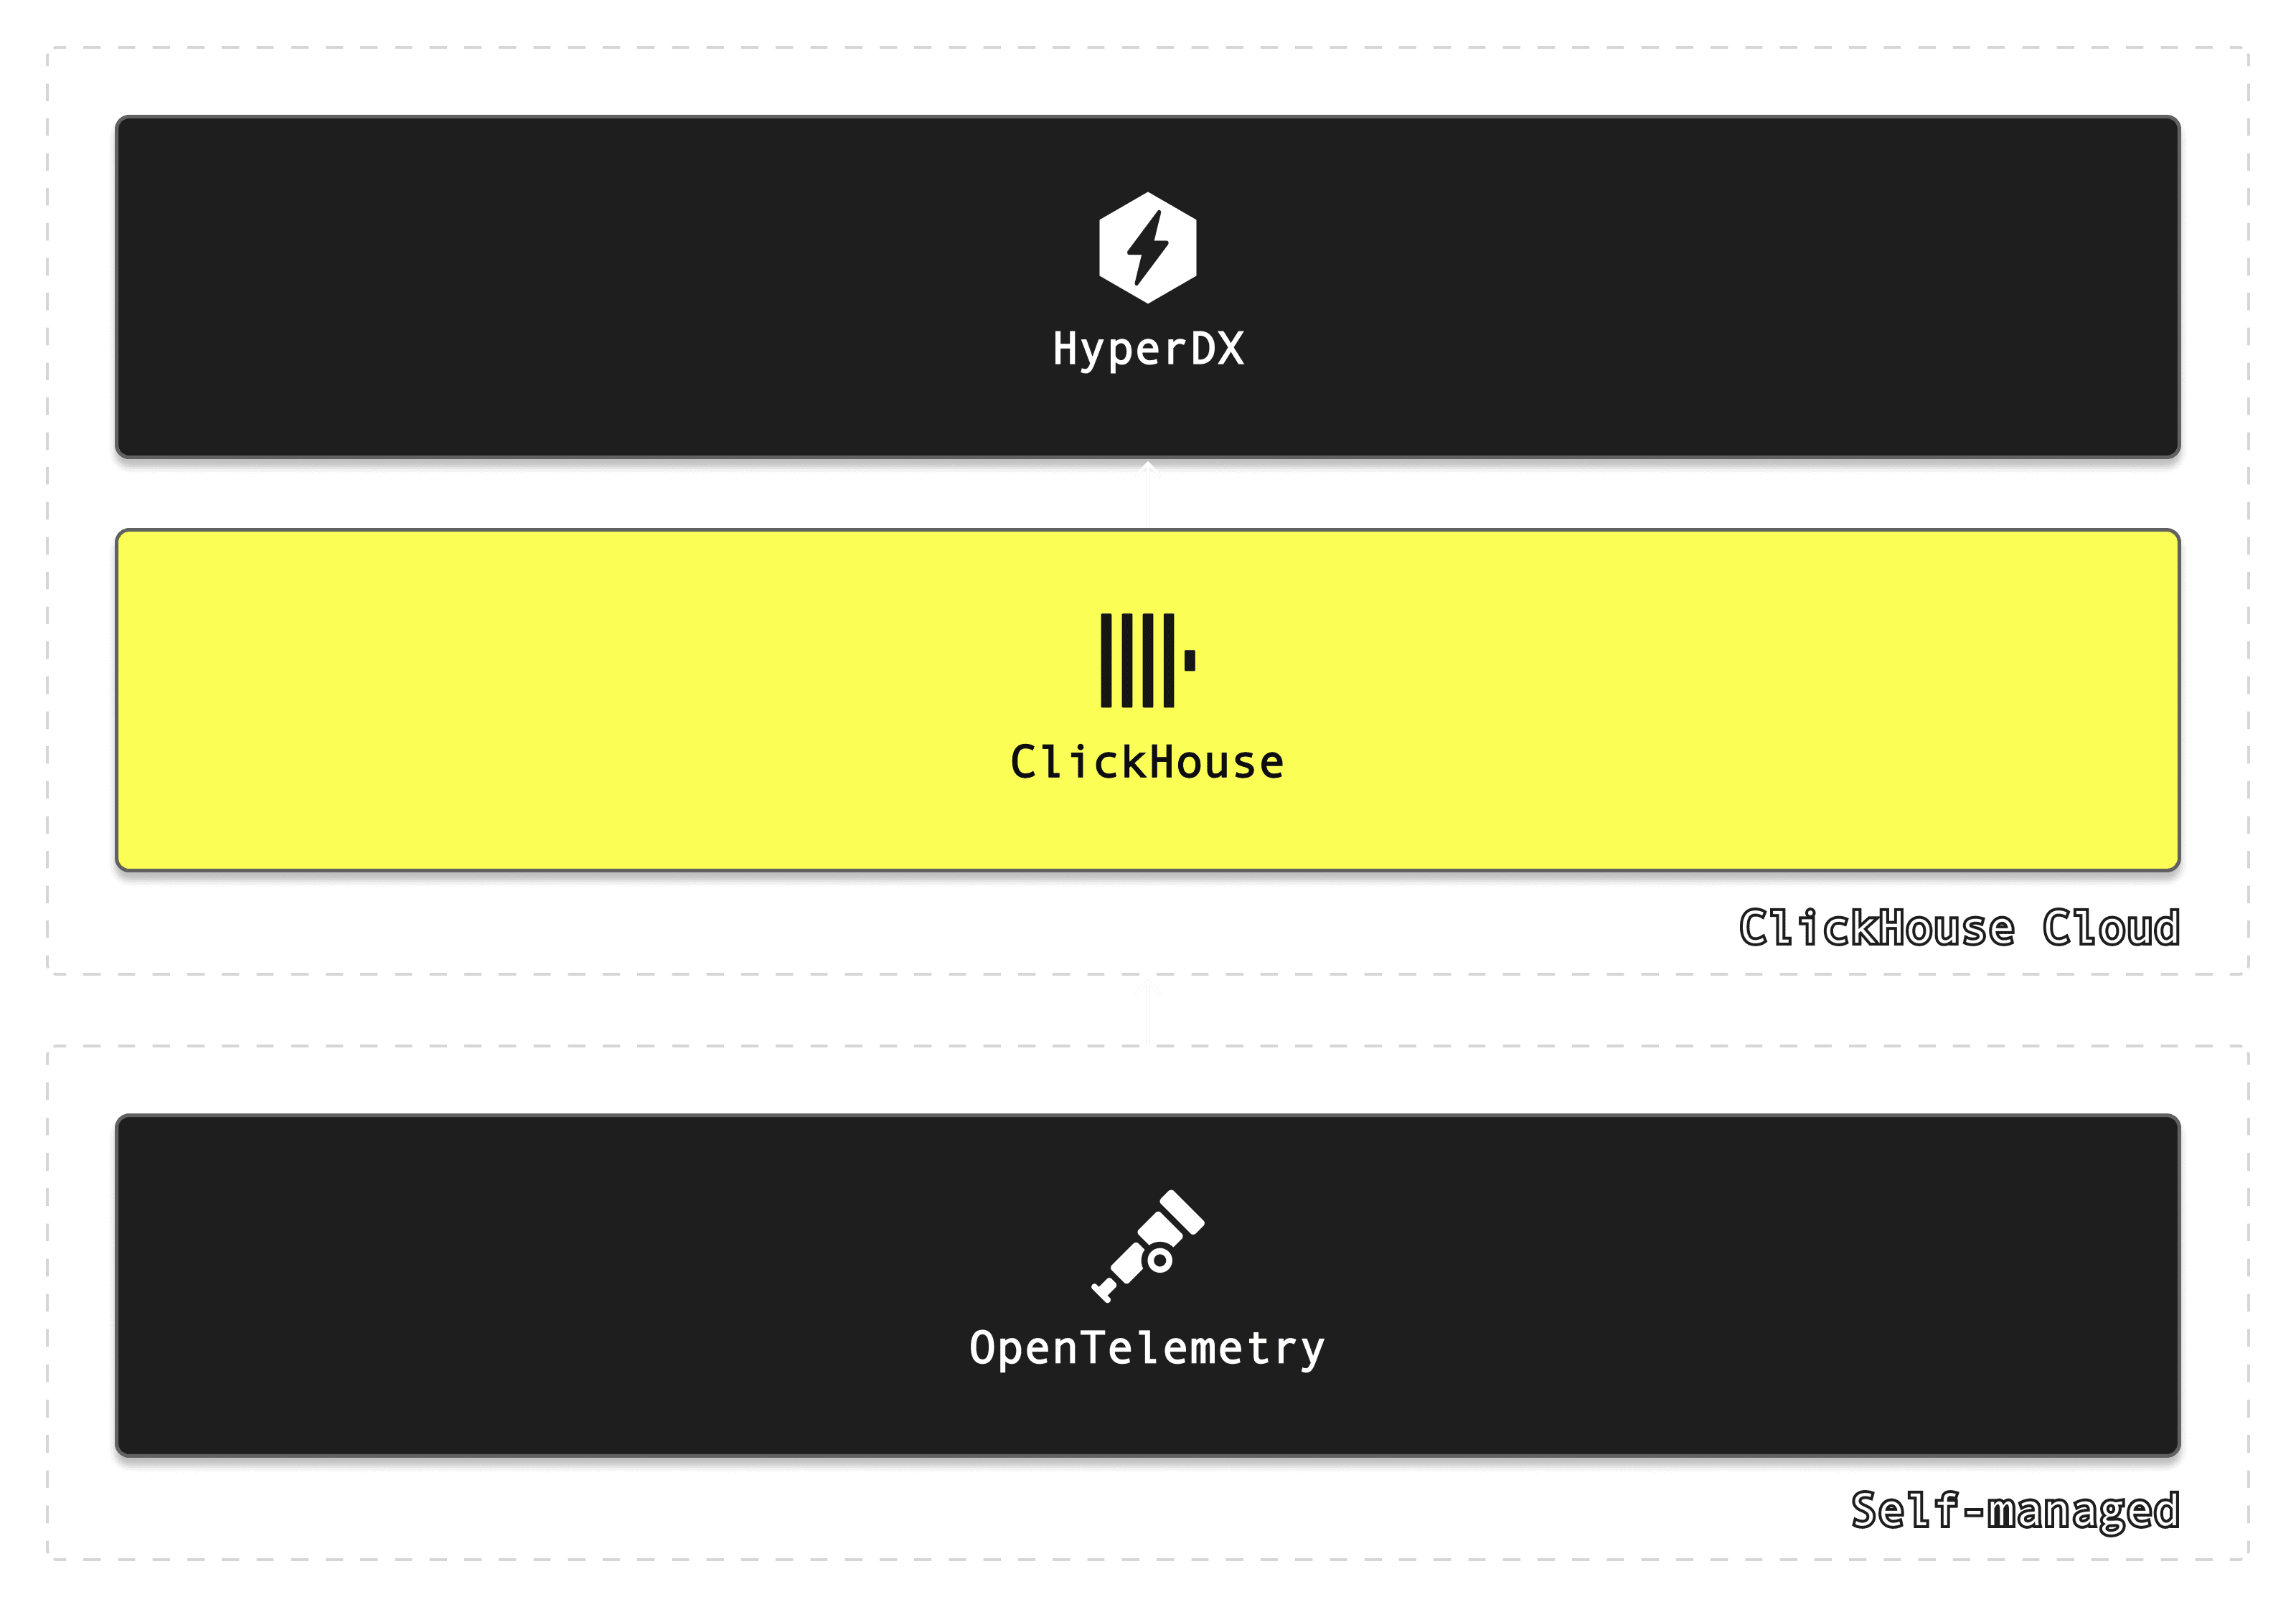
The ClickStack architecture consists of three components: an opinionated distribution of the OpenTelemetry Collector for ingest, ClickHouse for data storage and retrieval, and HyperDX as the user interface.
Since launching ClickStack, we’ve been working to bring it natively into ClickHouse Cloud. Today, we’re excited to announce the first step in that journey: the HyperDX UI is now fully hosted and integrated within ClickHouse Cloud - making it easier than ever to get started with ClickStack.
ClickStack is now available in ClickHouse Cloud in Private Preview. Register your interest here and explore real-time observability with ClickStack in the cloud.
Why This Matters #
With ClickStack now integrated into ClickHouse Cloud, users can enjoy a more turnkey ClickStack experience - no infrastructure to manage, no separate authentication to configure.
Just launch ClickStack with a single click and connect your data - fully integrated into the ClickHouse Cloud authentication system for seamless, secure access to your observability insights.
We believe this release is particularly compelling for:
- Existing ClickStack + ClickHouse Cloud Users - If you’ve been using ClickStack alongside ClickHouse Cloud, or already store observability data in ClickHouse, this simplifies everything. You can now access ClickStack directly from your ClickHouse Cloud console, removing the need for you to run this component of the stack yourself.
While ClickStack prefers OpenTelemetry (OTel) for ingestion, it supports any observability format - OTel native but not OTel exclusive - supporting wide events and custom traces, making it a fit for many existing data pipelines.
- Users Migrating larger workloads from expensive proprietary stacks - ClickStack is ideal for teams with large-scale observability needs, particularly those coming from Elastic or Datadog, who want to regain control over cost and performance. ClickHouse Cloud gives you the flexibility to assign dedicated compute to your observability workloads, while taking advantage of separation of storage and compute with S3-backed storage coupled with at least 10x compression - enabling cost-effective long-term retention and fast queries. In these cases, a dedicated resource model is often a sensible approach.
- Application Teams Using ClickHouse Cloud for Analytics - If you’re already using ClickHouse Cloud to power application analytics, adding observability is now simple. Instrument your app with OpenTelemetry or ClickHouse’s native SDKs, and you can immediately visualize and correlate observability data (traces, logs, metrics) in ClickStack and correlate with your business events in ClickHouse Cloud SQL console and dashboards.
The last of the above use cases provides a glimpse into what we consider to be the future of observability - the unification of real-time analytics, data warehousing and observability.
Toward a Unified Future: Observability Meets the Data Warehouse #
This release marks more than just a UI integration - it’s the first step toward a much larger vision: the convergence of observability, real-time analytics and data warehousing in a single, unified platform. This is something only ClickHouse can truly deliver.
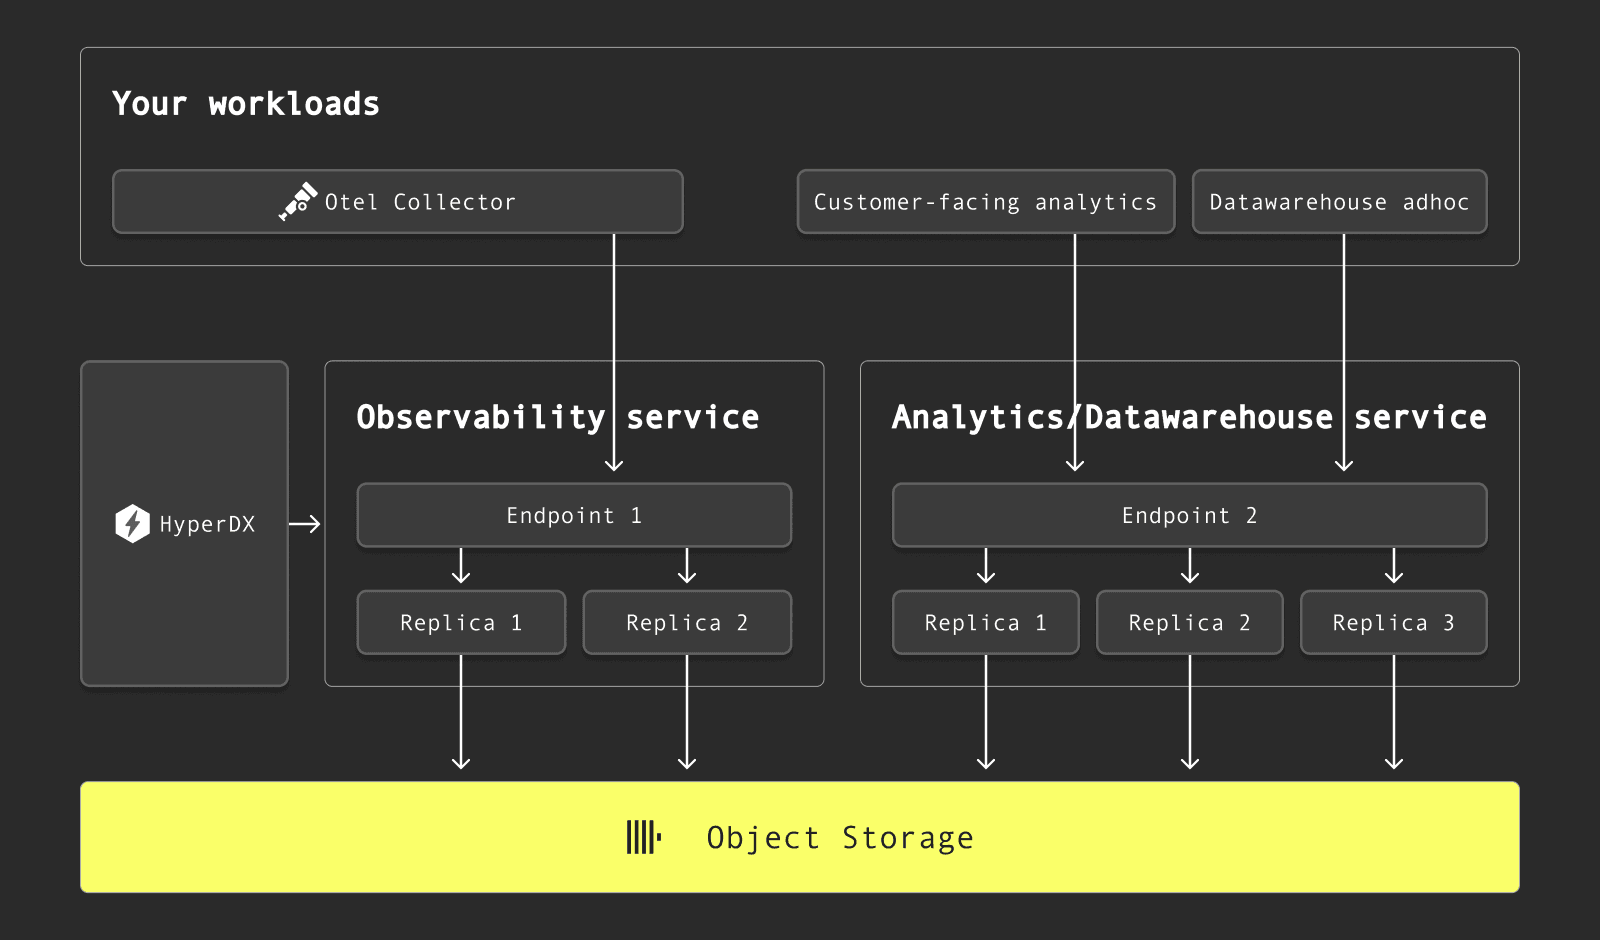
ClickHouse Cloud Users can store observability data in the same service currently serving their real-time analytics workloads or acting as their real-time data warehouse. Users can even exploit compute-compute separation to ensure these existing workloads are not impacted, using child services to ingest observability signals as required. This ensures the data is co-located but compute usage is fully isolated, thus ensuring existing performance of real-time analytical workloads is preserved.
While many proprietary SaaS solutions offer simplified interfaces for storing and querying observability data, they fall short in a critical area: correlating observability signals with business context. They either silo data, restrict analytical depth, or lack the performance characteristics needed to support high-cardinality joins and SQL-powered investigations at scale.
ClickHouse Cloud with ClickStack changes this. As a true column-oriented database with full SQL support, ClickHouse enables users to go beyond visualizing logs, metrics and traces. You can join observability data with application analytics, customer journeys, or financial metrics - all in one place. ClickHouse Cloud with ClickStack changes this. As a true column-oriented database with full SQL support, ClickHouse enables users to go beyond visualizing logs, metrics and traces. You can join observability data with application analytics, customer journeys, or financial metrics - all in one place. This means:
- Business teams can quantify the real-world impact of incidents or performance regressions on metrics like revenue or conversions.
- SREs and engineers can trace issues from raw telemetry to upstream customer outcomes without switching tools or copying data.
We believe observability is just another data problem. And that it belongs in the same database as your business-critical analytics. With ClickHouse Cloud, you get the performance of a real-time warehouse, the scale and flexibility of object storage, and now the visibility of a modern observability UI - all in one stack.
Other systems, particularly search engines and metrics databases, lack the native SQL capabilities, full join support and performance, or integration with open formats like Iceberg to truly unify these domains.
With ClickStack now available in private preview inside ClickHouse Cloud, we’re laying the foundation for a future where observability and analytics aren’t separate disciplines, but two views on the same truth - powered by ClickHouse.
As AI and AI agents become more capable of analyzing observability and business signals, there’s a temptation to rely on them to stitch together insights across separate data stores. While technically feasible, this approach is inherently inefficient. Querying multiple systems increases latency, consumes more compute and tokens - especially in LLM-based systems - and adds unnecessary complexity. True cost efficiency and performance come from unifying data at the storage layer, where high-cardinality joins and real-time correlation can be executed directly within the database efficiently. By co-locating observability and business data in a system like ClickHouse, AI agents using MCP capabilities can operate on a single, optimized source of truth - delivering faster, cheaper, and more accurate insights. ClickHouse is uniquely suited for agent workloads thanks to its low-latency query performance on large datasets and ability to handle high levels of query concurrency at scale.
Getting Started with ClickStack in ClickHouse Cloud #
ClickStack is currently available in private preview for ClickHouse Cloud users. To enable it for your organization, please reach out to the ClickHouse support team. Once enabled, you’ll see ClickStack appear in the left-hand navigation panel after connecting to a service - no additional setup required.
From there, you can start exploring your observability data alongside your business analytics, all in one unified interface.
For users needing a sample dataset, we recommend our getting started guides where users can load either local telemetry data or a sample dataset.
Download ClickStack #
No setup headaches - run the world’s fastest and most scalable open source observability stack, in seconds.
Conclusion and Looking ahead #
The release of ClickStack in ClickHouse Cloud is just the beginning. It marks the first step toward offering ClickStack as a fully managed observability service.
Today’s integration offers full control, flexibility, and efficiency - especially for those familiar with ClickHouse concepts like services, partitions, TTLs, shards, and indexing. This level of control allows users to fine-tune their observability stack for performance and cost at scale.
However, we recognize this isn’t the right fit for everyone. Many are simply looking for a turnkey observability solution - something that just works, with minimal setup and no need to understand schema design or cluster layout. Just send data and start monitoring and diagnosing issues.That’s why we’re actively working toward a multi-tenant, fully managed version of ClickStack. This future offering will cater to teams that want observability without any operational overhead - but with the same cost-efficiency, performance, and openness that ClickStack provides today. If you’re interested in being a design partner, please reach out!
Stay tuned - there’s much more to come.
ClickStack is now available in ClickHouse Cloud in Private Preview. Register your interest here and explore real-time observability with ClickStack in the cloud.