Network monitoring has evolved from simple uptime checks to sophisticated systems that track millions of connections per second. This guide examines how organizations implement effective network visibility to maintain reliable services and quickly resolve performance bottlenecks.
What is network monitoring? #
Network monitoring is systematically observing and analyzing network traffic and behavior. Its continuous diagnostic system provides visibility into how data moves through and between network components, helping organizations maintain optimal network operations and quickly address any issues.
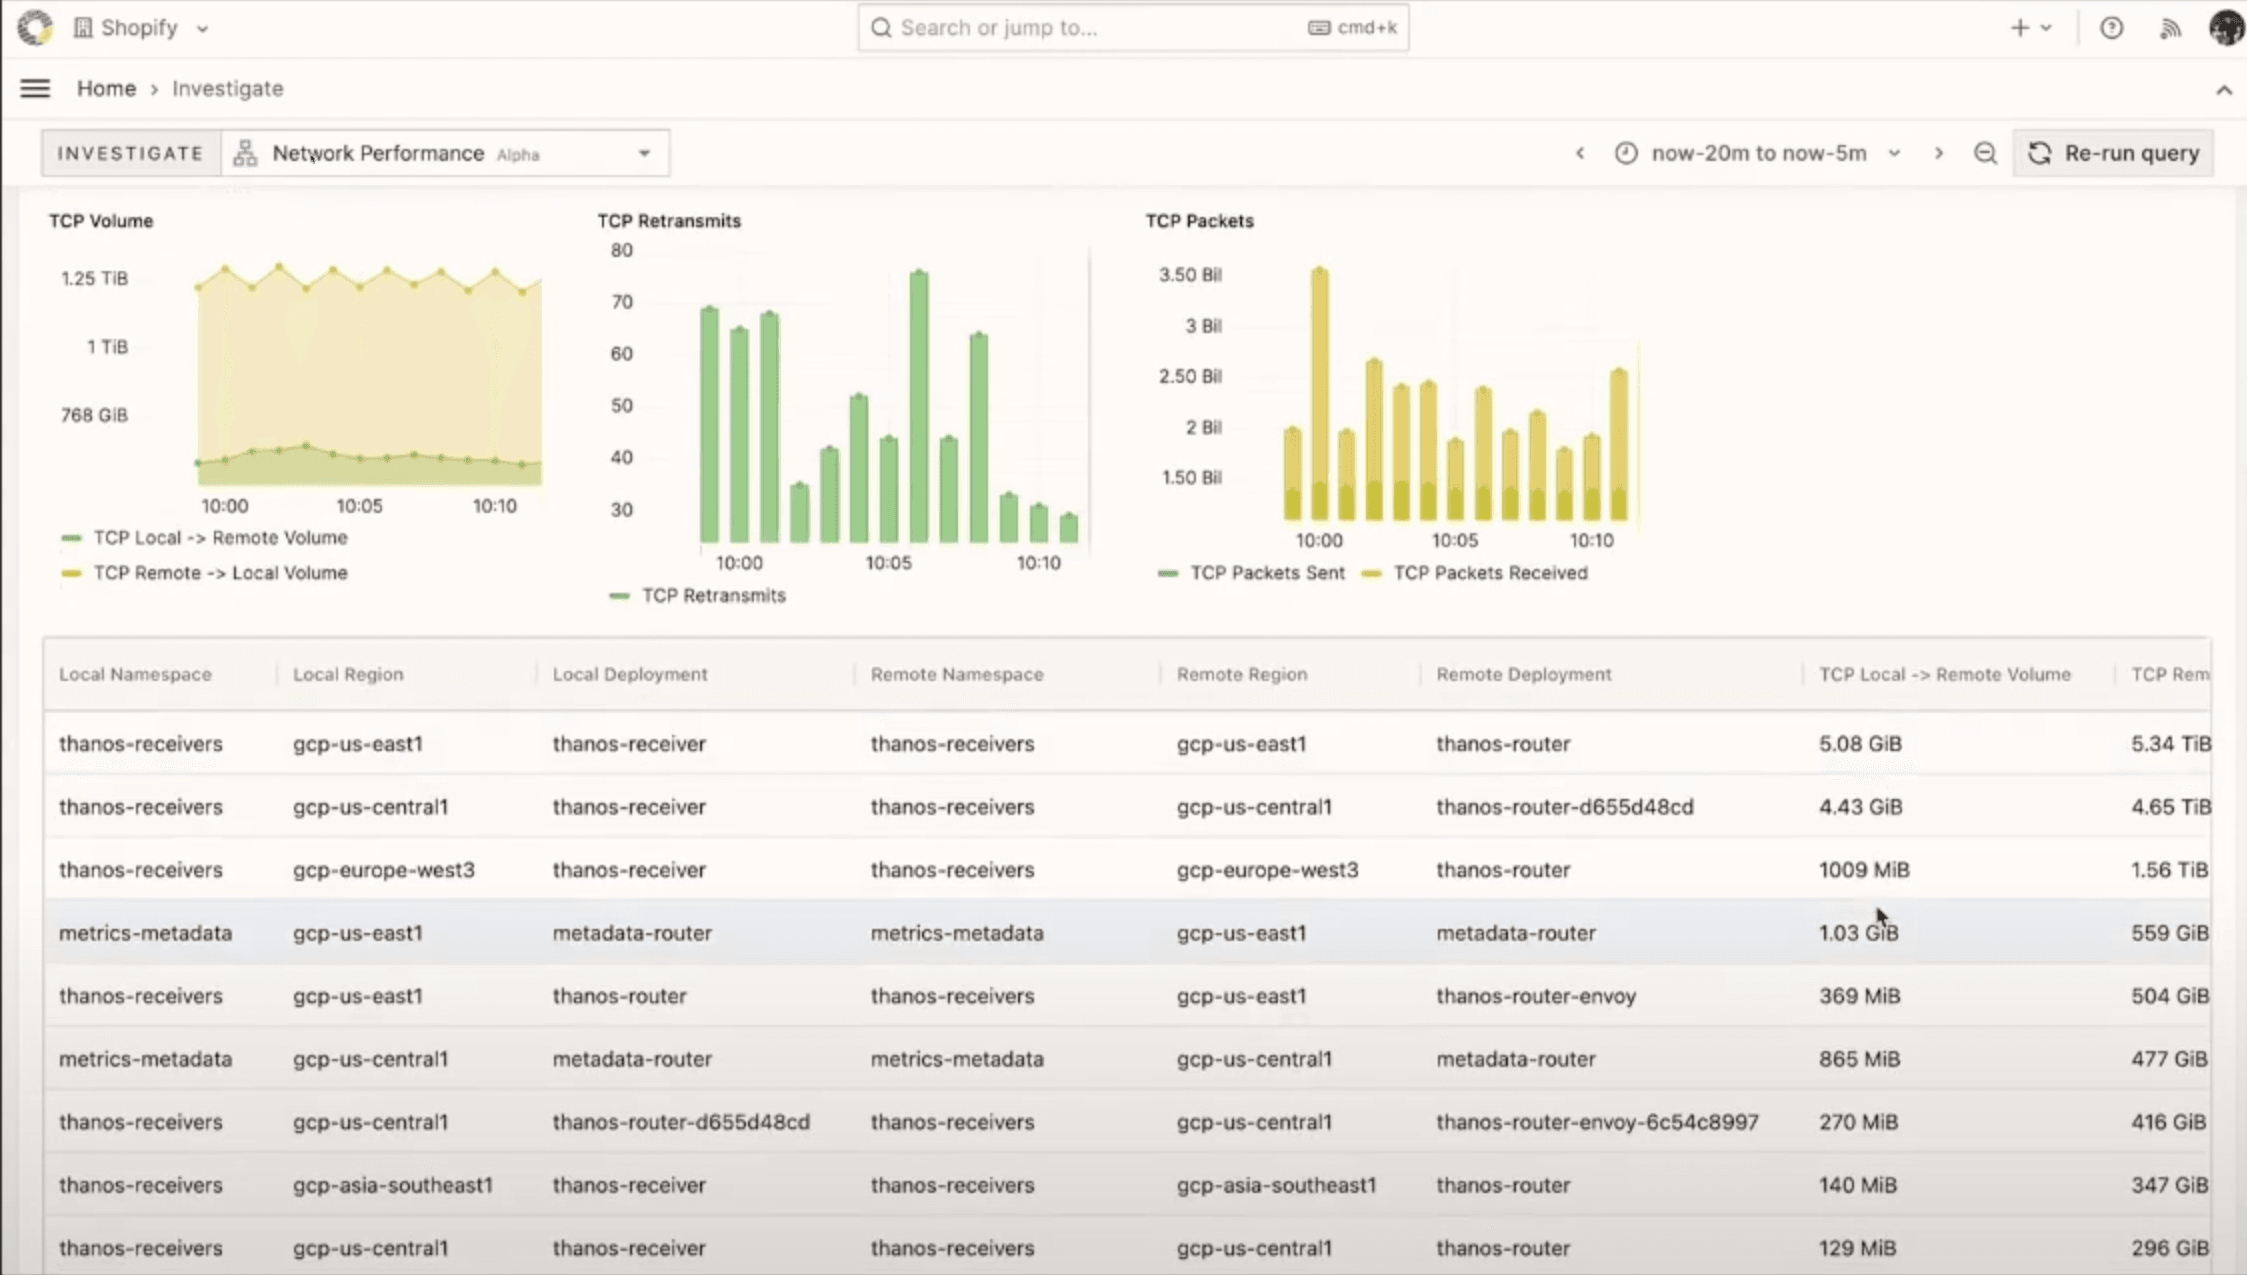 A Shopify network monitoring dashboard
The interface above shows that modern network monitoring combines multiple data visualizations to provide comprehensive network visibility. Time-series graphs track key metrics like TCP volume, retransmits, and packet counts, while detailed tables show traffic patterns across different regions and deployments. This kind of monitoring interface allows operators to quickly identify issues and understand traffic patterns across their infrastructure.
At its core, network monitoring performs several essential functions. It tracks data flow between network components, measures network performance and health, detects and diagnoses problems, and ensures proper network operation. These functions work together to maintain network reliability and help identify issues before they impact users.
The process involves collecting and analyzing various metrics that indicate network health. These typically include data transfer rates, connection status, error rates, response times, and resource usage. By tracking these metrics, organizations can understand their network's performance, identify bottlenecks, and maintain optimal operation.
Network monitoring can scale from simple networks to complex enterprise systems, with monitoring sophistication varying based on network size and requirements. In larger systems, it might involve tracking millions of connections per second and monitoring traffic across multiple data centers. At the same time, it might focus on basic connectivity and performance metrics in smaller networks.
The ultimate goal of network monitoring is to ensure network reliability and performance while providing the visibility needed for effective troubleshooting and maintenance. This allows organizations to maintain high-quality network services and quickly respond to issues affecting their operations.
How does network monitoring relate to observability? #
Network monitoring forms a crucial component of modern observability practices, integrating with other key observability signals such as metrics, logs, and traces. While traditional monitoring focuses solely on network performance, today's observability approaches require a more comprehensive and unified view of system behavior.
Network monitoring data must be correlated with other observability signals in a modern observability stack to provide complete system visibility. This integration allows teams to understand network performance in isolation and how network behavior impacts and relates to overall system health. When incidents occur, network data often provides critical context for troubleshooting, with network issues frequently being one of the first areas teams investigate during outages.
The evolution from standalone network monitoring tools to integrated observability platforms reflects a broader shift in how organizations approach system visibility. Rather than maintaining separate tools for different signals (metrics, logs, traces, and network data), modern platforms aim to unify these data sources. This unified approach enables more effective event store analysis and correlation across different types of observability data.
This integration is particularly valuable during incident response, where quickly correlating network behavior with other system metrics can significantly reduce troubleshooting time. The common question "Is it the network's fault?" can be answered more effectively when network monitoring is part of a comprehensive observability solution rather than existing as a standalone tool.
Network monitoring tools and architecture #
Modern network monitoring systems rely on sophisticated tools and carefully designed architecture to collect, process, and analyze network data at scale. At the foundation of many current implementations is eBPF (extended Berkeley Packet Filter), which enables the collection of network events directly from the kernel without requiring kernel modifications or pre-loaded modules. This technology allows efficient, real-time network behavior monitoring at the system level.
The collection layer typically consists of system probes deployed across nodes in the infrastructure. These probes watch for specific network events such as connections, DNS queries, and TCP queue metrics. A crucial component at this layer is the exporter, which enriches raw network data with important contextual information, such as mapping process IDs to container IDs, enabling the correlation of network events with specific applications and services.
Data processing and transportation are handled through a pipeline of vector instances that batch and compress the collected data. These vector instances serve multiple purposes: they aggregate data for efficient transmission, provide buffering to handle load spikes, and ensure reliable delivery to the storage layer. Multiple vector instances can be deployed to handle high traffic volumes, with load balancers ensuring even processing load distribution.
The storage layer must handle raw network events and enriched metadata. This layer must be capable of processing tens of millions of events per second while maintaining quick query response times. The architecture typically includes data sharding for scale and replication for reliability, with specific optimizations for time-series data access patterns.
Finally, the visualization layer provides interfaces for analyzing and investigating network behavior. Custom plugins for platforms like Grafana can offer specialized views of network data, combining time-series visualizations with detailed tabular data to support broad overview and deep investigation capabilities. This layer must handle complex queries while maintaining responsive performance, often utilizing specialized APIs and query optimization techniques.
This architectural approach enables organizations to monitor network traffic at scale while maintaining the flexibility to adapt to changing requirements and growing data volumes. The modular nature of the architecture allows components to be scaled or replaced independently as needs evolve.
Network monitoring data collection #
Network monitoring systems collect several distinct data types to provide comprehensive visibility into network behavior. This data collection occurs at multiple levels and includes raw network events and enriched metadata, creating a detailed picture of network activity and performance.
At the most fundamental level, systems collect connection information describing how different network parts communicate. This includes details about both ends of each connection - the local and remote addresses, the type of connection (TCP or UDP), and the volume of data being transferred through bytes and packets counted in both directions. Connections within the same network create two perspectives of the same communication - both incoming and outgoing views - providing complete visibility of the data flow.
DNS query data forms another crucial network monitoring component, tracking how systems resolve names to addresses. This includes recording the client making the request, the resolver handling it, the query type, and its ultimate status. This information is vital for understanding service discovery and connectivity issues within the network.
Performance metrics add another dimension to the collected data. Systems track metrics like TCP queue length and connection status changes, providing insights into the health and efficiency of network communications. These metrics help identify bottlenecks, overloaded services, and potential performance issues before they impact users.
Raw network data alone isn't sufficient for modern monitoring needs. Systems enhance this data through enrichment processes that add crucial contextual information. By mapping process IDs to container IDs, the system can associate network activity with specific applications, services, or deployments. This enrichment includes information about the broader infrastructure context, such as which region or cluster the traffic belongs to, making the data more meaningful for operations teams.
The collection process relies on modern tools like eBPF, which can capture network events directly at the kernel level. System probes watch for specific network events and changes, continuously updating their view of the network's state. This process includes differential analysis, comparing the current state with previous measurements to track changes in network behavior over time, helping identify trends and anomalies in network activity.
Benefits of network monitoring #
Network monitoring is a crucial first line of defense in system troubleshooting and performance optimization. One of its primary benefits is rapid problem isolation—as mentioned earlier, the first question during an incident is typically whether the network is at fault. Robust network monitoring allows teams to quickly confirm or rule out network issues, directing investigation efforts more efficiently.
Monitoring helps teams distinguish between application-level and network-related problems by providing visibility into network behavior and performance. This capability is particularly valuable in modern distributed systems, where applications span multiple services and network connectivity is critical in overall system performance. Quick access to network metrics and connection data can help teams determine whether to investigate application code or focus on infrastructure issues.
Network monitoring also enables proactive system management. By tracking metrics like TCP queue lengths, connection status, and DNS query performance, teams can identify potential issues before they impact users. This predictive capability allows organizations to maintain higher service reliability and reduce the time spent on reactive problem-solving.
Network monitoring provides essential visibility into system behavior in large-scale environments where systems handle millions of DNS queries and tens of millions of connections per second. Without this visibility, troubleshooting would be significantly more time-consuming and less effective, as teams would lack the context to understand how different parts of the system interact.
Challenges of network monitoring #
Network monitoring at scale presents several significant challenges. The sheer volume of data is a primary concern, with modern systems generating millions of connections per second and traffic volumes measuring in terabytes per minute. This creates a fundamental need for efficient data processing and storage solutions.
Time dimensionality adds another layer of complexity. Network data isn't static but flows continuously, requiring systems to handle different time scales and asynchronous data feeds simultaneously. This is further complicated by the need to investigate specific time frames while efficiently ignoring irrelevant data periods.
Data reliability and completeness present ongoing challenges. Monitoring systems must handle late-arriving data, missing information, and unreliable feeds without disrupting the overall analysis. They need to be able to process partial data when some feeds are missing and retroactively incorporate delayed information when it becomes available.
Infrastructure diversity adds additional complexity. Modern networks span multiple technologies and environments - from Kubernetes clusters to virtual machines and cloud services. This creates challenges in maintaining consistent monitoring coverage and correlating data across different systems and services.
ClickHouse and network monitoring #
ClickHouse is a robust foundation for large-scale network monitoring systems due to its specialized capabilities in handling high-volume network data. Its architecture enables speedy lookups and efficient time-based queries, essential for processing millions of network connections per second in modern cloud infrastructures.
Unlike traditional metrics-based solutions, ClickHouse allows for the storage of raw network flow data while avoiding cardinality problems that typically plague such systems. Combined with its fuzzy matching support through ASOF joins, this capability is well-suited for analyzing network traffic patterns across different timescales and dealing with incomplete or misaligned data.
The technology's ability to process dozens of terabytes of data daily without performance degradation makes it an excellent choice for enterprise-scale network monitoring. This has been demonstrated in practice by both Shopify's large-scale container infrastructure monitoring and BENOCS's telecommunications network traffic optimization systems, with both organizations successfully implementing ClickHouse-based solutions for their specific needs.
The result is a system that can efficiently store, process, and analyze network traffic data at scale, providing quick insights for troubleshooting and performance monitoring across large distributed systems.