Think your observability numbers are scary? Try walking a mile in OpenAI’s shoes.
Every day, the company ingests petabytes of log data—the equivalent of 500 Libraries of Congress or 2 billion iPhone photos. If you snapped a photo every second, it would take 60 years to match what OpenAI logs in a single day. You would need a pallet of hard drives just to store it. And that volume is growing by more than 20% each month.
“The scale is absolutely mind-boggling,” says OpenAI engineering manager Akshay Nanavati.
Between model research, ChatGPT, and their enterprise APIs, OpenAI is juggling multiple high-stakes, high-growth systems, all generating logs that need to be searchable, fast, and reliable. Observability means building infrastructure that can handle high-cardinality traces, sudden ingestion spikes, and the wild swings of viral user growth.
Watch Akshay and Poom’s talk at ClickHouse’s first Open House user conference:
Observability at every layer of AI #
As both a research lab and product engineering organization, OpenAI’s mission spans several distinct but deeply interdependent areas of AI innovation. “All of these functions need observability to do their jobs,” Akshay says.
First, there’s the research team, who spend their days pushing the boundaries of what models can do. “They’re training billions of models on millions of GPUs,” Akshay explains. They need to trace experiments across massive, high-cardinality datasets, often in real time, to understand performance and iterate quickly.
Then there’s the team behind ChatGPT, the fastest-growing consumer app in history. “More users means more servers means more logs,” he says. Their challenge is scale: keeping up with a flood of telemetry and staying online during massive traffic spikes.
Finally, the enterprise API team supports businesses around the world building mission-critical AI applications. For them, reliability is non-negotiable. If something breaks, logs need to be searchable instantly to meet SLAs and keep operations running smoothly.
“An engineer gets paged at 3 a.m and something’s wrong,” Akshay says. “You need to use the observability stack to figure out what’s going on.”
Learn about ClickStack #
Explore the ClickHouse-powered open source observability stack built for OpenTelemetry at scale.
Why OpenAI chose ClickHouse #
When OpenAI’s observability team began evaluating database solutions, they knew they needed something fast, flexible, and future-proof. ClickHouse stood out not just for its performance, but for how it’s built and the philosophy behind it.
“It’s open-source, so there’s no vendor lock-in,” Akshay says. If an issue arises, the team isn’t stuck waiting around for someone else to fix it; they can jump into the code, debug it themselves, and keep moving. “It makes things very convenient.”
ClickHouse is also cloud-native and designed to scale horizontally. “This means it’s relatively low operational lift to scale with both ingest and queries,” Akshay explains.
The database’s flexible indexing system supports a broad range of queries and use cases, allowing OpenAI to tune performance based on what matters most. “We can turn on the indexes that make queries fast, and turn off the indexes that make queries slow,” Akshay says. “That flexibility is really important to scaling this thing.”
Just as important, ClickHouse speaks SQL, a language understood by humans, models, and agents alike. That makes it easier to integrate AI into the observability stack, a step Akshay says is enabling some “super powerful features.”
Finally, the team took comfort in the number of companies already using ClickHouse for observability. “A lot of our peer companies are using ClickHouse for this exact use case,” Akshay says. “That means there’s a lot of good support. It’s battle-tested and just the right tool for the job.”
The day GPT-4o melted the cluster #
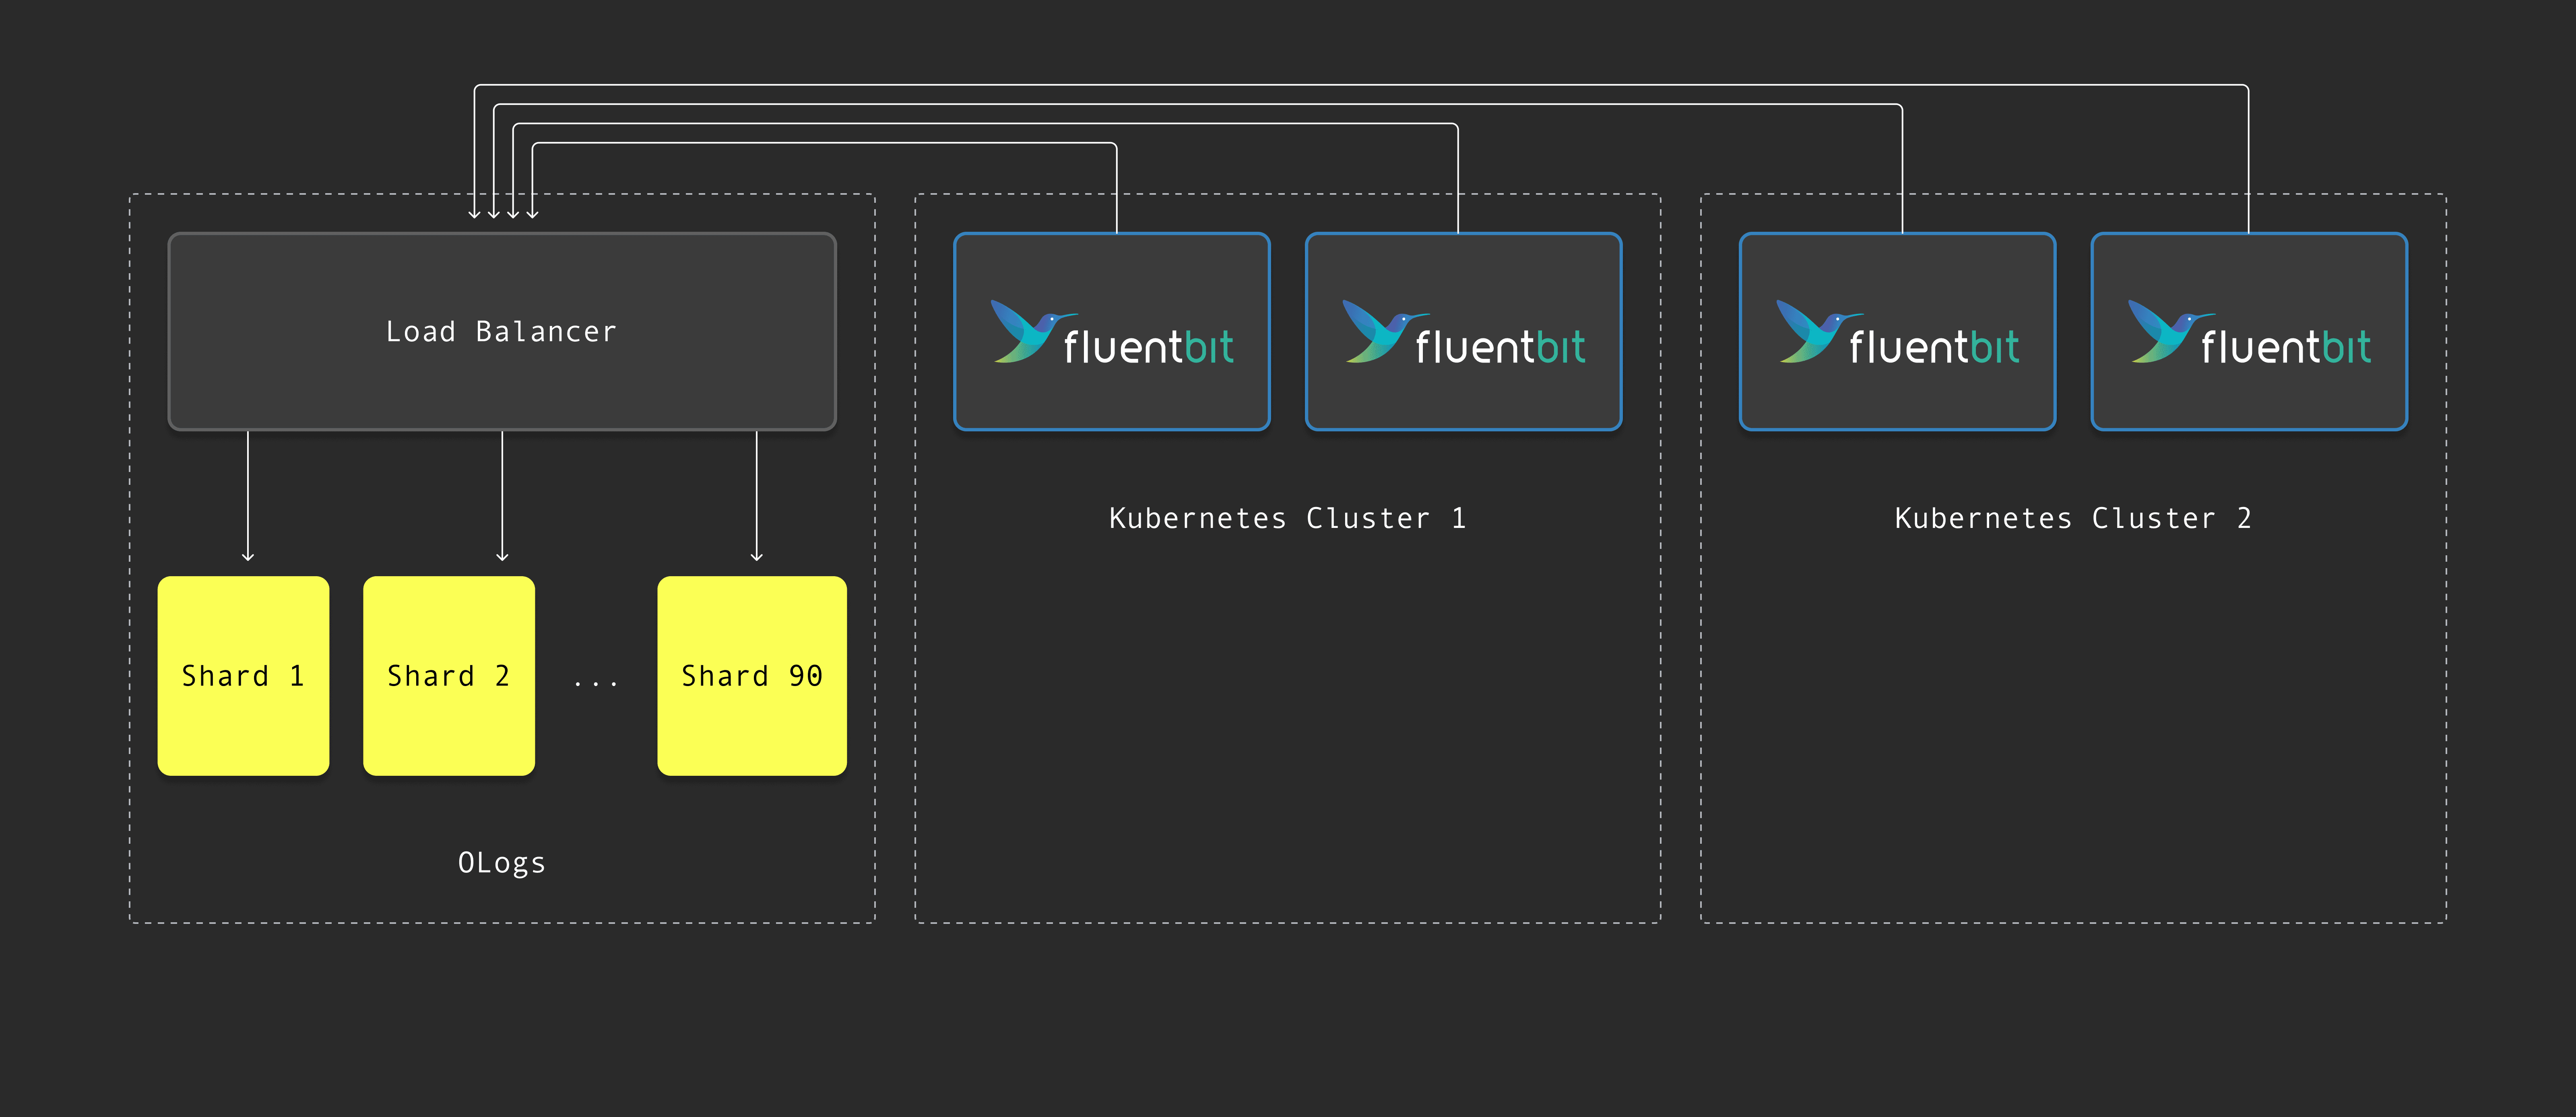
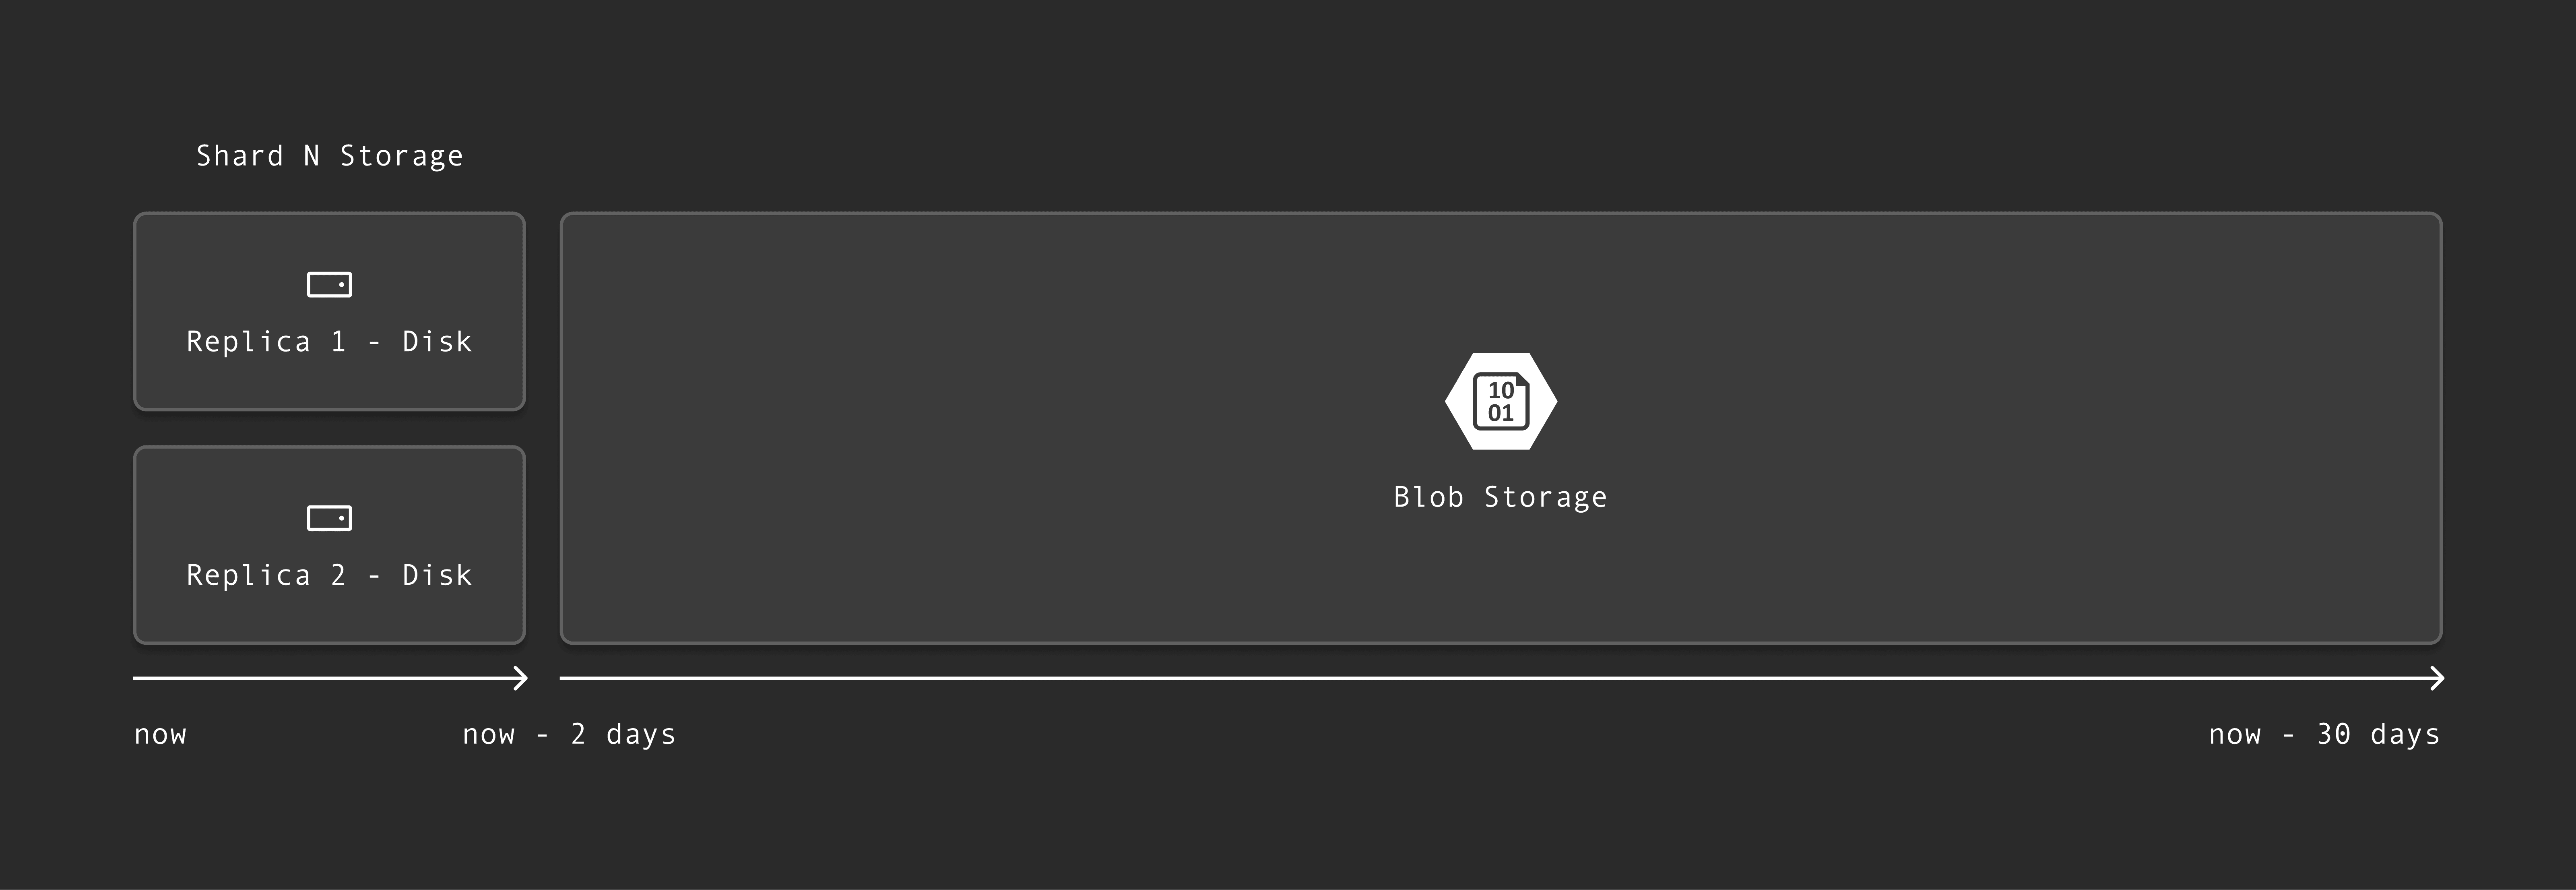
In OpenAI’s observability system, logs flow from Fluent Bit agents into a ClickHouse cluster with 90 shards, each with two replicas. Most user queries—around 80%, according to Poom—only touch data from the last two days, so that data stays on disk for fast access. Older logs go into blob storage. “ClickHouse, being cloud-native, intelligently abstracts away this tiered storage structure, and writers of SQL never have to care where the data lives,” he says.
The next diagram shows how logs flow from Fluent Bit agents through a load balancer into 90 ClickHouse shards:

This diagram shows how recent data stays on disk, while older logs are automatically offloaded to blob storage:

“With this setup, things were running pretty smoothly,” Poom says.
That is, until March 25th, 2025—the day OpenAI launched image generation in GPT-4o. “Our users loved it,” Poom says. There were anime selfies, memes, even pictures of the OpenAI logo rendered as a steak. “It was one of the biggest user growth spikes I’ve ever seen.”
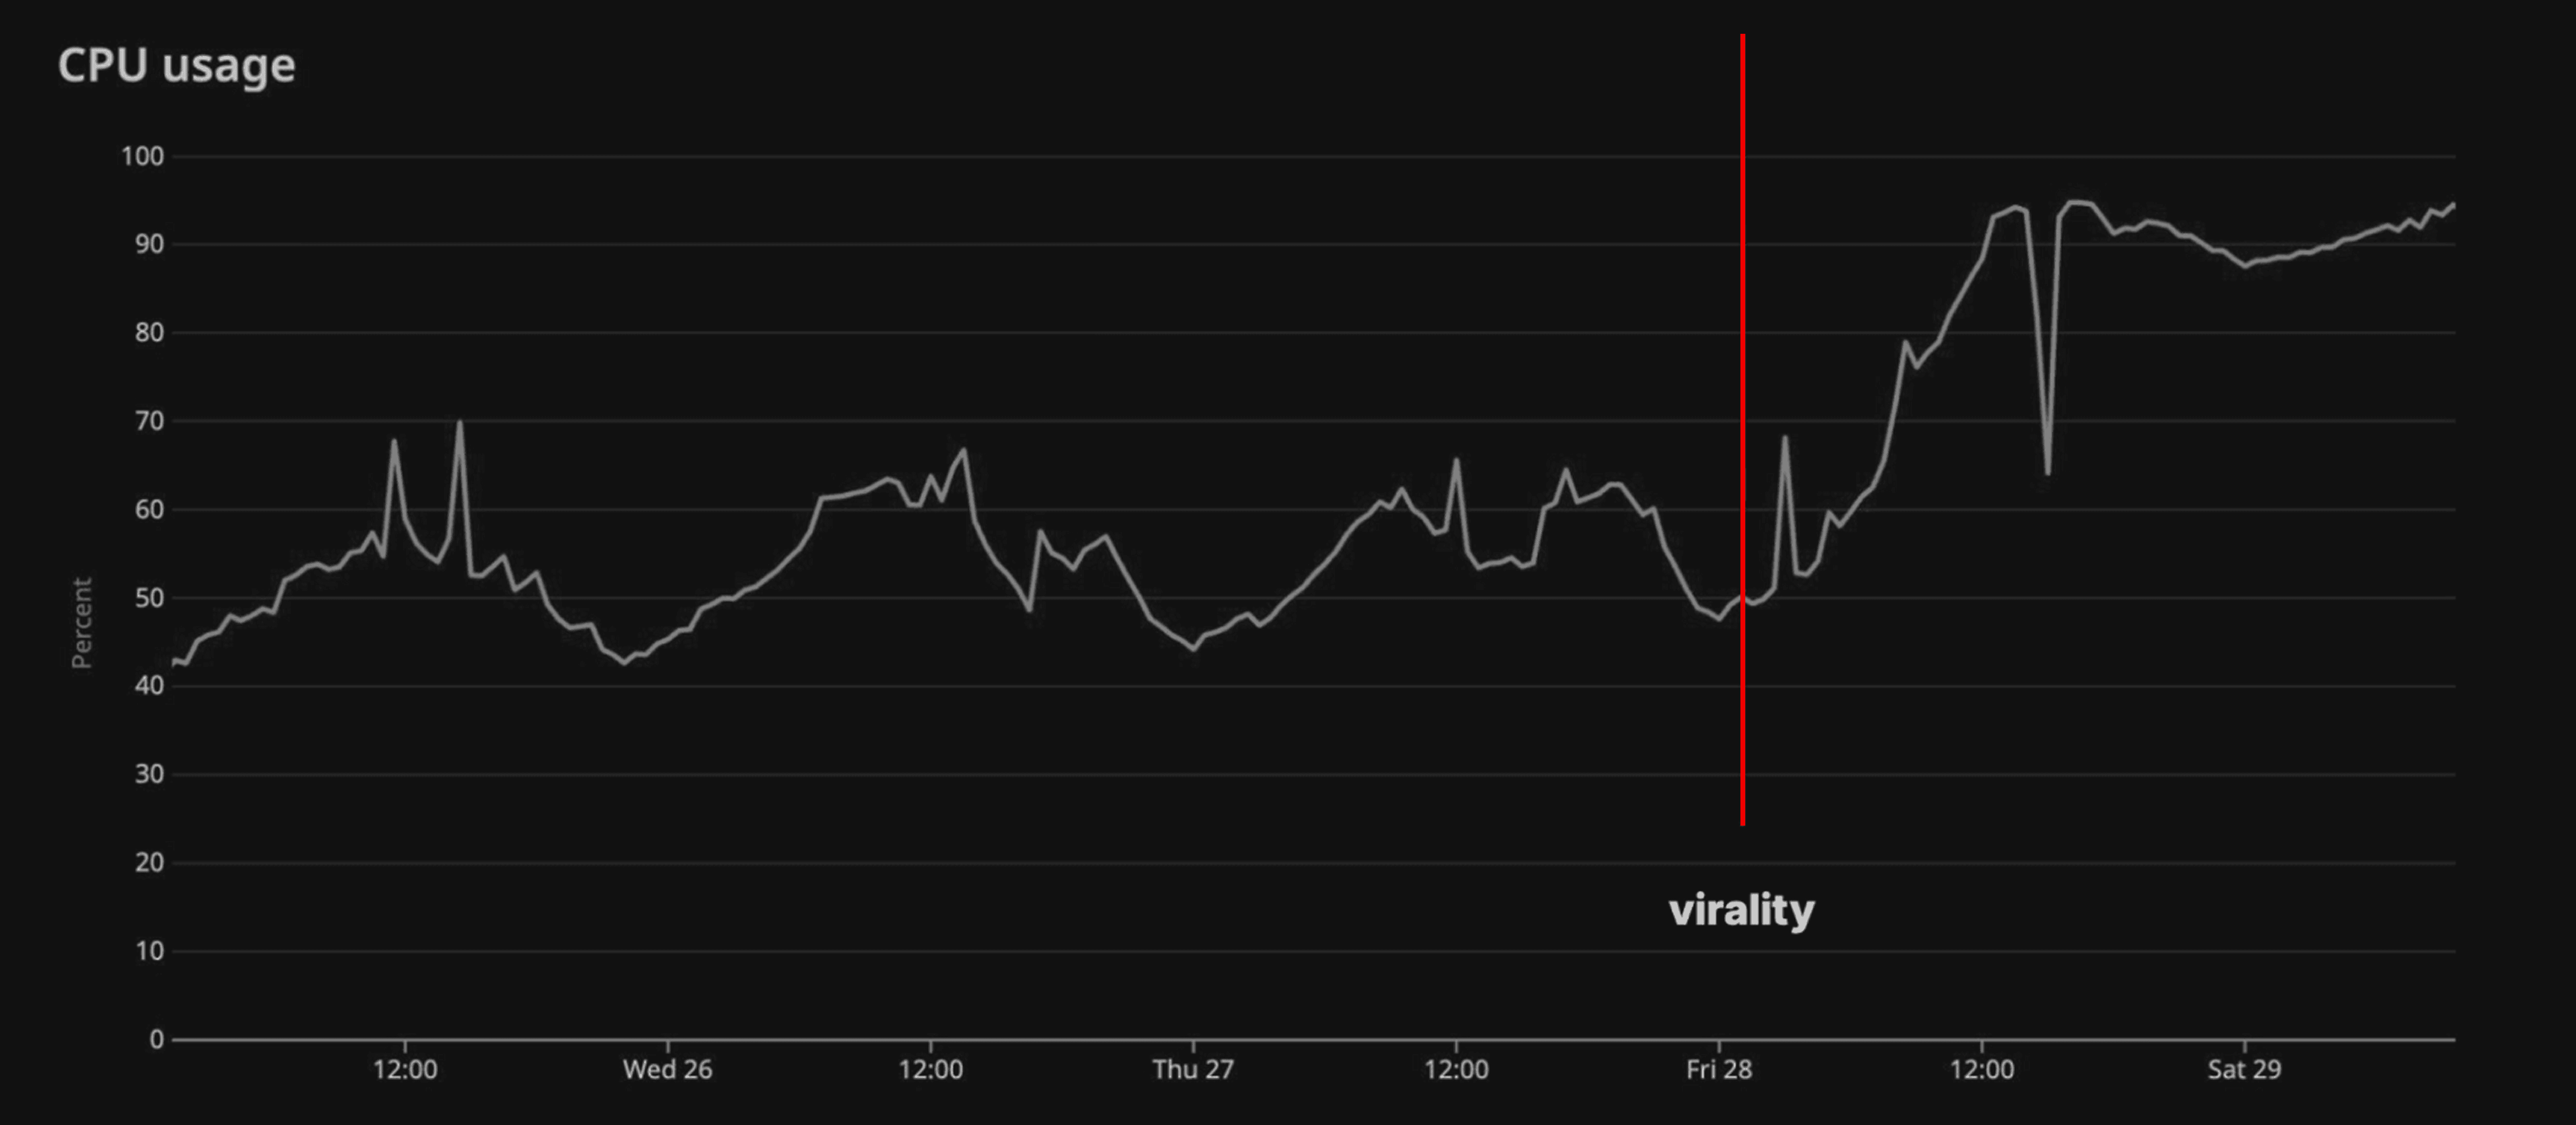
At the same time, he says, “all our servers were melting.” Log volume surged by 50% overnight. “We went to bed comforted by the knowledge that we had 50% headroom in CPU utilization, and woke up to find that was wiped out in a single night.”
CPU usage spiked by 50% following the launch of image generation in GPT-4o:

Obviously, this wasn’t sustainable. “We knew we had to control ingest and scale up ClickHouse somehow,” Poom says. They added a third replica for queries only, so expensive lookups wouldn’t interfere with ingest. They began sampling aggressively and broke down logs by service, cluster, and container to find bottlenecks. While effective in a crisis, a core goal of modern observability is to analyze all data without resorting to sampling, a strategy detailed in our cost optimization playbook. “But ultimately, that wasn’t enough.”
The breakthrough came when they profiled ClickHouse itself. In the stack traces, a pattern jumped out: more than half the CPU time was being spent building Bloom filters—index structures designed to skip over irrelevant data blocks during queries. The culprit? A single division instruction buried deep in the Bloom filter code.
As Poom explains, division operations are around 30 times slower than additions or bitwise operations, and ClickHouse was doing one for every insert. “We realized we were dividing by the same number over and over again. Every time we added an element to this Bloom filter, we were dividing its hash by the size of the array.”
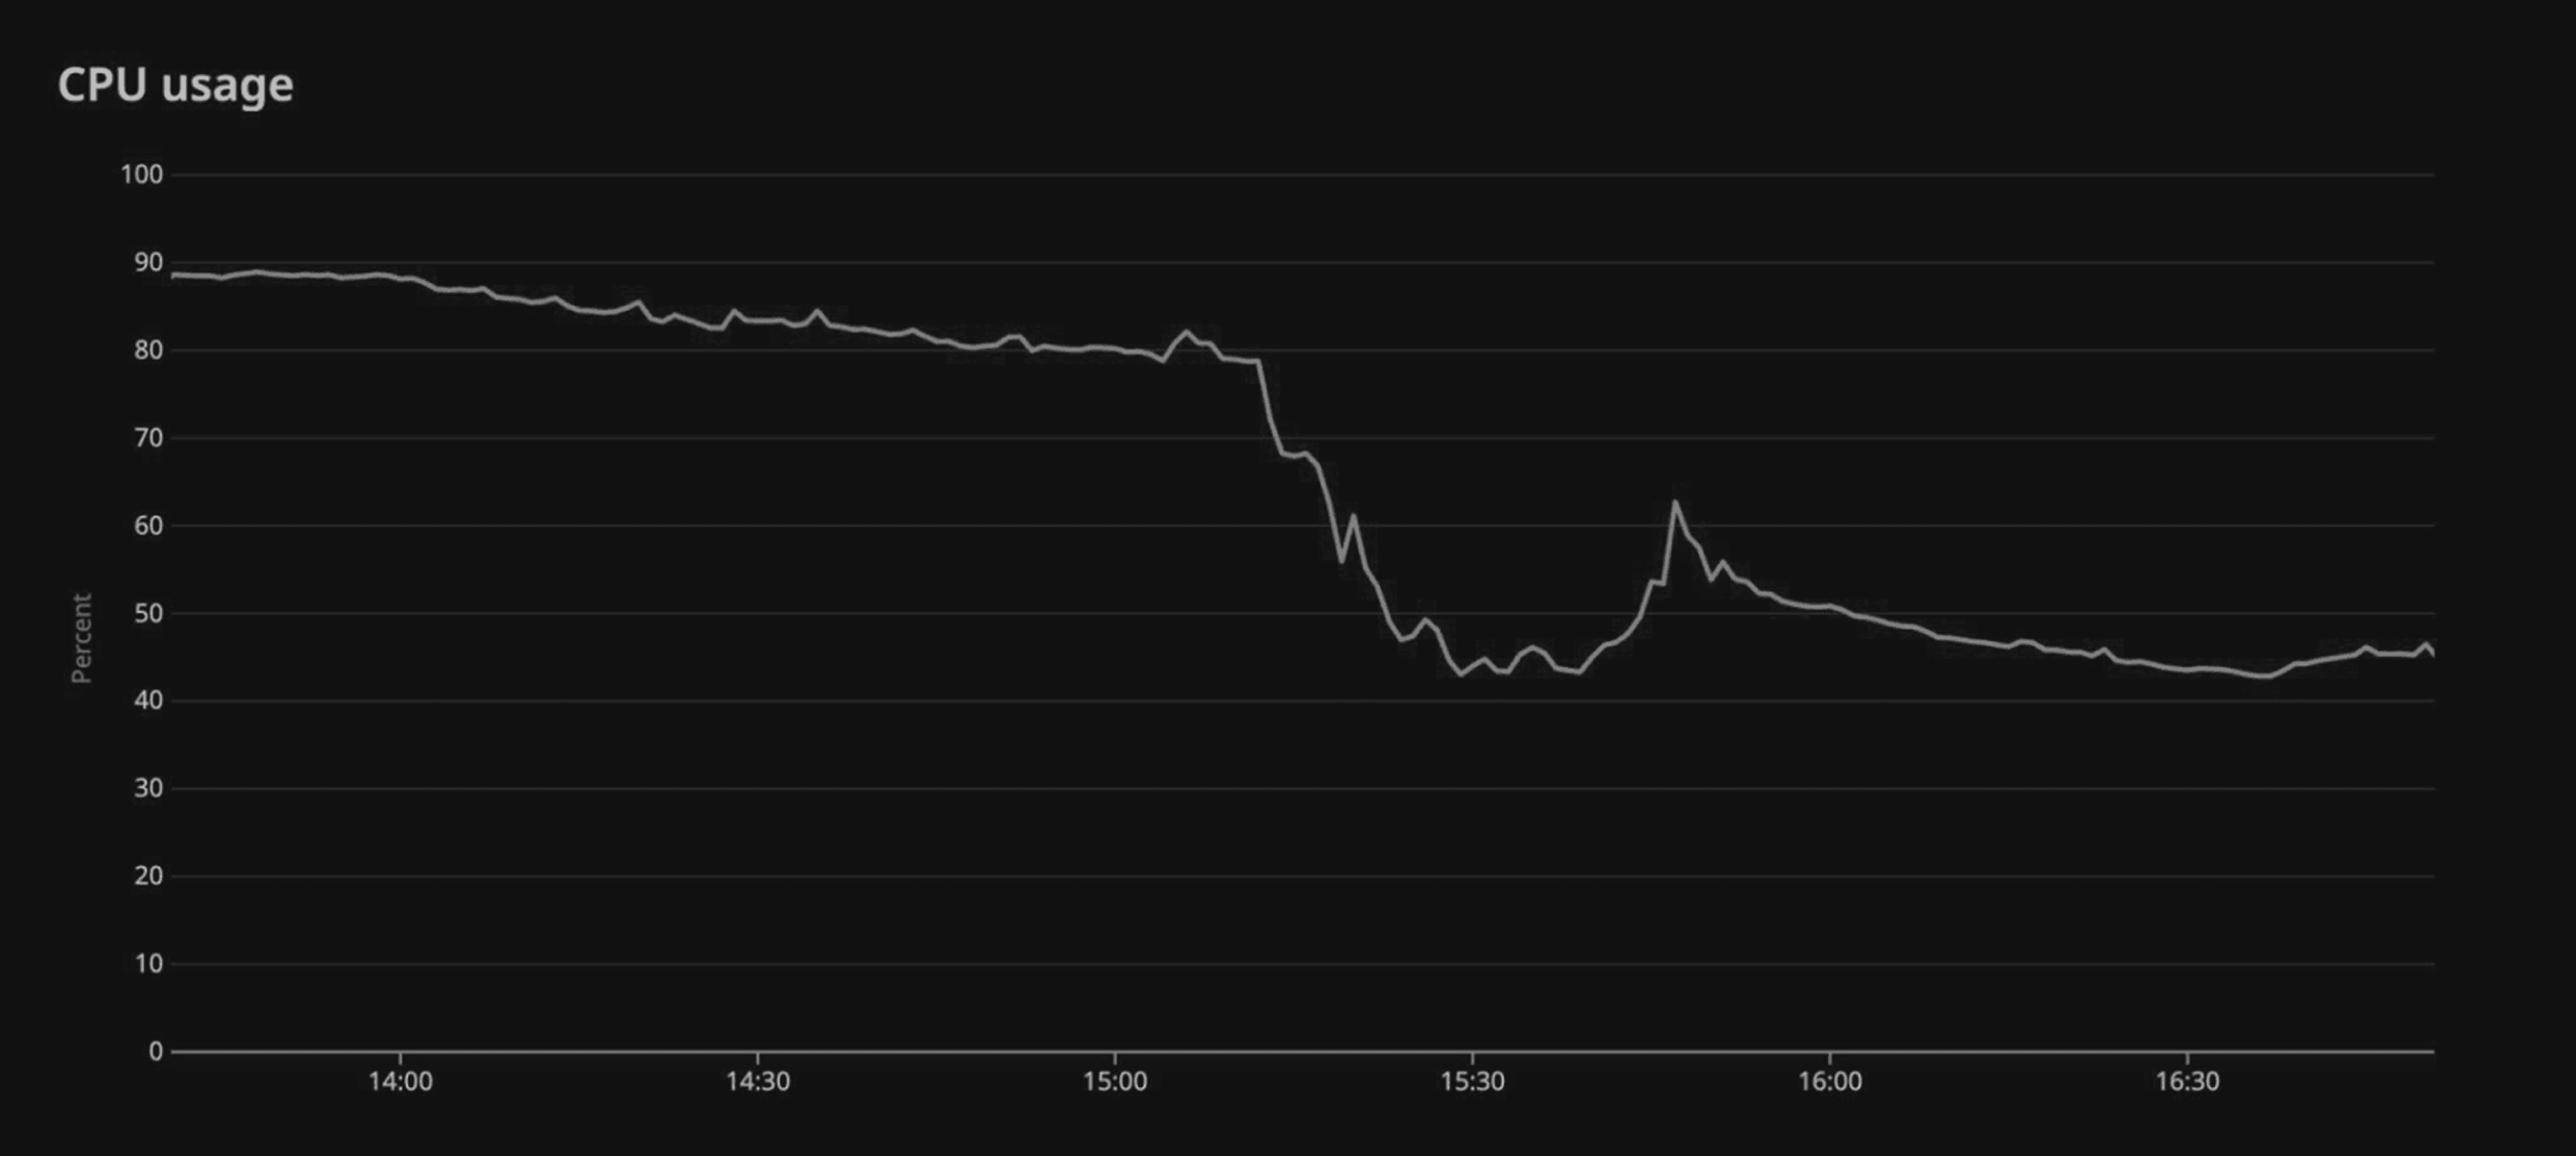
With “almost a one-line change”—replacing that division with a multiplication and bit shift—they “immediately saw a 40% reduction in CPU usage.” Poom shared a graph showing the before and after, and joked, “One could also say this was a time series of my heart rate over the period of that incident.”
CPU usage dropped by 40% after optimizing Bloom filter indexing with a one-line fix:

After the dust settled, a teammate upstreamed the change so the broader ClickHouse community could benefit. “The cloud-nativeness and open-sourceness of ClickHouse really saved us when we were in a pinch,” Akshay adds.
What’s next for OpenAI and ClickHouse #
Even after surviving one of their most intense traffic spikes ever, Akshay says OpenAI’s observability work is “nowhere near done.” The team is continuing to harden ClickHouse and scale it more intelligently, including a renewed focus on query planning. “Today, we naively fan out queries to all shards,” Akshay says. “We’re kind of hitting the limits of that.”
They’re also constantly working to improve the usability of their internal tools. “We want to build performance monitoring and other things that help engineers do their jobs even more effectively,” he says.
And on the horizon is a more autonomous observability stack, with AI agents integrated directly into the on-call workflow. “Imagine agents that can handle alerts or diagnose incidents before you even have to,” Akshay says.
Observability at OpenAI will no doubt remain as vast and fast-moving as the products it supports. But with ClickHouse as the foundation, the team has built a system that’s getting smarter with every spike. From scaling to petabytes of data to upstreaming performance optimizations, they’re pushing ClickHouse to its limits, and helping shape where it goes next.
To learn more about ClickHouse and see how it can transform your team’s data operations, try ClickHouse Cloud free for 30 days.


