One of the main selling points of ClickHouse is that it's very fast, in many cases utilizing the hardware up to the theoretical limits. This was noted by many independent benchmark such as this one. This speed boils down to a right combination of architectural choices and algorithmic optimizations, sprinkled with a dash of pixie dust. There is an overview of these factors on our website, or a talk by the ClickHouse lead developer Alexey Milovidov "The secrets of ClickHouse performance optimizations". But this is a static picture of "how the things are". Software is a living and changing organism, and ClickHouse is changing very fast — to give you a scale, in July 2021 we merged 319 pull requests made by 60 different authors (live statistics here). Any quality that is not actively selected for is going to be lost in this endless stream of changes, and the performance is no exception. For this reason, we have to have some process that allows us to ensure than ClickHouse always stays fast.
Measuring and Comparing the Performance
How do we know it is fast, in the first place? We do a lot of benchmarks, many kinds of them. The most basic kind of a benchmark is a micro-benchmark, that doesn't use the full code of the server and tests a particular algorithm in isolation. We use them to choose a better inner loop for some aggregate function, or to test various layouts of hash tables, and so on. For example, when we discovered that a competing database engine completes a query with sum aggregate function twice as fast, we tested a couple of dozen implementations of sum to ultimately find the one that gives the best performance (see a talk about this, in Russian). But testing a particular algorithm by itself is not enough to say how the entire query is going to work. We have to also make end-to-end measurements of entire queries, often using the real production data, because the particulars of the data (e.g. the cardinality and the distribution of values) heavily influence the performance. Currently we have about 3000 end-to-end test queries organized into about 200 tests. Many of them use real data sets, such as the production data of Yandex.Metrica, obfuscated with clickhouse-obfuscator as described here.
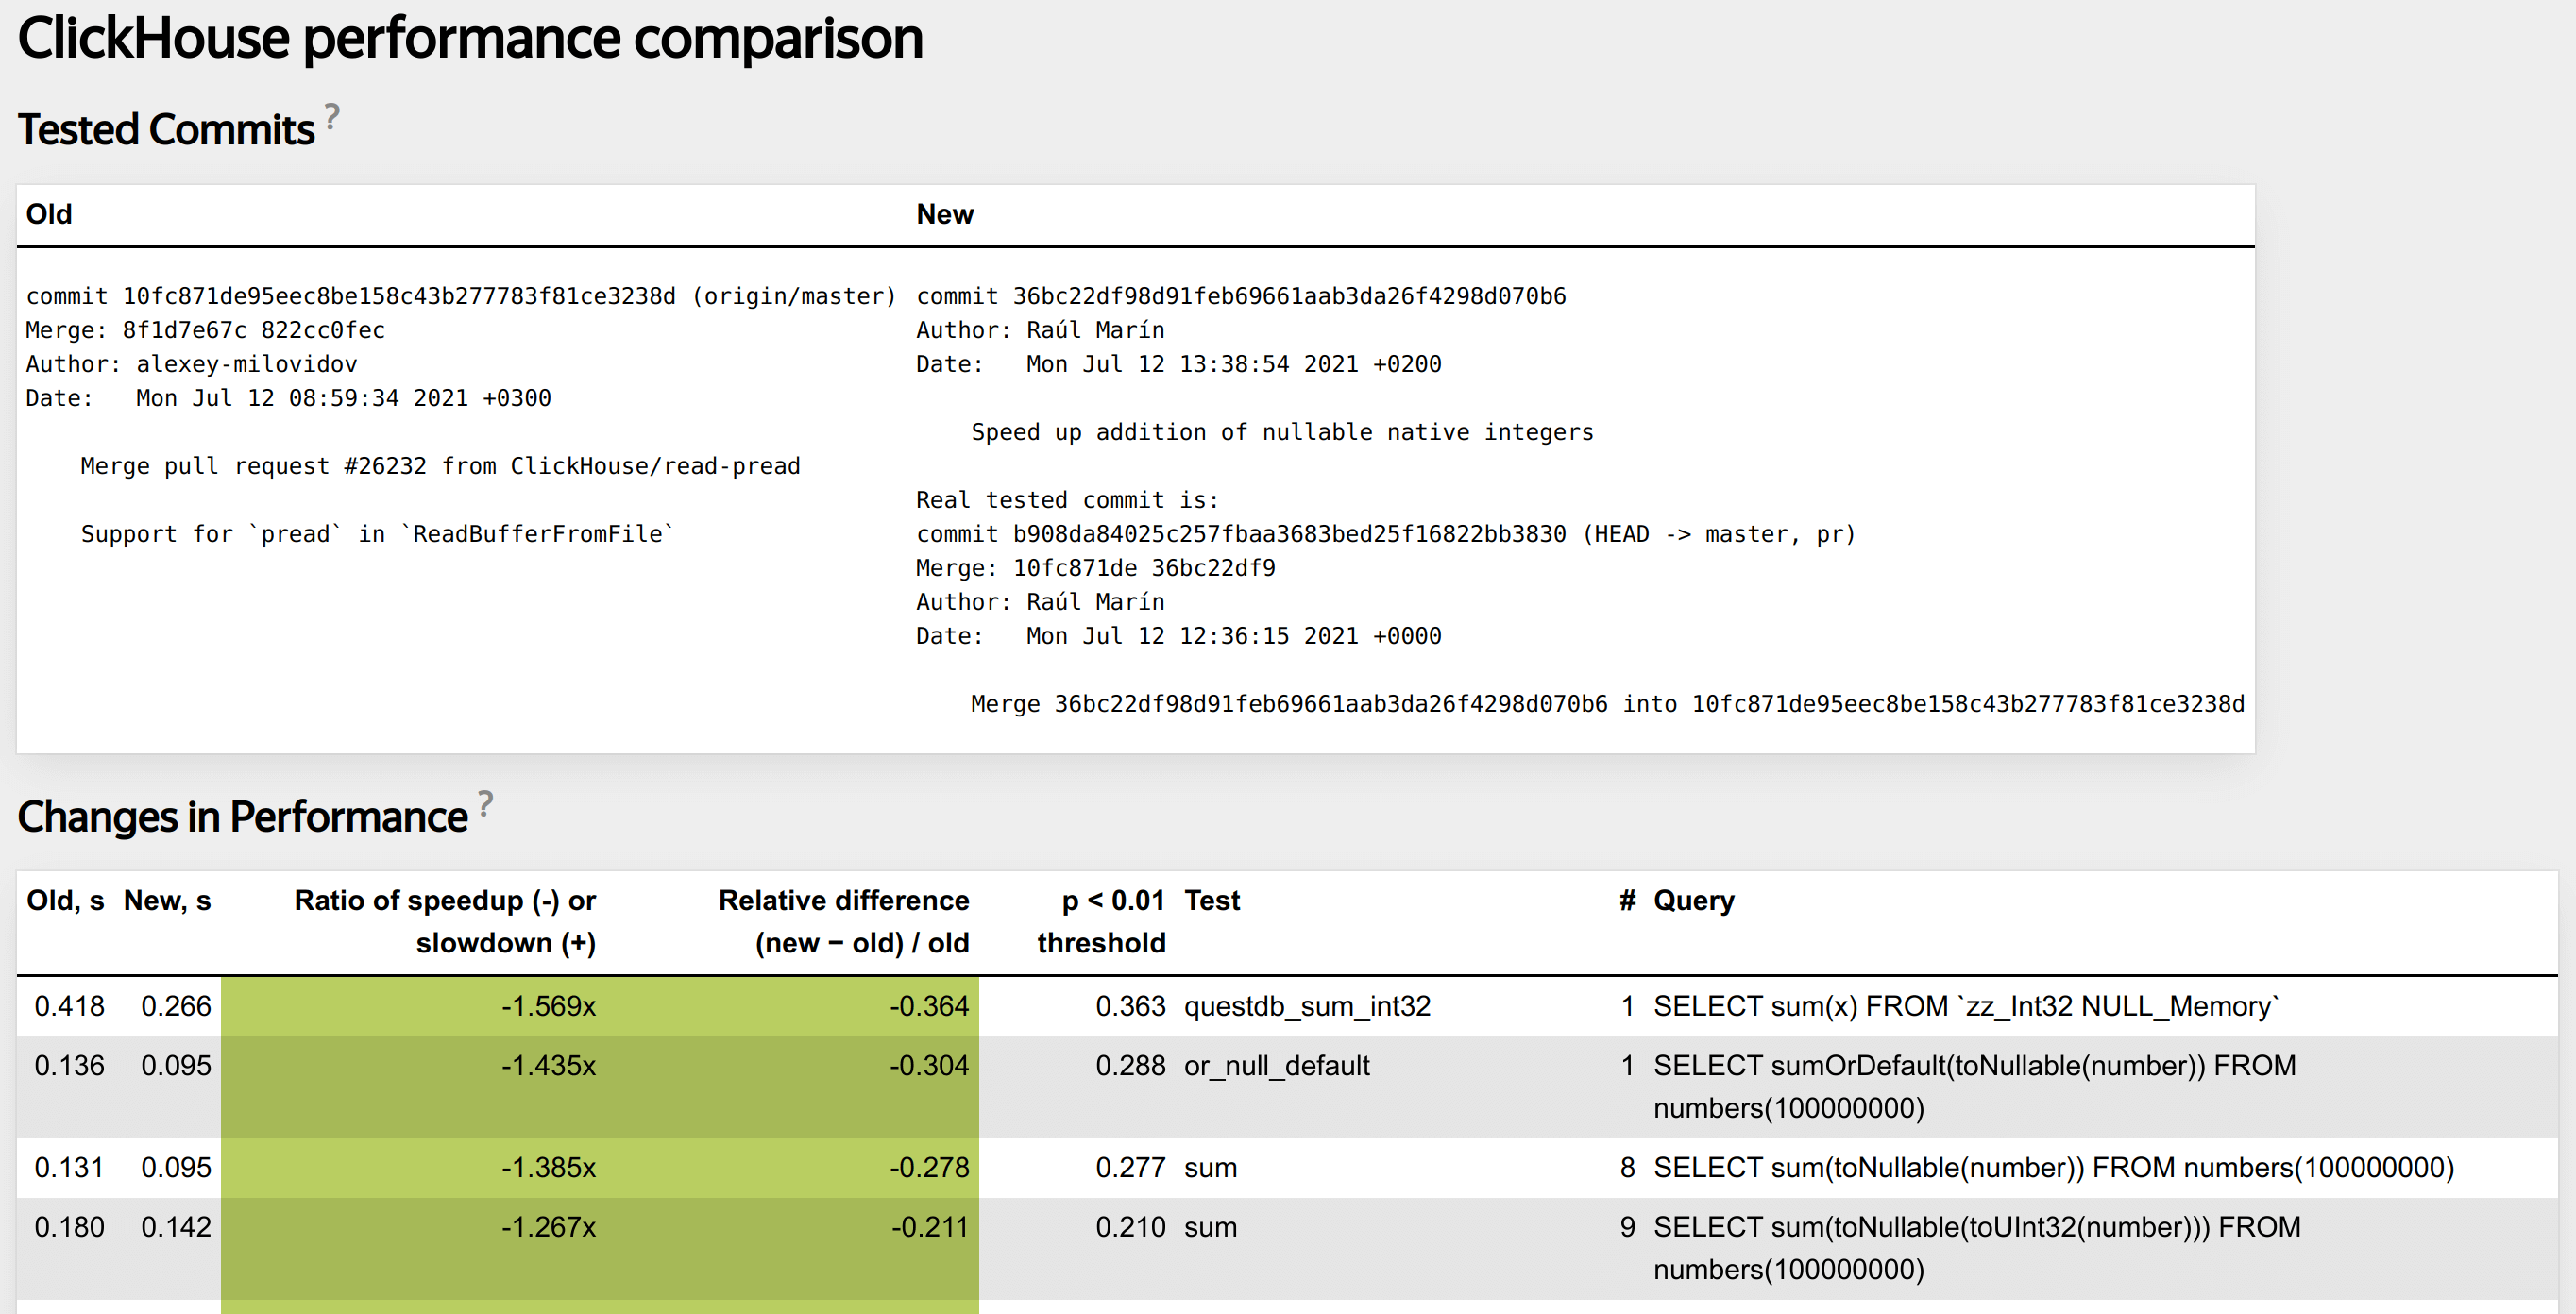
Micro-benchmarks are normally ran by a developer while working on the code, but it is not practical to manually run the entire battery of the end-to-end tests for each change. We use an automated system that does this for each pull request as part of continuous integration checks. It measures whether the code changes introduced by a pull request influenced the performance, for which kinds of queries and by how much, and alerts the developer if there is a regression. Here is how a typical report looks.
To talk about "changes in performance", we first have to measure this performance. The most natural measure for a single query is elapsed time. It is susceptible to random variations, so we have to take several measurements and average them in some way. From the application point of view, the most interesting statistic is maximum. We want to guarantee that e.g. an analytical dashboard built on ClickHouse is responsive. However, the query time can grow almost without limit due to random factor such as sudden disk load spikes or network delays, so using the maximum is not practical. The minimum is also interesting — after all, there is a theoretical bound on it. We know that the particular algorithm can run only so fast on the particular hardware, in ideal conditions. But if we only look at the minimum, we are going to miss cases where some runs of the query are slow and some are not (e.g. boundary effects in some cache). So we compromise by measuring the median. It is a robust statistic that is reasonably sensitive to outliers and stable enough against noise.
After measuring the performance, how do we determine that it has changed? Due to various random and systematic factors, the query time always drifts, so the number always changes, but the question is whether this change is meaningful. If we have an old version of the server, and a new version of the server, are they going to consistently give a different result for this query, or was it just a fluke? To answer this, we have to employ some statistical method. The core idea of these methods is comparing the observed values to some reference distribution, and deciding whether what we observed can plausibly belong to this distribution, or, on the contrary, it cannot, which means that the performance characteristics of the patched server are indeed different.
Choosing the reference distribution is the starting point. One way to obtain it is to build a mathematical model of the process. This works well for simple things like tossing a coin a fixed number of times. We can analytically deduce that the number of heads we get follows the binomial distribution, and get a confidence interval on this number, given the required level of significance. If the observed number of heads doesn't belong to this interval, we can conclude that the coin is biased. However, modeling the query execution from first principles is too complex. The best we can do is to use the hardware capabilities to estimate how fast the query could run, in principle, and try to achieve this throughput.
For complex processes which resist modeling, a practical option is to use the historical data from the same process. We actually used to do this for ClickHouse. For each tested commit, we measured the run times for each test query and saved them into a database. We could compare the patched server to these reference values, build graphs of changes over time and so on. The main problem with this approach is systematic errors induced by environment. Sometimes the performance testing task ends up on a machine with dying HDD, or they update atop to a broken version that slows every kernel call in half, et cetera, ad infinitum. This is why now we employ another approach.
We run the reference version of the server process and the tested version, simultaneously on the same machine, and run the test queries on each of them in turn, one by one. This way we eliminate most systematic errors, because both servers are equally influenced by them. We can then compare the set of results we got from the reference server process, and the set from the test server process, to see whether they look the same. Comparing the distributions using two samples is a very interesting problem in itself. We use a non-parametric bootstrap method to build a randomization distribution for the observed difference of median query run times. This method is described in detail in [1], where they apply it to see how changing a fertilizer mixture changes the yield of tomato plants. ClickHouse is not much different from tomatoes, only we have to check how the changes in code influence the performance.
This method ultimately gives a single threshold number T: what is the largest difference in median query run times between old and new server, that we can observe even if nothing has changed. Then we have a simple decision protocol given this threshold T and the measured difference of medians D:
- abs(D) <= T — the changes are not statistically significant,
- abs(D) <= 5% — the changes are too small to be important,
- abs(T) >= 10% — the test query has excessive run time variance that leads to poor sensitivity,
- finally, abs(D) >= T and abs(D) >= 5% — there are statistically significant changes of significant magnitude.
The most interesting case are the unstable queries (3). When the elapsed time changes significantly between runs even on the same version of server, it means we won't be able to detect the changes of performance, because they are going to be drowned out by the noise. Such queries tend to be the most difficult to debug, because there is no straightforward way to compare "good" and "bad" server. This topic deserves its own article which we will publish next. For now, let's consider the happy path (4). This is the case of real and notable changes in performance that this system is intended to catch. What do we do next?
Understanding the Reasons Behind the Changes
An investigation of code performance often starts with applying a profiler. On Linux, you would use perf, a sampling profiler that periodically collects the stack trace of the process, so that you can then see an aggregate picture of where your program spends the most time. In ClickHouse, we actually have a built-in sampling profiler that saves results into a system table, so no external tools are needed. It can be enabled for all queries or for a particular one, by passing the settings as described in the docs. It is on by default, so if you use a recent version of ClickHouse, you already have a combined profile of your production server load. To visualize it, we can use a well-known script for building flamegraphs:
clickhouse-client -q "SELECT
arrayStringConcat(
arrayMap(
x -> concat(splitByChar('/', addressToLine(x))[-1],
'#', demangle(addressToSymbol(x))),
trace),
';') AS stack,
count(*) AS samples
FROM system.trace_log
WHERE trace_type = 'Real'
AND query_id = '4aac5305-b27f-4a5a-91c3-61c0cf52ec2a'
GROUP BY trace" \
| flamegraph.plAs an example, let's use the test run we've seen above. The tested pull request is supposed to speed up the sum aggregate function for nullable integer types. Let's look at the query #8 of the test 'sum': SELECT sum(toNullable(number)) FROM numbers(100000000). The test system reported that its performance increased by 38.5%, and built a "differential" variant of flamegraph for it, that shows the relative time spent in different functions. We can see that the function that calculates the sum, DB::AggregateFunctionSumData<unsigned long>::addManyNotNull<unsigned long>, now takes 15% less time.

To get more leads into why the performance has changed, we can check how the various query metrics have changed between the old and the new servers. This includes all the metrics from system.query_log.ProfileEvents, such as SelectedRows or RealTimeMicroseconds. ClickHouse also tracks the hardware CPU metrics such as the number of branch or cache misses, using the Linux perf_event_open API. After downloading the test output archive, we can use a simple ad hoc script to build some statistics and graphs of these metrics.
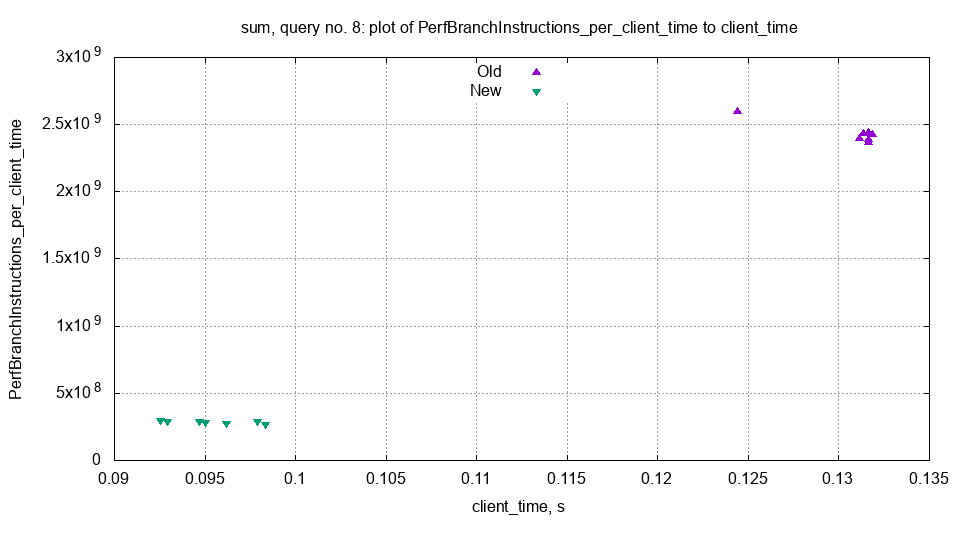
This graph shows the number of branch instructions per second, on the old and the new server. We can see that the number of branch instructions has dramatically decreased, which might explain the performance difference. The tested pull request removes some ifs and replaces them with multiplication, so this explanation sounds plausible.
While side-to-side comparison is more robust against the systemic errors, the historical data is still very valuable for finding where a regression was introduced or investigating the unstable test queries. This is why we save the results of all test runs into a ClickHouse database. Let's consider the same query #8 from the sum test. We can build the history of performance changes with this SQL query to the live ClickHouse CI database. Open the link and run the query so that you can examine the query and see the result for yourself. There were three significant changes of performance throughout the test history. The most recent is a speedup in PR we started with. The second speedup is related to fully switching to clang 11. Curiously, there is also a small slowdown introduced by a PR that was supposed to speed it up instead.
Usability Considerations
Regardless of how it works inside, a test system must be actually usable as a part of the development process. First and foremost, the false positive rate should be as low as possible. False positives are costly to investigate, and if they happen often, developers perceive the test as generally unreliable and tend to ignore the true positives as well. The test must also provide a concise report that makes it obvious what went wrong. We have not really succeeded in this. This test has many more failure modes than a plain functional test, and worse, some of these failures are quantitative, not binary. Much of the complexity is essential, and we try to alleviate it by providing good documentation and linking to the relevant parts of it right from the report page. Another important thing is that the user must be able to investigate a problematic query post-mortem, without running it again locally. This is why we try to export every metric and every intermediate result we have, in easily-manipulated plain text formats.
Organizationally, it is hard to prevent devolving into a system that does a lot of busywork to just show a green check without giving any insight. I like to call this process "mining the green check", by analogy to cryptocurrencies. Our previous system did just that. It used increasingly complex heuristics tailored to each test query to prevent false positives, restarted itself many times if the results didn't look good, and so on. Ultimately, it wasted a lot of processing power without giving the real picture of the server performance. If you wanted to be sure that the performance did or did not change, you had to recheck by hand. This sorry state is the result of how the incentives are aligned around development — most of the time, the developers just want to merge their pull requests and not be bothered by some obscure test failures. Writing a good performance test query is also not always simple. Just any other query won't do — it has to give predictable performance, be not too fast and not too slow, actually measure something, and so on. After gathering more precise statistics, we discovered that several hundred of our test queries don't measure anything meaningful, e.g. they give a result that varies by 100% between runs. Another problem is that the performance often changes in statistically significant ways (true positive) with no relevant code changes (due to e.g. random differences in layout of the executable). Given all these difficulties, a working performance test system is bound to add noticeable friction to the development process. Most of the "obvious" ways to remove this friction ultimately boil down to "mining the green check".
Implementation-wise, our system is peculiar in that it doesn't rely on well-known statistical packages, but instead heavily uses clickhouse-local, a tool that turns the ClickHouse SQL query processor into a command line utility Doing all the computations in ClickHouse SQL helped us find bugs and usability problems with clickhouse-local. The performance test continues to work in dual purpose as a heavy SQL test, and sometimes catches newly introduced bugs in complex joins and the like. The query profiler is always on in the performance tests, and this finds bugs in our fork of libunwind. To run the test queries, we use a third-party Python driver. This is the only use of this driver in our CI, and it also helped us find some bugs in native protocol handling. A not so honorable fact is that the scaffolding consists of an unreasonable amount of bash, but this at least served to convince us that running shellcheck in CI is very helpful.
This concludes the overview of the ClickHouse performance test system. Stay tuned for the next article where we will discuss the most problematic kind of a performance test failure — the unstable query run time.
2021-08-20 Alexander Kuzmenkov. Title photo by Alexander Tokmakov
References:


