Hello and Happy New Year from the ClickHouse development team! Anyone who uses GitHub Actions intensively faces the lack of some metrics at some point. One of the essential metrics is the internal queue of workflow jobs. How many are currently running? How many are in the queue? How many of them are already finished?
Luckily, there is a way to get the info and it involves ClickHouse!
In this post, we will show how you can collect all of the data from your GitHub Actions using GitHub Webhooks and store this data in ClickHouse for analysis.
Necessary tools
GitHub Webhooks
We need the status for each existing workflow job. To achieve this, we'll use GitHub webhooks. It can be a repository or organizational-scoped webhook.
An organization-level webhook works much better because we receive information about all repositories. It allows us to have a full picture.
We need to receive workflow_job events in JSON format:

An example of the hook's body with necessary objects:
{
"action": "completed",
"workflow_job": {
"id": 10232656529,
"run_id": 3749960853,
"workflow_name": "DocsCheck",
"head_branch": "from-final",
"run_url": "https://api.github.com/repos/ClickHouse/ClickHouse/actions/runs/3749960853",
"run_attempt": 1,
"node_id": "CR_kwDOA5dJV88AAAACYenykQ",
"head_sha": "e791e7bbfef2a56cd7d22779046c24086140b325",
"url": "https://api.github.com/repos/ClickHouse/ClickHouse/actions/jobs/10232656529",
"html_url": "https://github.com/ClickHouse/ClickHouse/actions/runs/3749960853/jobs/6369064705",
"status": "completed",
"conclusion": "failure",
"started_at": "2022-12-21T14:04:05Z",
"completed_at": "2022-12-21T14:04:22Z",
"name": "CheckLabels",
"steps": [
{..},
..
],
"check_run_url": "https://api.github.com/repos/ClickHouse/ClickHouse/check-runs/10232656529",
"labels": [
"self-hosted",
"style-checker"
],
"runner_id": 14977597,
"runner_name": "i-04aca26d696a1b457",
"runner_group_id": 1,
"runner_group_name": "Default"
},
"repository": {
..,
"full_name": "ClickHouse/ClickHouse",
"private": false,
..,
},
..
}AWS lambda
The simplest way-to-go is a lambda in AWS that receives and inserts data into a storage layer, such as ClickHouse! The code was developed under PR 44520 and is available in the ClickHouse repository for reuse. It just reads the values from the event, optionally anonymizes sensitive information for private repositories, and inserts the data in our public playground ClickHouse instance.
If you need a ClickHouse cluster, a development instance in ClickHouse Cloud is more than enough for this use case. Spin up a cluster on a free trial in minutes, let us deal with the infrastructure and get querying!
ClickHouse
Finally, in ClickHouse, you need to create a table to receive the events:
CREATE TABLE default.workflow_jobs
(
    `id` UInt64,
    `run_id` UInt64,
    `workflow_name` LowCardinality(String),
    `head_branch` LowCardinality(String),
    `run_url` String,
    `run_attempt` UInt16,
    `node_id` String,
    `head_sha` String,
    `url` String,
    `html_url` String,
    `status` Enum8('queued' = 1, 'in_progress' = 2, 'completed' = 3, 'waiting' = 4),
    `conclusion` LowCardinality(String),
    `started_at` DateTime,
    `completed_at` DateTime,
    `name` LowCardinality(String),
    `steps` UInt16,
    `check_run_url` String,
    `labels` Array(LowCardinality(String)),
    `runner_id` UInt64,
    `runner_name` String,
    `runner_group_id` UInt64,
    `runner_group_name` LowCardinality(String),
    `repository` LowCardinality(String),
    `updated_at` DateTime DEFAULT now()
)
ENGINE = MergeTree
PARTITION BY toStartOfMonth(started_at)
ORDER BY (id, updated_at)
The result
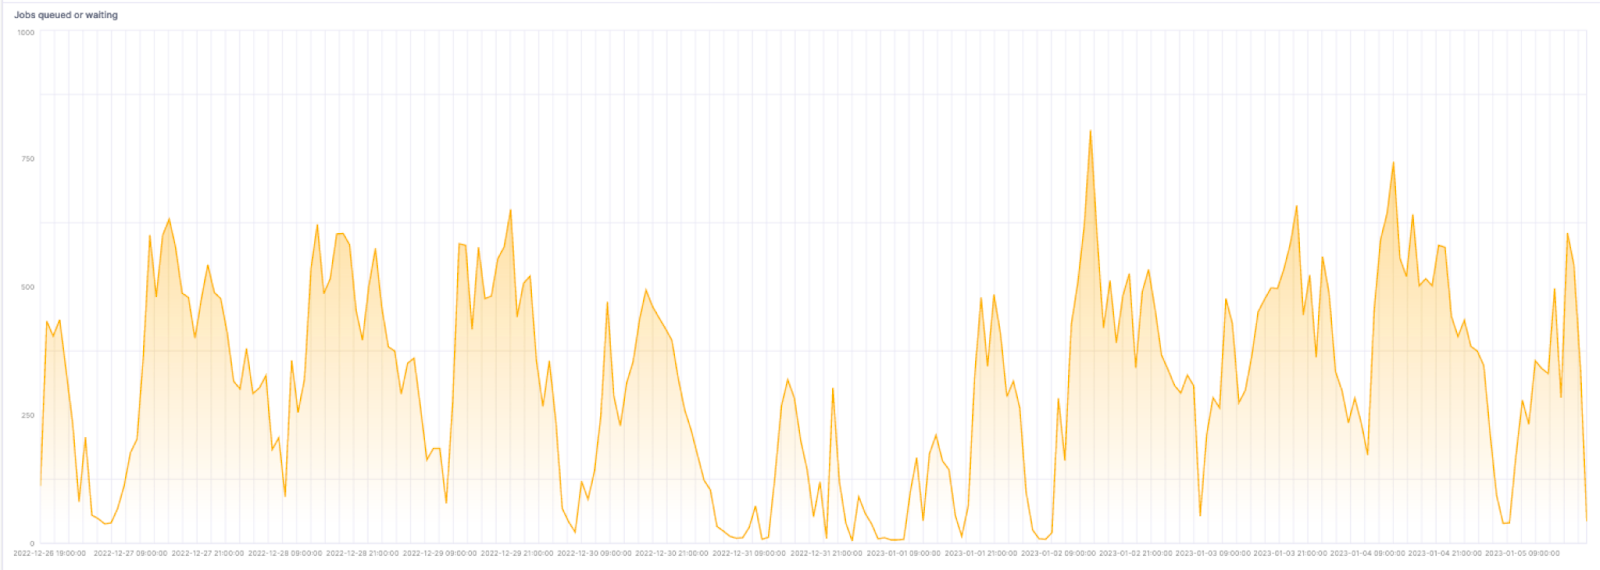
After some events are received, getting as much info as we need is trivial. Suppose want to see the number of jobs queued or waiting over the last 10 days. If using ClickHouse Cloud you can even visualize the results of this query with SQL console:
SELECT
    uniq(id) as num_jobs,
    toStartOfHour(started_at) as hour
FROM default.workflow_jobs
WHERE has(labels, 'self-hosted') AND status IN ('in_progress', 'waiting')
    AND started_at > now() - INTERVAL 10 DAY
GROUP BY hour
ORDER BY hour ASC
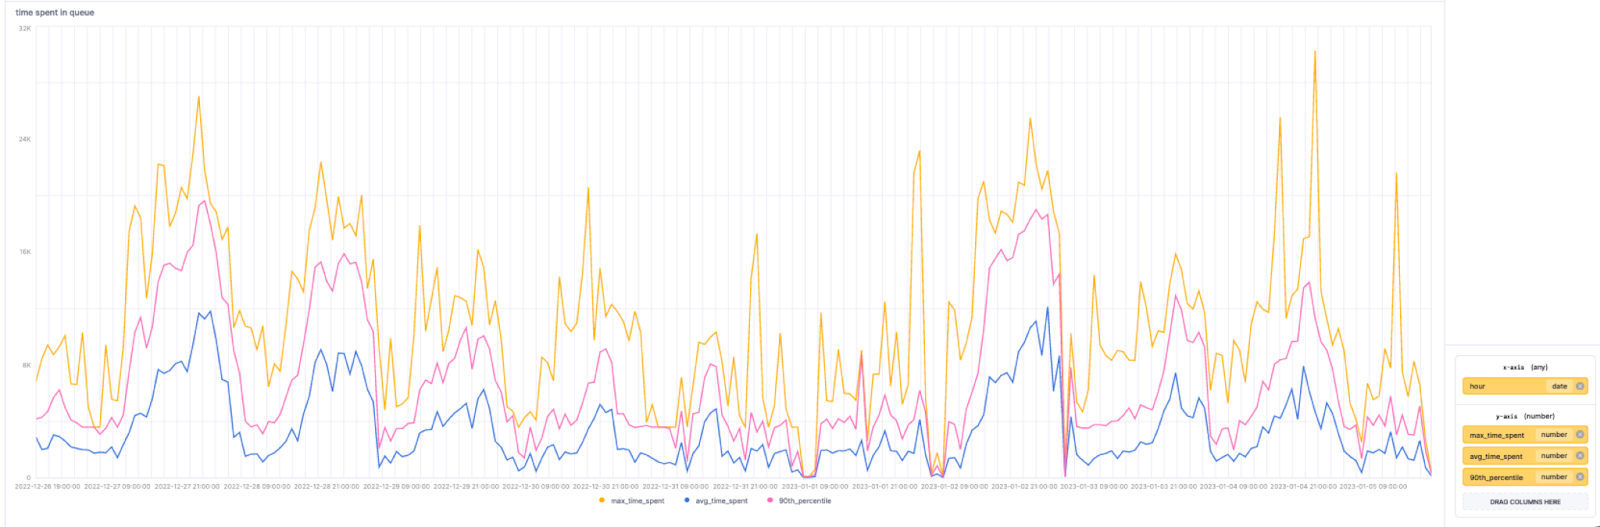
A more interesting query might be to show the total time jobs spend in the queue by the time of day. Here we include the average, max and 90th percentile:
SELECT max(time_spent) as max_time_spent, avg(time_spent) as avg_time_spent, quantile(0.9)(time_spent) as 90th_percentile, toStartOfHour(start_time) as hour FROM (
    SELECT
        max(workflow_jobs.completed_at) - min(workflow_jobs.started_at) as time_spent,
        argMax(status,updated_at) as last_event,
        id,
        min(started_at) as start_time
    FROM default.workflow_jobs
    WHERE has(labels, 'self-hosted')
        AND started_at > now() - INTERVAL 10 DAY
    GROUP BY id HAVING last_event = 'completed'
) GROUP BY hour ORDER BY hour ASC
Finally, with a little more complexity we can see the current ClickHouse queue size for self-managed GitHub Runners:
SELECT
    last_status,
    count() AS queue,
    labels
FROM
(
    SELECT
        argMax(status, updated_at) AS last_status,
        labels,
        id,
        html_url
    FROM default.workflow_jobs
    WHERE has(labels, 'self-hosted') AND (started_at > (now() - toIntervalDay(2)))
    GROUP BY ALL
    HAVING last_status != 'completed'
)
GROUP BY ALL
ORDER BY
    labels ASC,
    last_status ASC
The result will look like the following:

Summary
In this post, we've shown how you can use ClickHouse and GitHub Webhooks to monitor the queues for the jobs of your GitHub Actions.


