It’s 3 a.m. when the PagerDuty alert goes off. Groggy and disoriented, the DevOps engineer reaches for her phone. She sees the Slack notifications piling up, the war room already abuzz. One of her teammates scans through logs in Loki, trying to find the source of the problem. Another checks Prometheus to look at system metrics. Desperate for clues, she pulls up Datadog’s tracing tool, hoping to connect the dots.
"By that time, it’s already been 10 minutes," says Aditya Godbole, CTO of Last9. "Now the VP is breathing down your neck, asking, ‘Why isn’t this fixed already? We’re losing revenue.’"
It's a familiar story for today’s engineering teams, who rely on a growing number of tools to monitor applications, debug issues, and ensure system reliability. Logs, metrics, and traces - the core pillars of observability - are scattered across products, dashboards, and data stores, making it harder than ever to correlate signals and diagnose patterns. Meanwhile, costs pile up as each vendor charges separately for ingestion, storage, and querying.
Last9 saw an opportunity to fix this fragmentation problem. Instead of treating logs, metrics, and traces as separate data streams, they built an observability platform that centralizes telemetry data, making it easier, faster, and more cost-effective to analyze.
At recent ClickHouse meetups in Mumbai and Bangalore, Aditya and developer evangelist Prathamesh Sonpatki shared how Last9 is calming the storm of modern observability—including how ClickHouse lets them process massive telemetry workloads at scale.
The state of observability today #
For small teams, self-hosted observability stacks can work - at least for a while. But for larger enterprises with distributed systems spanning microservices, cloud environments, and third-party APIs, managing telemetry data in-house quickly becomes unmanageable. "You need to start a mini company inside your company just to handle the scale," Aditya says.
To keep up, most modern enterprises rely on third-party vendors like Datadog, Honeycomb, Splunk, and others. While these tools are great on their own, they weren't designed to operate as a unified system. As a result, engineering teams are forced to jump between dashboards, running separate queries and manually stitching together data. The toll of this fragmentation is figurative and literal - incidents take longer to resolve, and costs soar as teams pay multiple times for the same data. "In the end, those costs fall on the end user," Aditya says.
While fragmentation is an ongoing challenge, AI-powered observability adds another layer of complexity. New AI tools promise automated root cause analysis, anomaly detection, and cost optimization, but they need full access to telemetry data to be effective. Instead of a single source of truth, enterprises duplicate data across platforms just to make AI work. "Each product requires its own agent, storage, and application," Aditya says. Every new AI-driven observability tool ends up reinventing the wheel - collecting, storing, and siloing data all over again.
In Aditya's view, the current model prioritizes vendor lock-in over operational intelligence. If organizations want faster troubleshooting, AI-powered insights, and cost efficiency, they need to rethink how they handle observability at scale. "The problem today is that people are sending data to individual apps, rather than bringing apps to the data" Aditya says. "That needs to change if we want real operational intelligence on top of telemetry data."
"The problem today is that people are sending data to individual apps, rather than bringing apps to the data. That needs to change if we want real operational intelligence on top of telemetry data."
Aditya Godbole, CTO of Last9
A unified telemetry data platform #
Founded in 2020, Last9 set out to solve the fragmentation problem with a "single-pane" solution that unifies logs, metrics, traces, and events instead of spreading them across multiple tools.
But as Aditya explains, centralizing data is only part of the equation: "People want control over their data - what they ingest, how they shape it before it goes into storage, what it costs. That control should be in the hands of the user, not dictated by vendors.".
"People want control over their data - what they ingest, how they shape it before it goes into storage, what it costs. That control should be in the hands of the user, not dictated by vendors."
Aditya Godbole, CTO of Last9
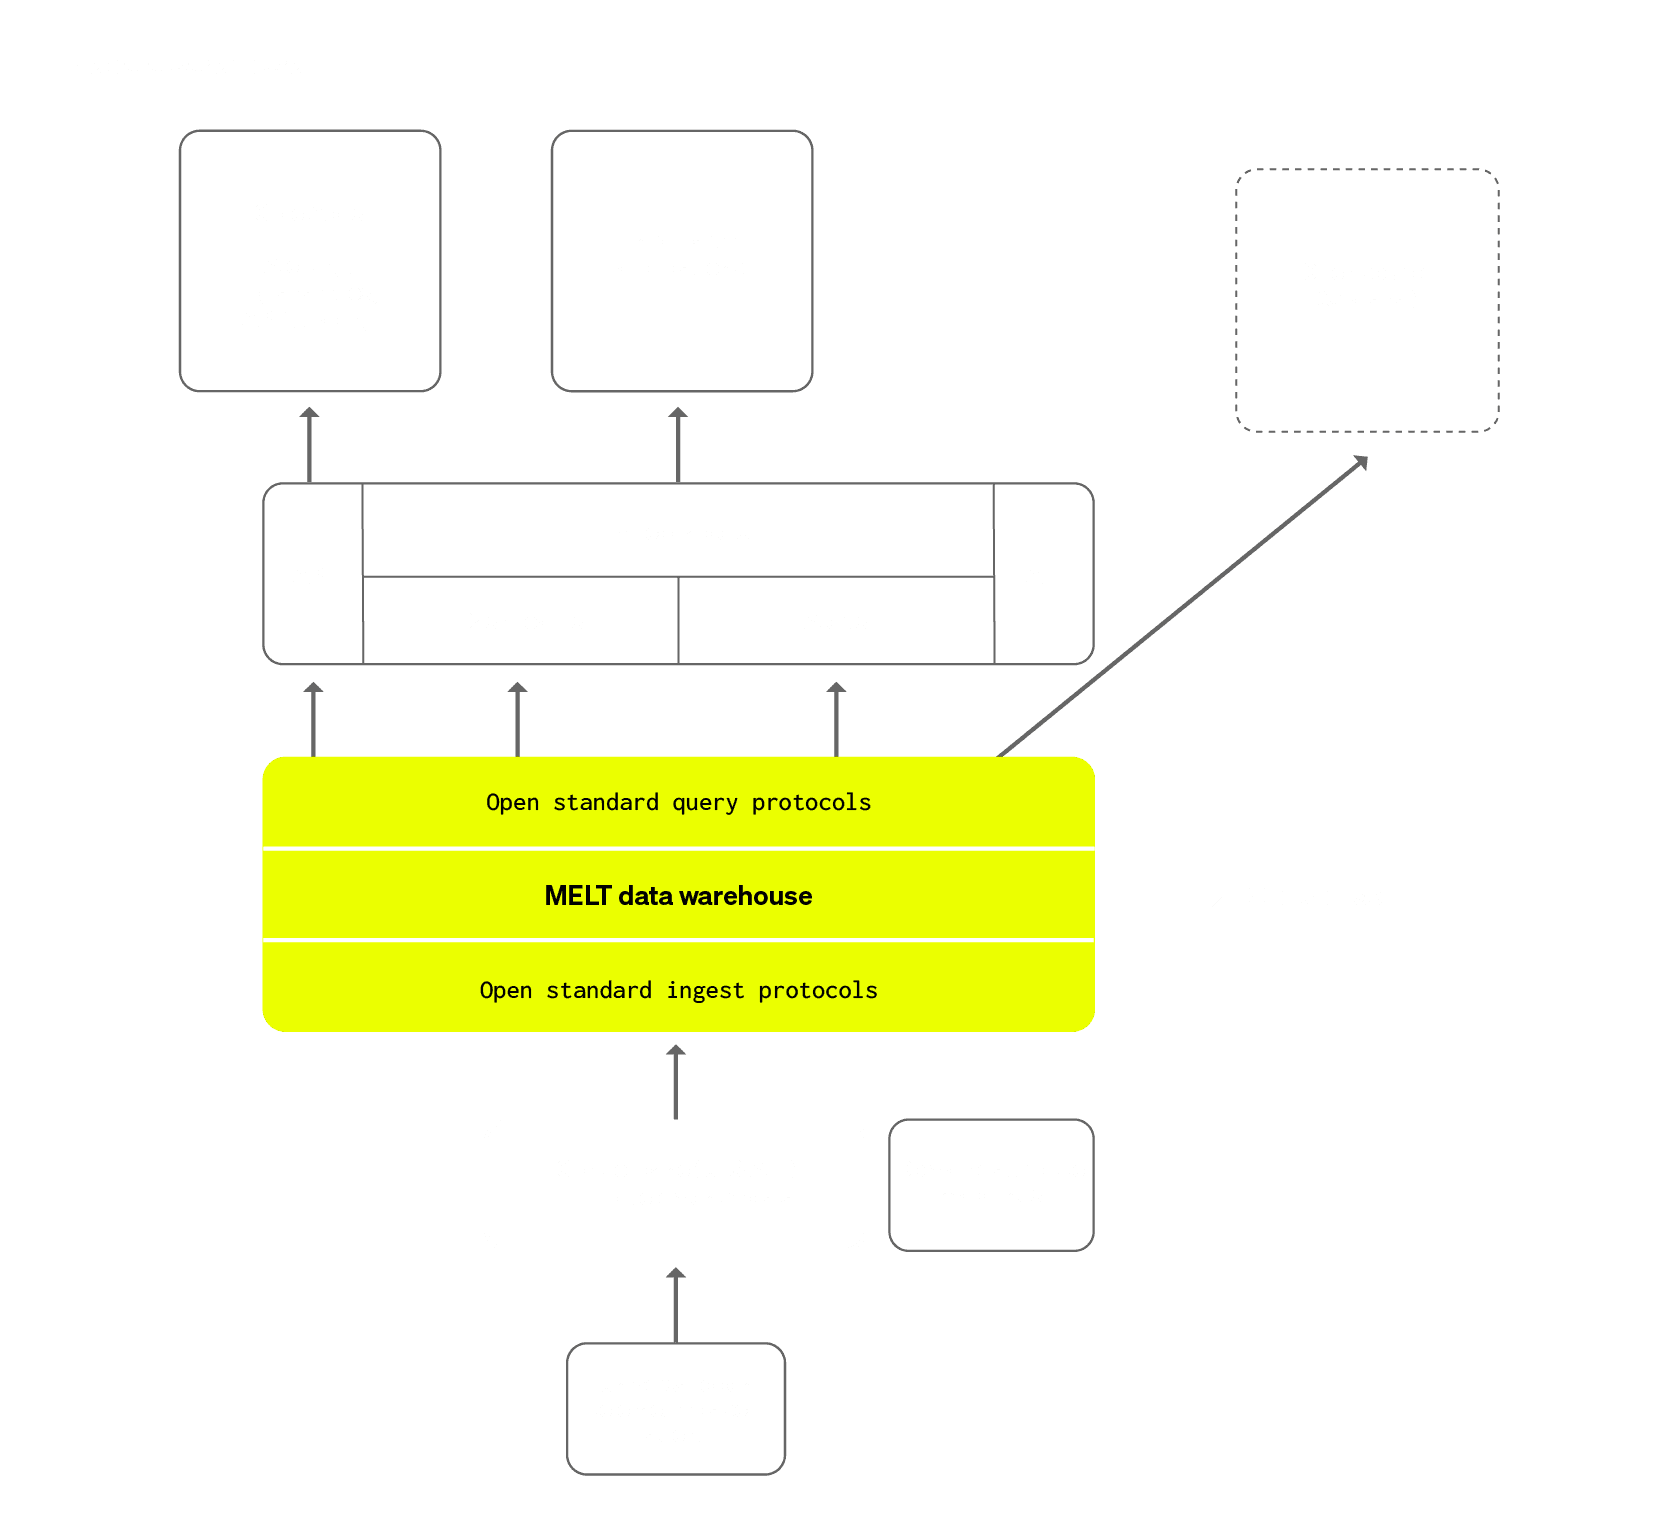
That's where Last9's telemetry control plane comes in. Without safeguards, companies face a choice: let data (and costs) grow unchecked or constantly tweak instrumentation to stay within budget. "The alternative is you go to every developer and say, 'Change your code because data ingestion is exceeding our budget,'" Aditya says. With Last9, teams can filter, reshape, and drop data in real time without instrumentation or code changes. If telemetry volume or cardinality spikes, a drop rule can be configured at runtime, putting that decision in the hands of engineers.
Along with managing ingestion, the telemetry platform layer normalizes and enriches telemetry data, making it easier to correlate events. Instead of jumping between dashboards and running separate queries for each system, engineers can analyze everything holistically, in real-time, or rehydrate archived logs for deeper historical analysis when needed.
The final piece is semantic standardization, which solves a major pain point in observability: inconsistent naming conventions. Different teams and tools often label the same data in different ways, which makes correlation difficult. "It becomes a mess," Aditya says. "If you want a single pane of glass where all the information comes to you at the click of a button, you have to have this mapped out before you start querying it." Last9 solves this by letting users remap attributes and standardize the telemetry so that logs, metrics, and traces can be queried easily.
At the end of the day, Prathamesh says, "A developer tool should meet users where they are." For Last9, that means supporting multiple query languages like PromQL, LogQL, and SQL and integrating them into existing workflows. Instead of forcing teams to abandon their current tools, it provides a structured, cost-effective layer on top, giving engineers access and control over their telemetry data, all in one place.
Why Last9 runs on ClickHouse #

At the heart of Last9's telemetry data platform is ClickHouse, a high-performance columnar database built for real-time analytics at scale. Handling logs, metrics, traces, and events requires a warehouse that can process billions of records per second without bottlenecks. After evaluating a few different solutions, Aditya says they chose ClickHouse because it was battle-tested, cost-effective, and "really blazing fast."
ClickHouse allows Last9 to store high-cardinality telemetry data while keeping queries fast and cost-efficient. Observability platforms often struggle with scalability and performance tradeoffs, but ClickHouse lets Last9 run complex queries on live data without pre-aggregation, sampling, or slowdowns. Even at extreme volumes - ingesting 480 million log lines per minute—it "scales really well," maintaining low-latency queries across massive datasets. "ClickHouse offers the best performance-to-dollar of anything in the market for our use cases" Aditya says.
"ClickHouse offers the best performance-to-dollar of anything in the market for our use cases"
Aditya Godbole, CTO of Last9
Along with raw speed, ClickHouse provides flexibility and accessibility. Unlike many observability platforms that lock users into proprietary query languages, Last9 integrates ClickHouse with PromQL, LogQL, and TraceQL, allowing engineers to use familiar syntax while benefiting from SQL's efficiency. ClickHouse's built-in engines and data modeling capabilities further optimize performance across telemetry types, whether it's efficiently storing logs, processing time-series metrics, or handling trace data at scale.
Most importantly, ClickHouse lets Aditya, Prathamesh, and the team focus on what really matters. "We want to focus on the telemetry data platform and end-user workflows," Aditya says. "We don't want to manage infrastructure or build our own data warehouse. For us, that's where ClickHouse comes in. It's an integral part of our solution today."
"We don't want to manage infrastructure or build our own data warehouse. For us, that's where ClickHouse comes in. It's an integral part of our solution today."
Aditya Godbole, CTO of Last9
Building the future of observability #
With ClickHouse at its core, Last9 is redefining observability - not just with better dashboards, but by giving teams real control over their telemetry data. While solving the problem of fragmented tooling and unpredictable costs, they’re making high-fidelity observability more scalable, efficient, and accessible. For engineers and DevOps teams, this means less guesswork, faster insights, and fewer 3 a.m. firefights.
Looking ahead, Last9 sees AI-powered observability as the next frontier. As AI-driven root cause analysis and anomaly detection gain traction, companies will need a fast, flexible data platform to support them. By combining ClickHouse’s scalability, OpenTelemetry’s standardization, and their powerful control plane, Last9 is building the future of intelligent observability.
To see how ClickHouse can bring speed and scalability to your team’s data operations, try ClickHouse Cloud free for 30 days.


