We’ve just made the BlueSky social network data available for fast, scalable querying in ClickHouse, unlocking exciting possibilities for analysis and insights. I’ve been eager to try out Evidence.dev, a powerful tool for creating dynamic, data-driven applications, and this seemed like the perfect opportunity.
In this blog, we’ll dive into what makes Evidence.dev unique and how it stands out from other tools for building data applications. Then, we’ll guide you step-by-step through creating a dashboard to explore the BlueSky dataset and uncover its potential. By the end, you’ll see how easy it is to transform raw data into actionable insights.
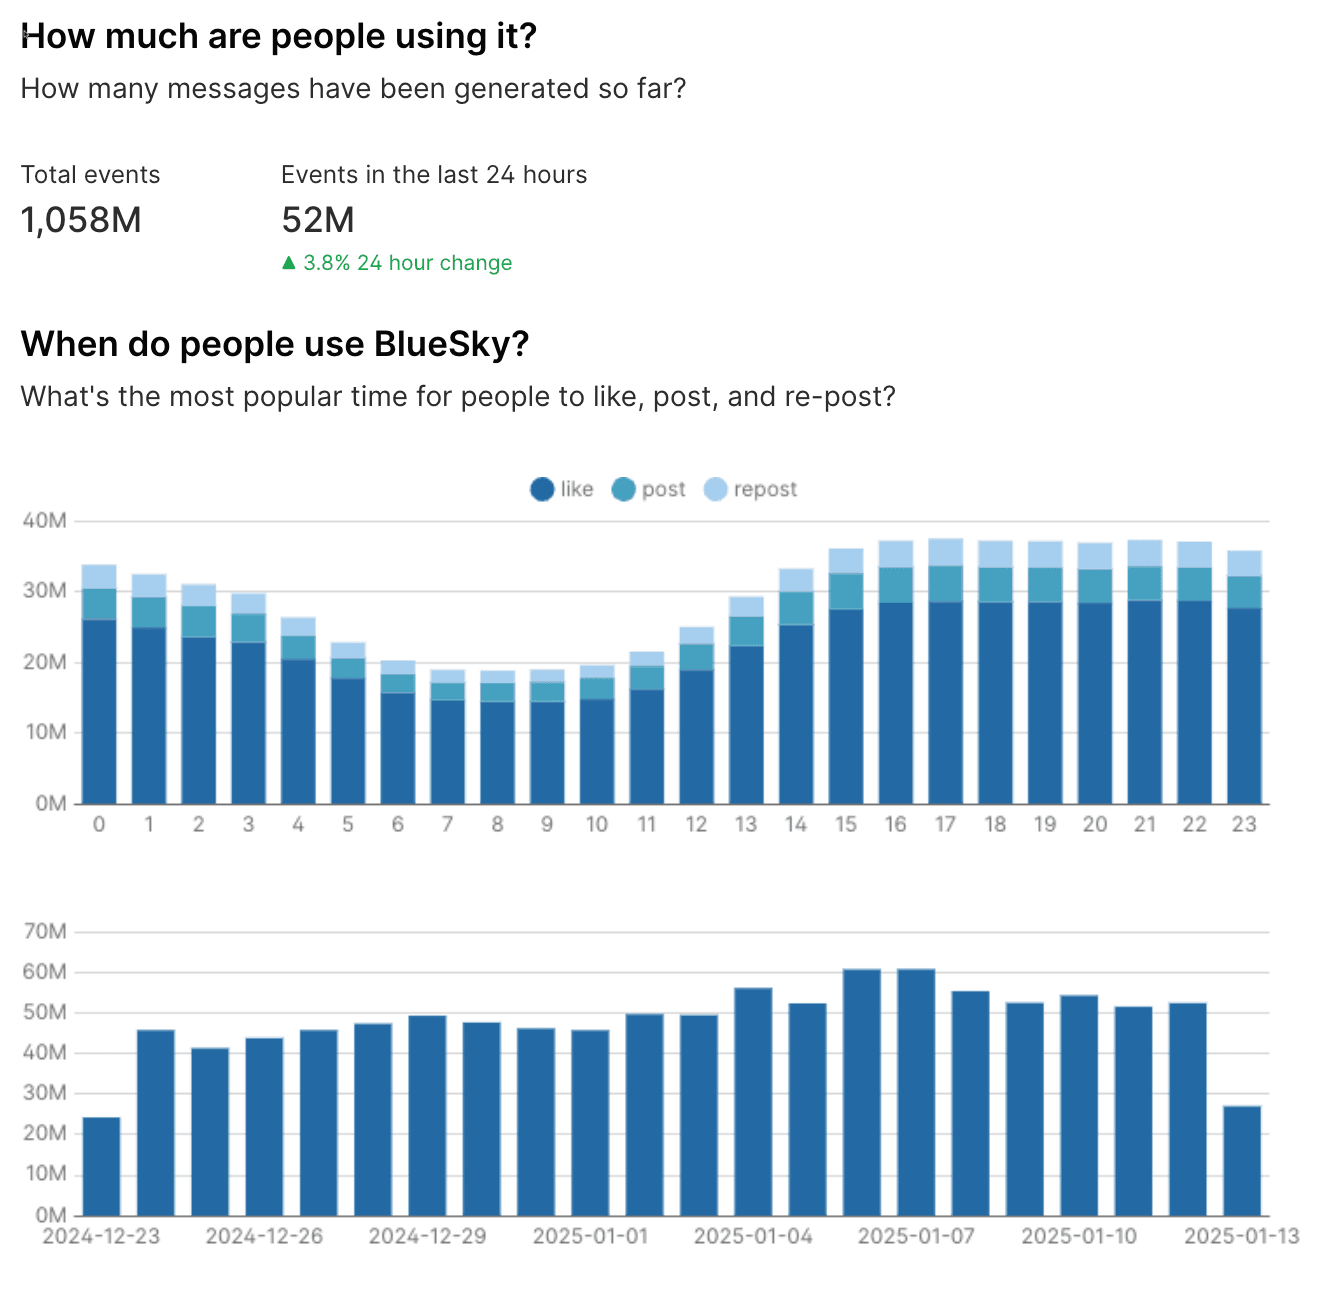
Here's a little teaser of what we're going to build:
What is Evidence? #
Evidence.dev is a lightweight, open-source framework for building data applications and business intelligence products using SQL. It offers a code-driven workflow that combines SQL, markdown, and data visualization components to create polished, interactive web applications.
The platform prioritizes user experience by delivering fast-loading pages, pre-building queries, and offering a familiar format. Evidence.dev supports version control through Git, enables easy deployment as static sites, and integrates well with various data stacks.
One of its key features is the ability to create dynamic, templated pages and publication-quality graphics. This makes it easier for data teams to present data narratives and metrics to organizations, streamlining the process of building data products and enhancing how data is communicated within companies.
Evidence.dev offers both self-hosting options and a cloud service.
How does Evidence work? #
Evidence differs from other tools because it runs your queries at build time rather than run time. This effectively means we’ve traded off data freshness for quicker page loading time and improved interactivity.
The steps involved in getting the results of a query onto the page are as follows:
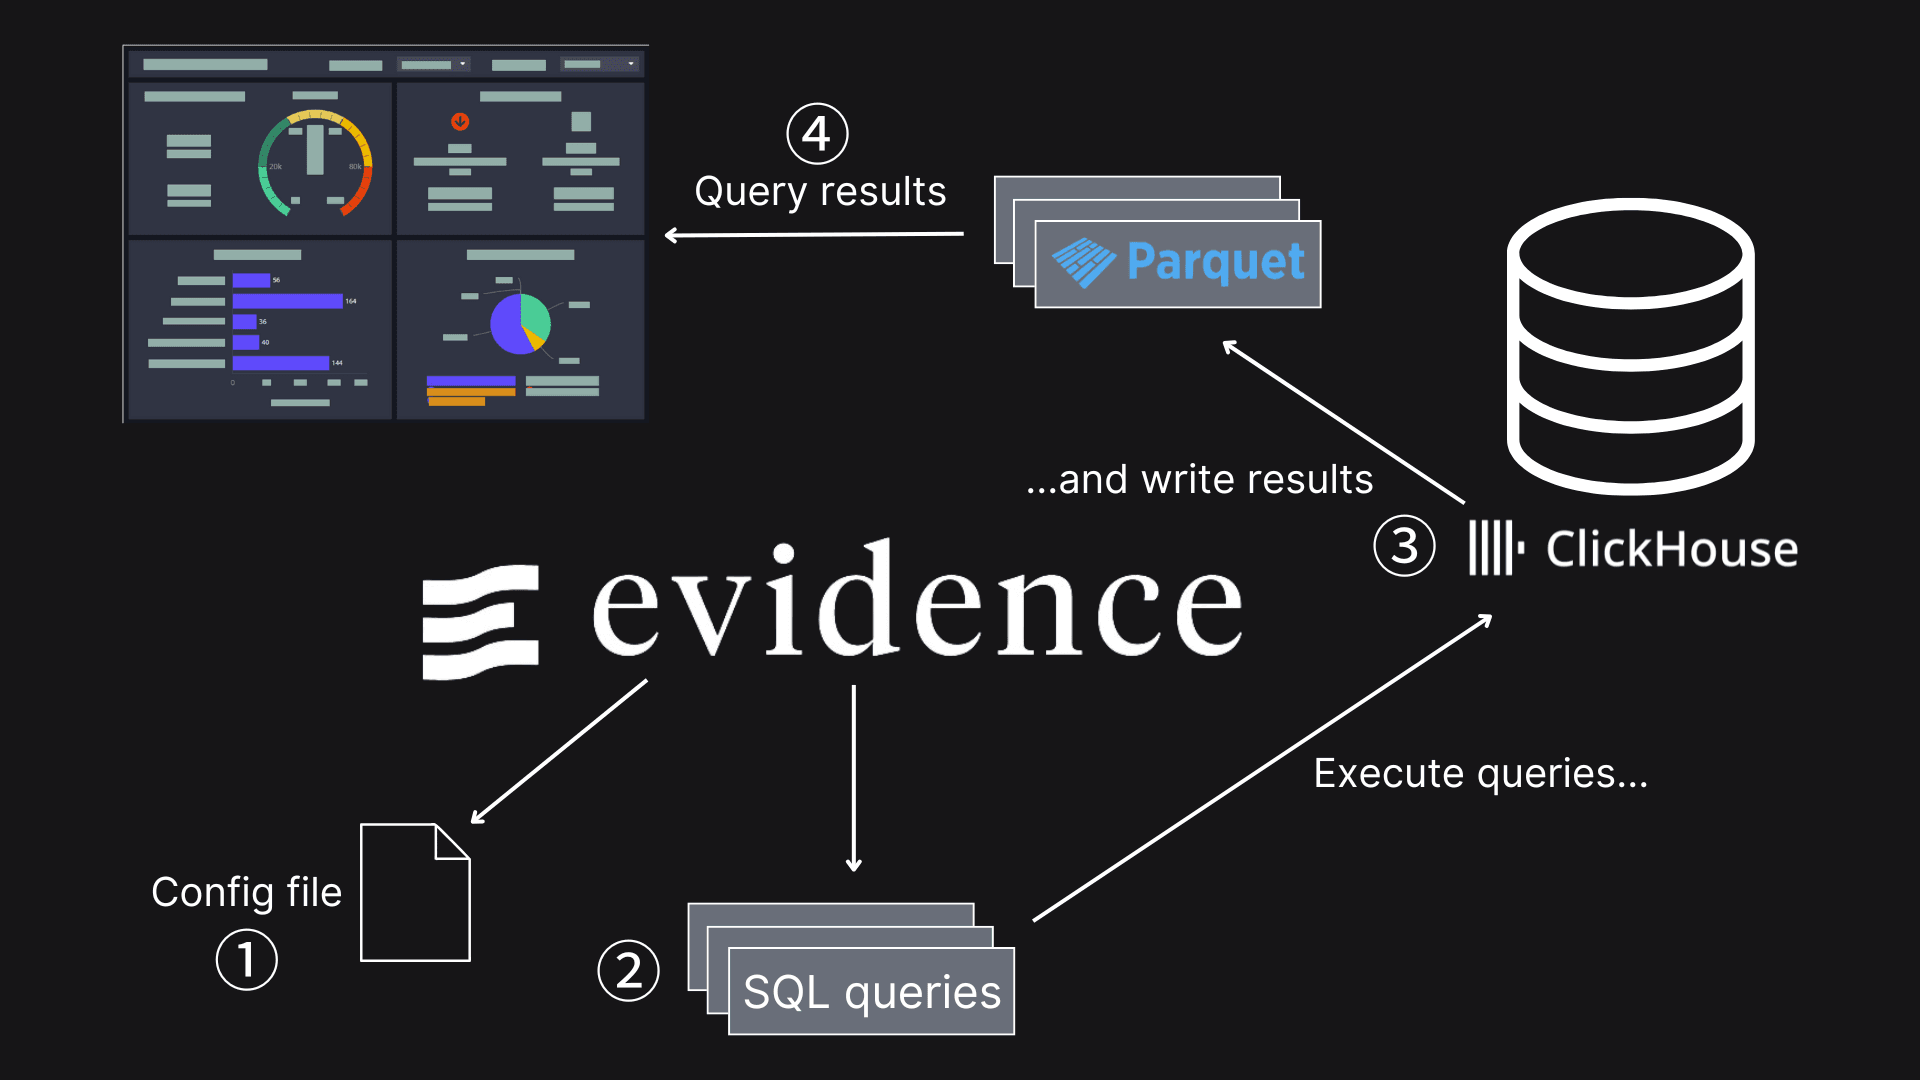
① Specify database credentials.
② Define queries to run against that database.
③ Run a command to execute those queries, storing the output in Parquet files.
④ At run-time, those Parquet files are queried.
Installing Evidence #
Let’s look at how to get Evidence.dev up and running on our machine. The easiest way is to create a project based on one of the Evidence templates. We can create a project called evidence-dashboard by running the following command:
1npx deit evidence-dev/template evidence-dashboardg
We’ve pre-prepared an Evidence project at bluesky-dashboards/evidence-dashboard, so you could clone that project instead and ignore the above step:
1git clone [email protected]:mneedham/bluesky-dashboards.git
Either way, you’ll then need to cd evidence-dashboard and get everything installed:
1npm install
This takes a while to run, so be prepared for that.
Evidence doesn’t support ClickHouse out of the box, but we can install Archie Wood’s ClickHouse connector by running the following command:
1npm install evidence-connector-clickhouse
We’ll also need to add the following line to evidence.config.yaml under plugins.datasources:
evidence-connector-clickhouse: {}
Running Evidence #
Now we’re ready to run Evidence, which we can do with the following command:
1npm run dev
Your browser should open automatically, but if it doesn't, open it and navigate to localhost in the address bar. You should see your Evidence app.
What you see on the screen comes from the content in pages/index.md. We’ll get to that in a minute, but first, we must configure a connection to a ClickHouse instance.
Configuring connection to ClickHouse #
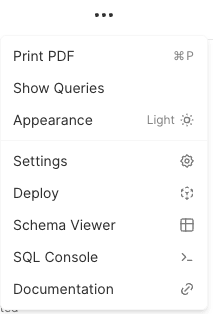
Go to https://localhost/settings or click on ‘Settings’ in the top menu:
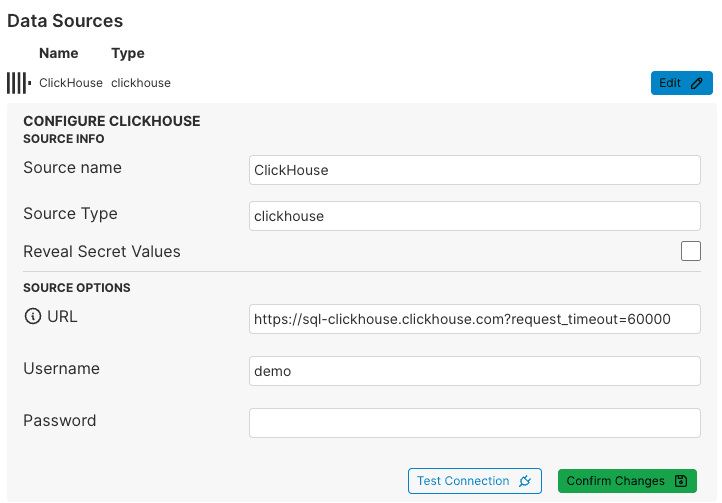
And then add a new data source. The ‘Datasource type’ should be clickhouse. The ‘Source name’ can be anything you like. We’ll use ClickHouse.
You can then specify the following values:
- URL:
https://sql-clickhouse.clickhouse.com?request_timeout=60000 - Username:
demo
You can leave the password field empty, but you'll want to provide it if you’re using your own ClickHouse instance.
Once you’ve filled in all the values, press ‘Confirm Changes’.
The configuration is written to a file under sources/<Source Name>/connection.yaml. You should find a file sources/ClickHouse/connection.yaml that contains the following content:
# This file was automatically generated
name: ClickHouse
type: clickhouse
options:
  url: https://sql-clickhouse.clickhouse.com?request_timeout=60000
  username: demo
Writing ClickHouse queries against BlueSky data #
Now, we’re ready to start writing some queries. Evidence requires you to create one query per file. Those files live under sources/<Source Name> and should have a .sql suffix.
For example, the following query, time_of_day.sql, computes the number of events per day:
SELECT event, hour_of_day, sum(count) as count
FROM bluesky.events_per_hour_of_day
WHERE event in ['post', 'repost', 'like']
GROUP BY event, hour_of_day
ORDER BY hour_of_day;
You can find a set of other queries under sources/ClickHouse.
Running ClickHouse queries with Evidence #
Once we’ve written our queries, we need to run them, which we can do by running the following command:
1npm run sources
We’ll see something like the following output:
  [Processing] ClickHouse
  events_by_day ✔ Finished, wrote 16 rows.
  messages_last_day ✔ Finished, wrote 1 rows.
  most_liked ✔ Finished, wrote 100 rows.
  most_reposted ✔ Finished, wrote 100 rows.
  posts_per_language ✔ Finished, wrote 548 rows.
  time_of_day ✔ Finished, wrote 72 rows.
  top_post_types ✔ Finished, wrote 31 rows.
  total_messages ✔ Finished, wrote 1 rows.
-----
  Evaluated sources, saving manifest
  ✅ Done!
The results of these queries are stored in Parquet files, which you can find in the .evidence directory:
find .evidence -iname \*.parquet
We’ll see the following output:
.evidence/template/static/data/ClickHouse/posts_per_language/posts_per_language.parquet
.evidence/template/static/data/ClickHouse/time_of_day/time_of_day.parquet
.evidence/template/static/data/ClickHouse/most_reposted/most_reposted.parquet
.evidence/template/static/data/ClickHouse/top_post_types/top_post_types.parquet
.evidence/template/static/data/ClickHouse/most_liked/most_liked.parquet
.evidence/template/static/data/ClickHouse/messages_last_day/messages_last_day.parquet
.evidence/template/static/data/ClickHouse/total_messages/total_messages.parquet
.evidence/template/static/data/ClickHouse/events_by_day/events_by_day.parque
These are the files that our Evidence dashboard will query.
Building an Evidence dashboard #
An Evidence dashboard can contain multiple pages, but we will start with a one-page dashboard. Dashboards are defined in markdown files, and the home page is under pages/index.md.
The markdown files can contain text in markdown format and various components that can be defined in React-style syntax.
We can give our page a title in the front matter:
---
title: BlueSky Dashboard
---
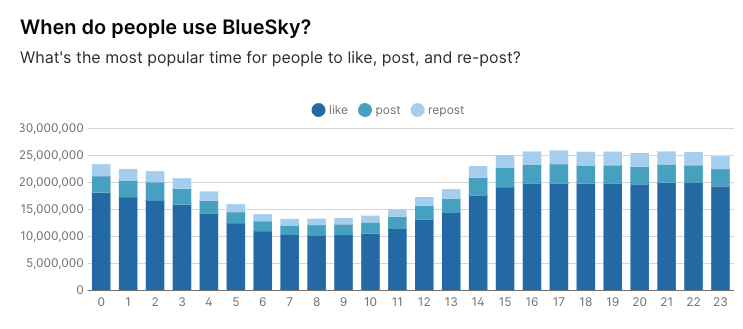
Let’s then create a bar chart showing the number of posts per day based on the time_of_day query we saw earlier.
We first add a SQL code block that queries <Source Name>.<file_name> (excluding the SQL suffix):
## When do people use BlueSky?

What's the most popular time for people to like, post, and re-post?

```sql tod
SELECT *
FROM ClickHouse.time_of_day
```
We can give that query block a name (tod), which we’ll need to refer to it later. We can then render a bar chart using the following code:
<BarChart
    data={tod}
    x=hour_of_day
    y=count
    yFmt=num0m
    series=event
/>
The ‘data’ property must refer to the query block. ‘x’ is the name of the field that we want to use on the x-axis, and ‘y’ is the name of the field for the y-axis.
If we then go back to localhost in our web browser, we’ll see the following:
Deploying to Evidence Cloud #
Evidence generates static sites by default. As mentioned, it doesn’t query our database at runtime. Instead, it queries the pre-generated Parquet files using DuckDB WASM.
We can generate the static site locally using the following command:
1npm run build
  Wrote site to "./build"
  ✔ done
Build complete --> ./build
We could serve this directory locally using an HTTP server or deploy it to a web host.
Alternatively, we can deploy to Evidence Cloud. We’ll need to publish our project to a GitHub repository to do this. This project is available at https://github.com/mneedham/bluesky-dashboards.
We can then navigate to https://evidence.app and add the repository as an Evidence project. You’ll have to choose a URL for your project and indicate when you’d like the data to be refreshed. The application will automatically be redeployed whenever you make any changes to the repository.
We’ve deployed this project to https://bluesky.evidence.app, where you can see various visualizations exploring the BlueSky dataset.
In summary #
In this post, we’ve explored how to use Evidence.dev to build a dashboard for the BlueSky dataset, from setting up the tool and configuring it with ClickHouse to running queries and visualizing results.
Evidence.dev’s approach of running queries at build time and using static-site generation makes it a practical choice for creating fast-loading, interactive dashboards.
Following the steps outlined here, you can efficiently analyze the BlueSky data and create similar dashboards to explore your datasets. You can view the completed project at bluesky.evidence.app or access the code on GitHub.


