We took a public benchmark that tests join-heavy SQL queries on Databricks and Snowflake and ran the exact same queries on ClickHouse Cloud.
ClickHouse was faster and cheaper at every scale, from 721 million to 7.2 billion rows.
TL;DR
”ClickHouse can’t do joins.” Let’s test that #
Let’s be crystal clear upfront: this is not our benchmark.
Someone else designed a coffee-shop-themed benchmark to compare cost and performance when running join-heavy queries on Databricks and Snowflake, across different compute sizes. The benchmark author shared the full dataset and query suite publicly.
Out of curiosity, we took that same benchmark, loaded the data into ClickHouse Cloud, used similar instance sizes, and ran the original 17 queries. Most queries involve joins, and we didn’t rewrite them (queries 6, 10 and 15 required minor syntax changes to work in ClickHouse SQL dialect).
We did no tuning at all, not for the queries, and not on the ClickHouse side (no changes to table schemas, indexes, settings, etc).
Next time someone says “ClickHouse can’t do joins,” just send them this blog.
We’ve spent the past 6 months making join performance radically better in ClickHouse, and this post is your first look at how far we’ve come. (Spoiler: it’s really fast. And really cheap. And we’re just getting started.)
We’ll walk through how we ran the benchmark, how you can run it too, and then walk through the full results across three dataset sizes: 721 million, 1.4 billion, and 7.2 billion rows.
Finally, we’ll wrap up with a simple takeaway: ClickHouse can do joins, and it can do it fast.
How to reproduce it #
You’ll find everything in the coffeeshop-benchmark GitHub repo, including all 17 benchmark queries, scripts, and instructions to execute the benchmark. We’ve also published the full coffeeshop-benchmark datasets in a public S3 bucket, so you can skip the generation step and jump straight to testing ClickHouse Cloud vs. Snowflake vs. Databricks.
The whole benchmark is automated: spin up a ClickHouse Cloud service, set your credentials via environment variables, and run one command with your cluster specs and price per compute unit.
Click a button. Grab a coffee. And your results are ready.
We run each query 5 times and report the fastest run, to reflect warm-cache performance fairly. See full results.
Ready to try it yourself?
Spin up your own ClickHouse Cloud service in minutes and run the benchmark end-to-end. No setup headaches, and $300 in free credits to get you started.
One dataset, many runs: how we benchmarked at scale #
To speed up the benchmarking process, we took advantage of ClickHouse Cloud Warehouses, a feature that lets you spin up multiple compute services over a single shared dataset.
We ingested the data once, then spun up additional services in different sizes, varying the number of nodes, CPU cores, and RAM, to benchmark different hardware and cost configurations.
Because all services in a ClickHouse Cloud Warehouse share the same data, we could run the same benchmark across all configurations at once, without reloading anything.
This also let us test ClickHouse Cloud’s Parallel Replicas feature, where multiple compute nodes process a single query in parallel for even faster results.
Benchmark structure #
The original benchmark was posted in two parts on LinkedIn (part 1 and part 2), using synthetic data that simulates orders at a national coffee chain. It tested three data scales for the main fact table:
| Scale factor | Total rows in fact table (Sales) |
|---|---|
| 500m | 721m |
| 1b | 1.4b |
| 5b | 7.2b |
All three data scales use the same star schema with three tables:
- Sales: the main fact table (orders)
- Products: product dimension
- Locations: store/location dimensions
The benchmark consists of 17 SQL queries, most involving joins between the fact and one or both dimension tables. All queries were run sequentially.
Part 1 of the original benchmark covered the smaller 721 million row scale, and part 2 added results for the 1.4 billion and 7.2 billion row scales.
This post mirrors the structure and layout of the original benchmark posts: same queries, same chart style, same order, just re-run to compare ClickHouse Cloud vs. Snowflake vs. Databricks. For each scale, we report:
- Total cost (USD)
- Total runtime (seconds)
- Cost per query (excluding Q10 & Q16)
- Seconds per query (excluding Q10 & Q16)
- Cost per query (Q10 & Q16 only)
- Seconds per query (Q10 & Q16 only)
Queries 10 and 16 are significantly slower than the other queries and would compress the scale of the other queries on the charts. That’s why the original posts listed them separately.
The original benchmark included both “Clustered” and “Non-clustered” variants. (Here, “Clustered” means the data was physically sorted and co-located to improve query performance, especially on large tables.) For consistency, we report only the Clustered results here.
Methodology & setup:
In the original benchmark results appear to be hot runs. We run each query 5 times and report the fastest run, to reflect warm-cache performance fairly.
All results shown here are based on the ClickHouse Cloud Scale tier, using services deployed on AWS in the us-east-2 region. The full results also include Enterprise tier costs, which still compare favorably.
All services were running ClickHouse 25.4.1, with parallel replicas enabled by default.
You’ll find the full chart sets below, presented without further commentary. All context is in the original LinkedIn posts, and we’ll wrap up with a clear takeaway.
In the charts below, ClickHouse Cloud results follow the label format CH 2n_30c_120g, where:
2n= number of compute nodes30c= CPU cores per node120g= RAM per node (in GB)
All service configurations use 30 cores and 120 GB RAM per node, with 4 service sizes tested: 2, 4, 8, and 16 compute nodes.
The label meanings for Databricks (e.g. DBX_S) and Snowflake (e.g. SF_S_Gen2) are unchanged and documented in the original posts.
Results: 500m scale (721m rows) #
This scale uses a seed of 500m orders to generate a total of 721m rows.
Total cost #
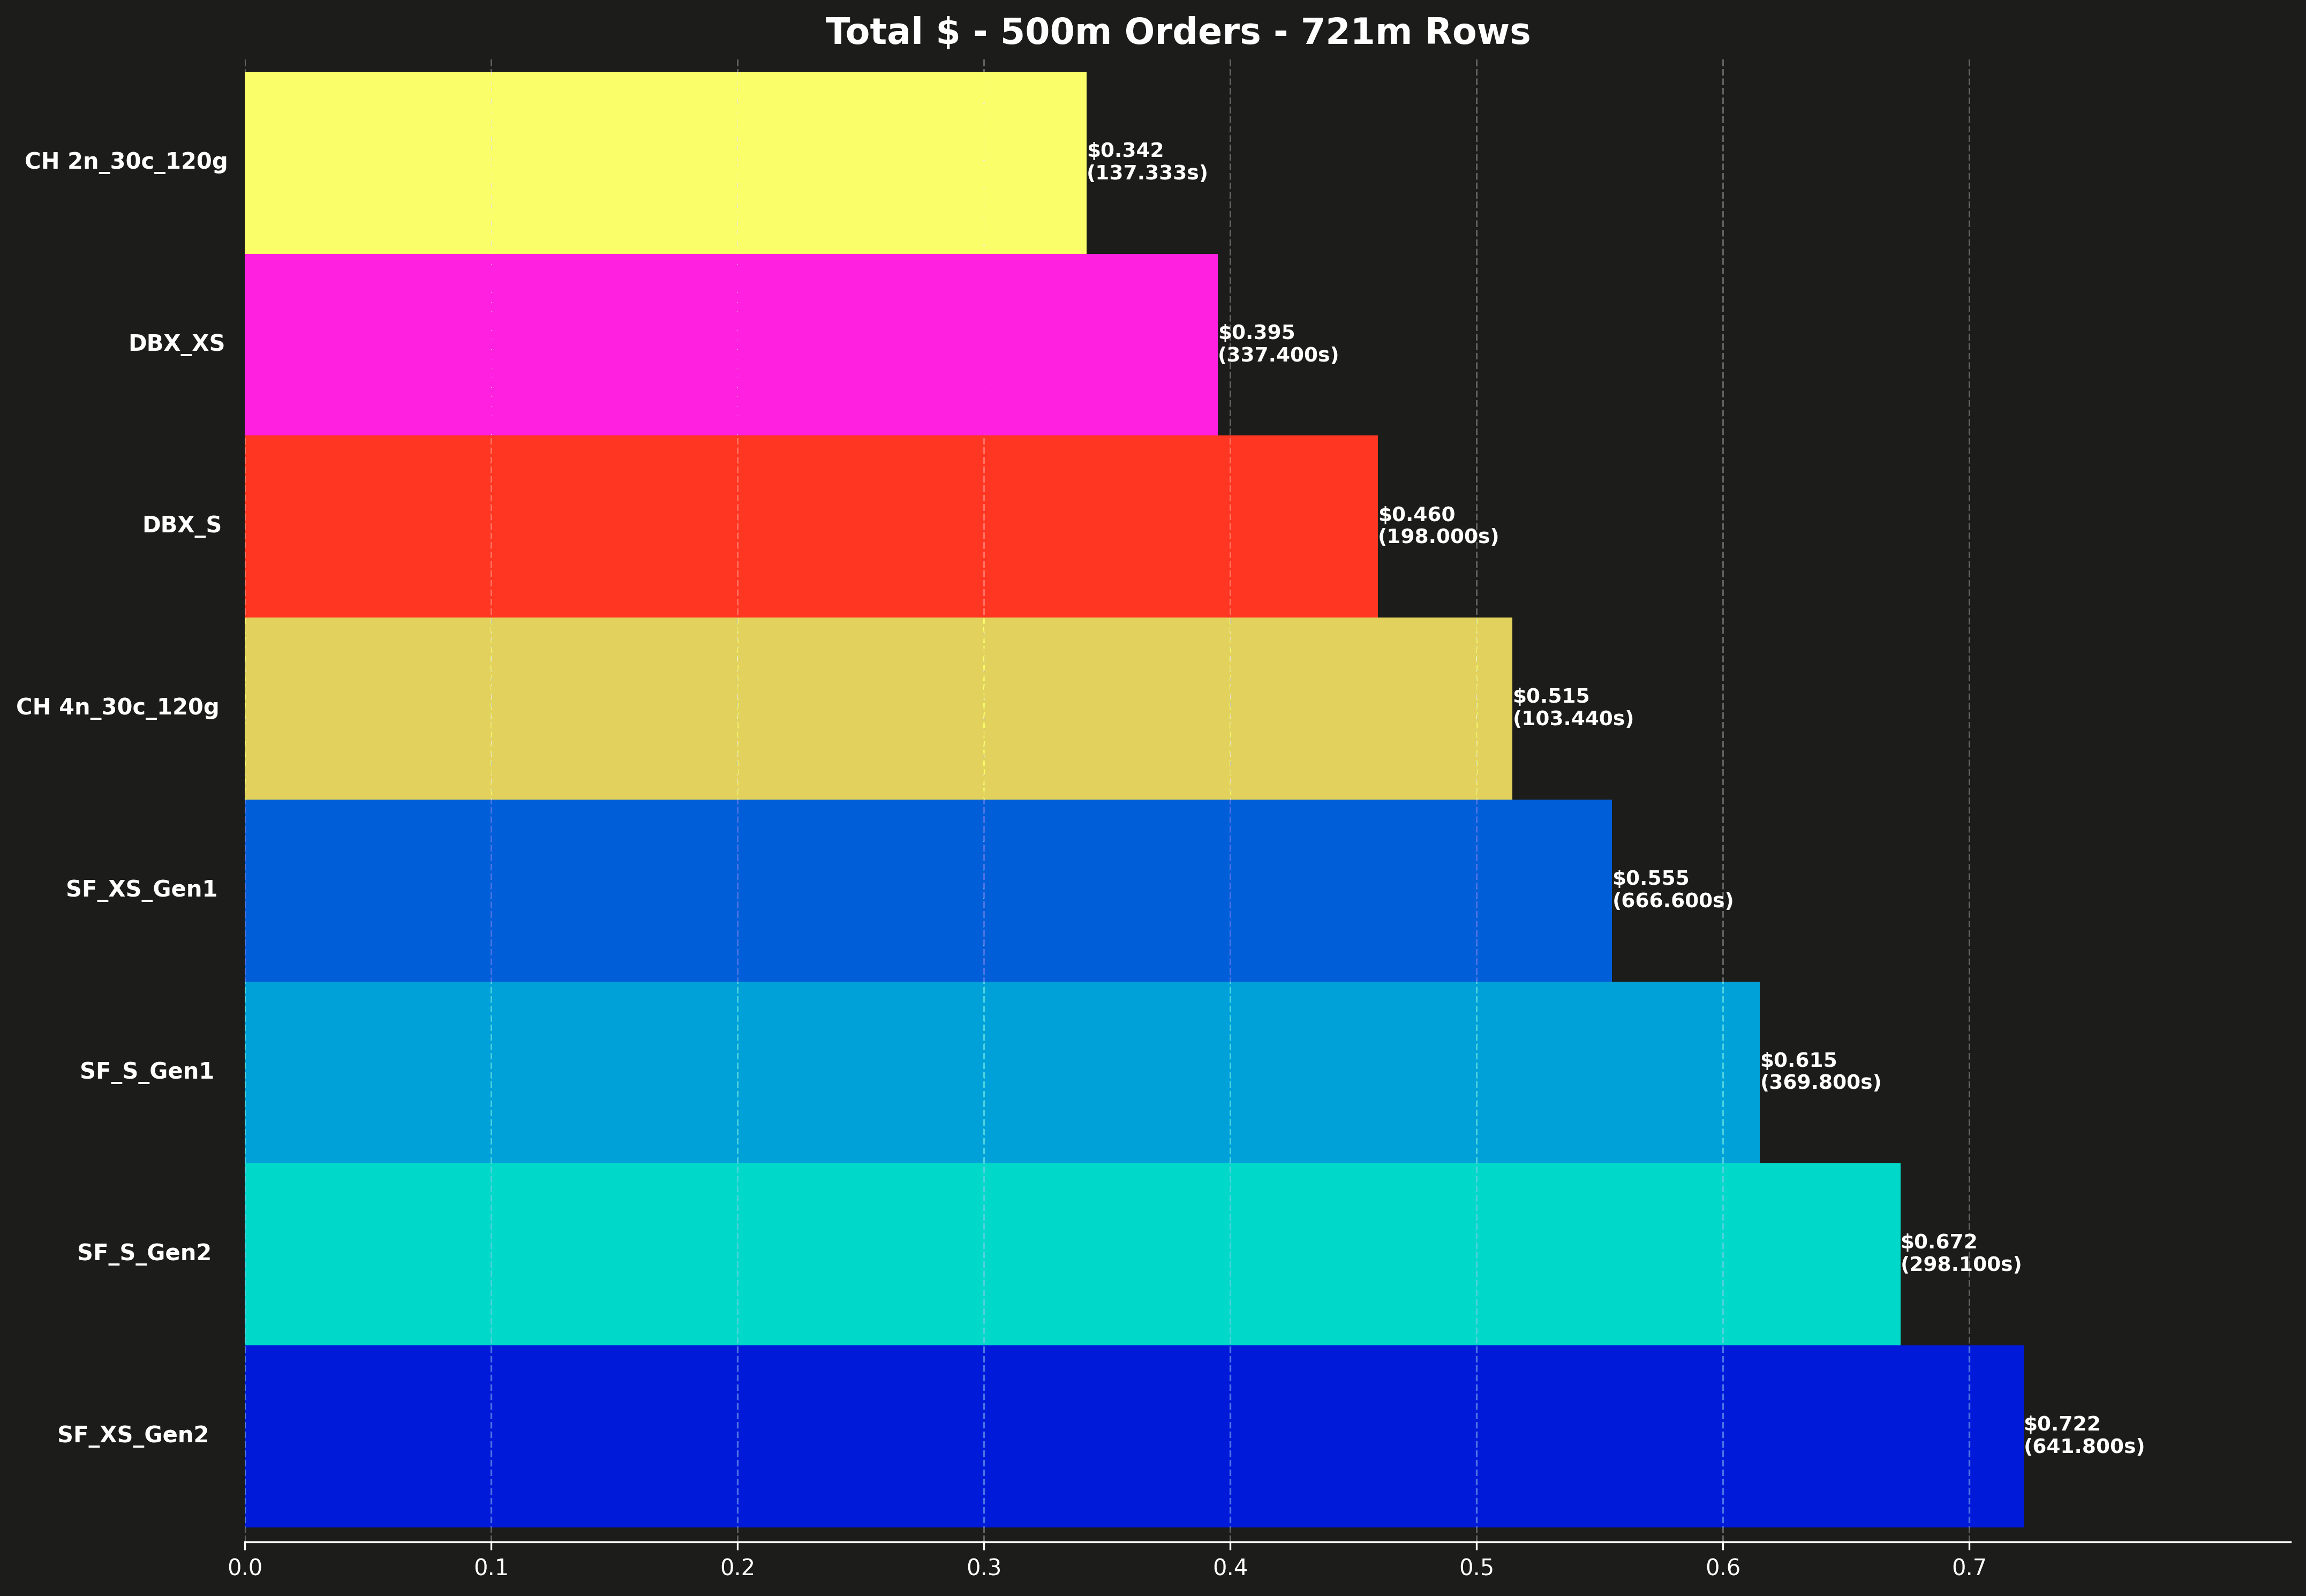
Each bar also shows the total runtime for all 17 queries, shown in parentheses.
Total runtime #
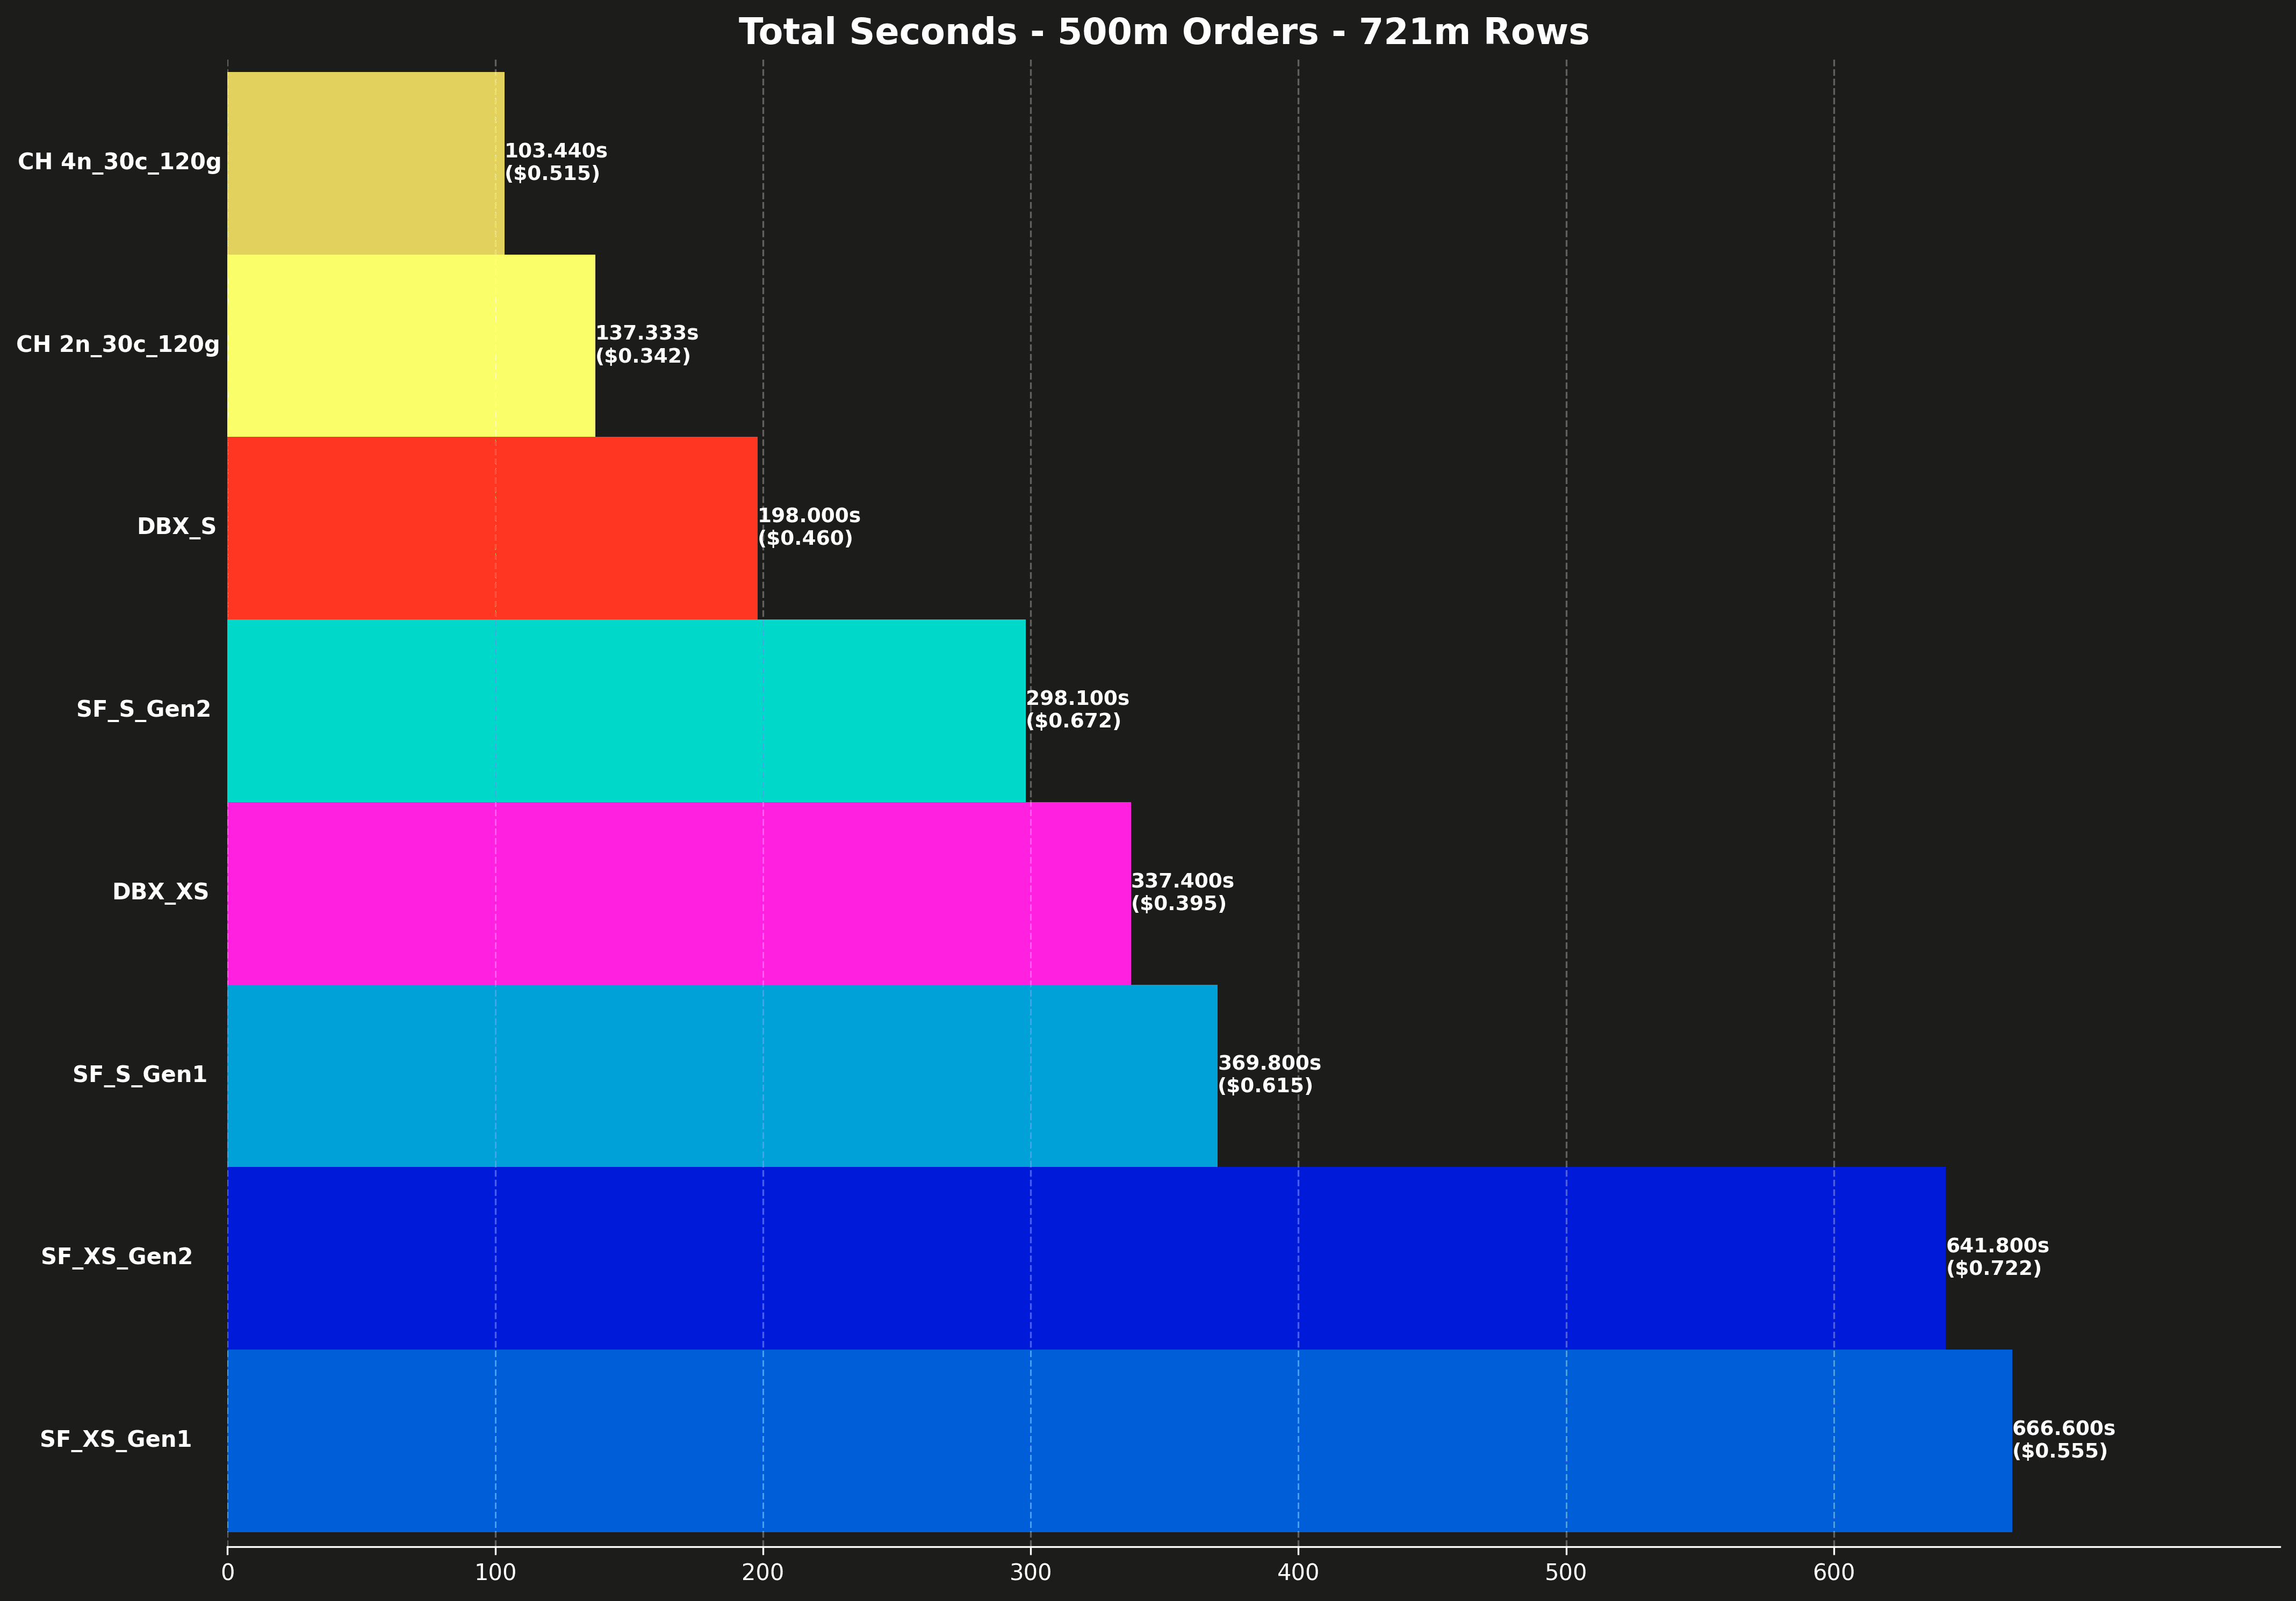
Each bar also shows the total cost for running all 17 queries, shown in parentheses.
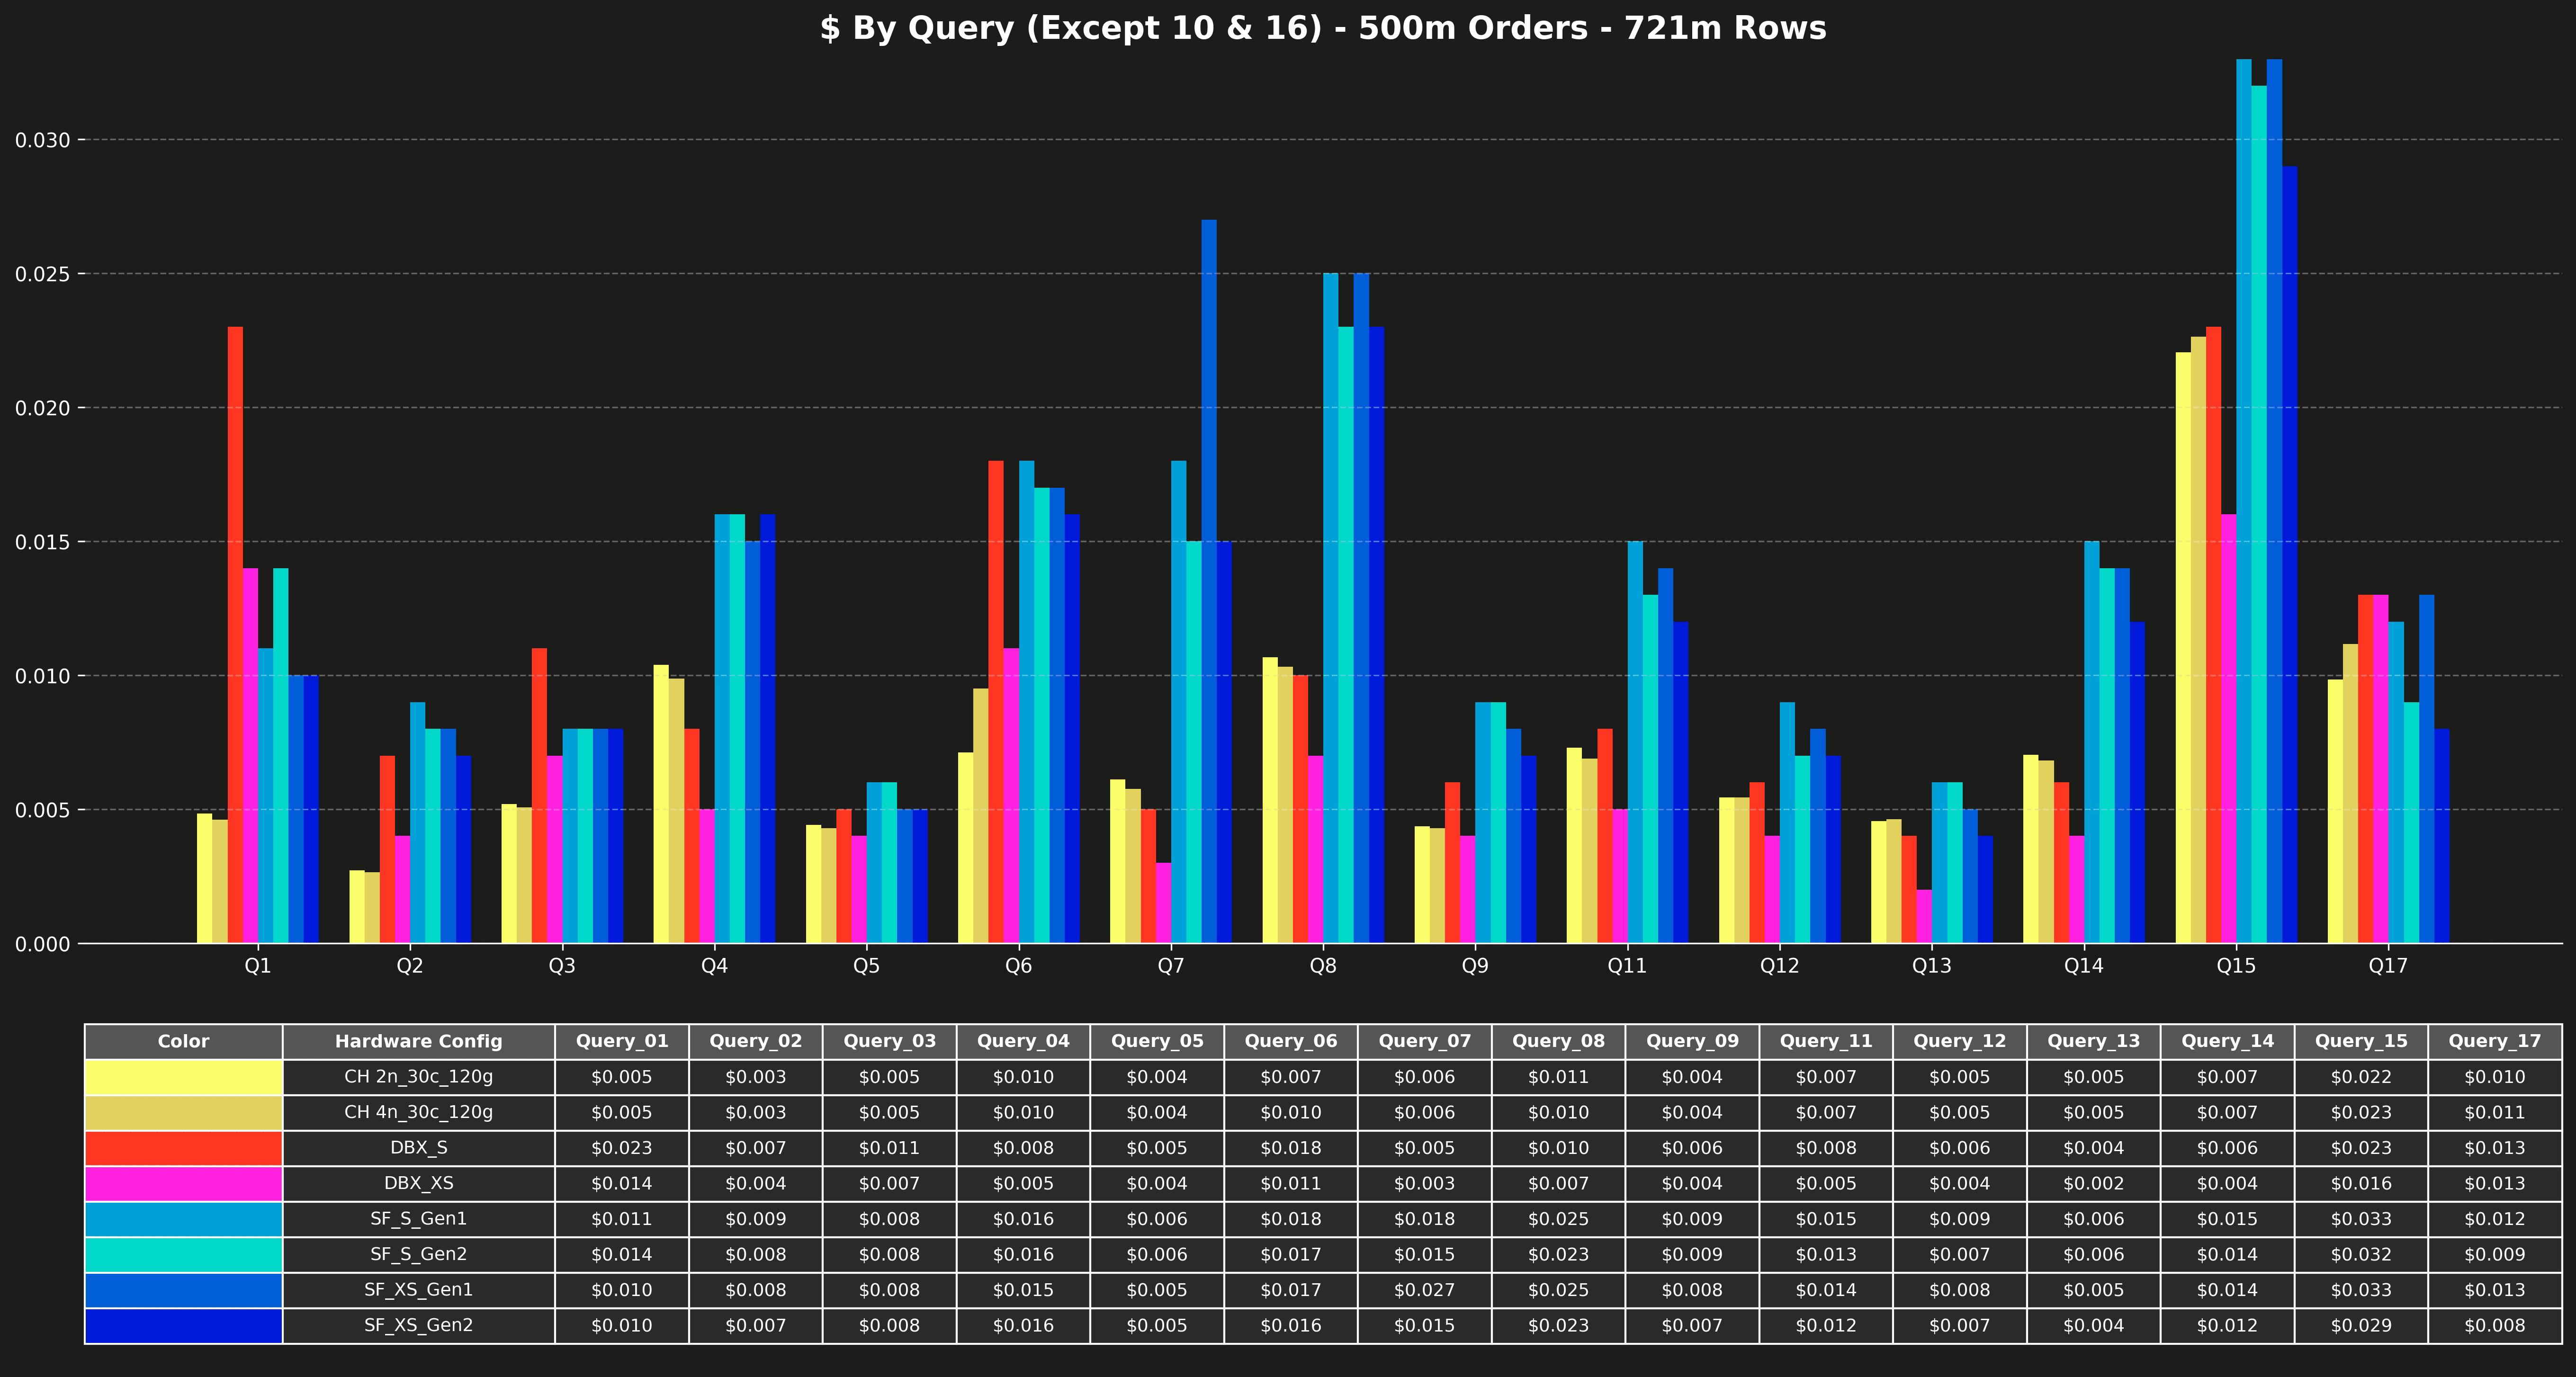
Cost per query (excluding Q10 & Q16) #
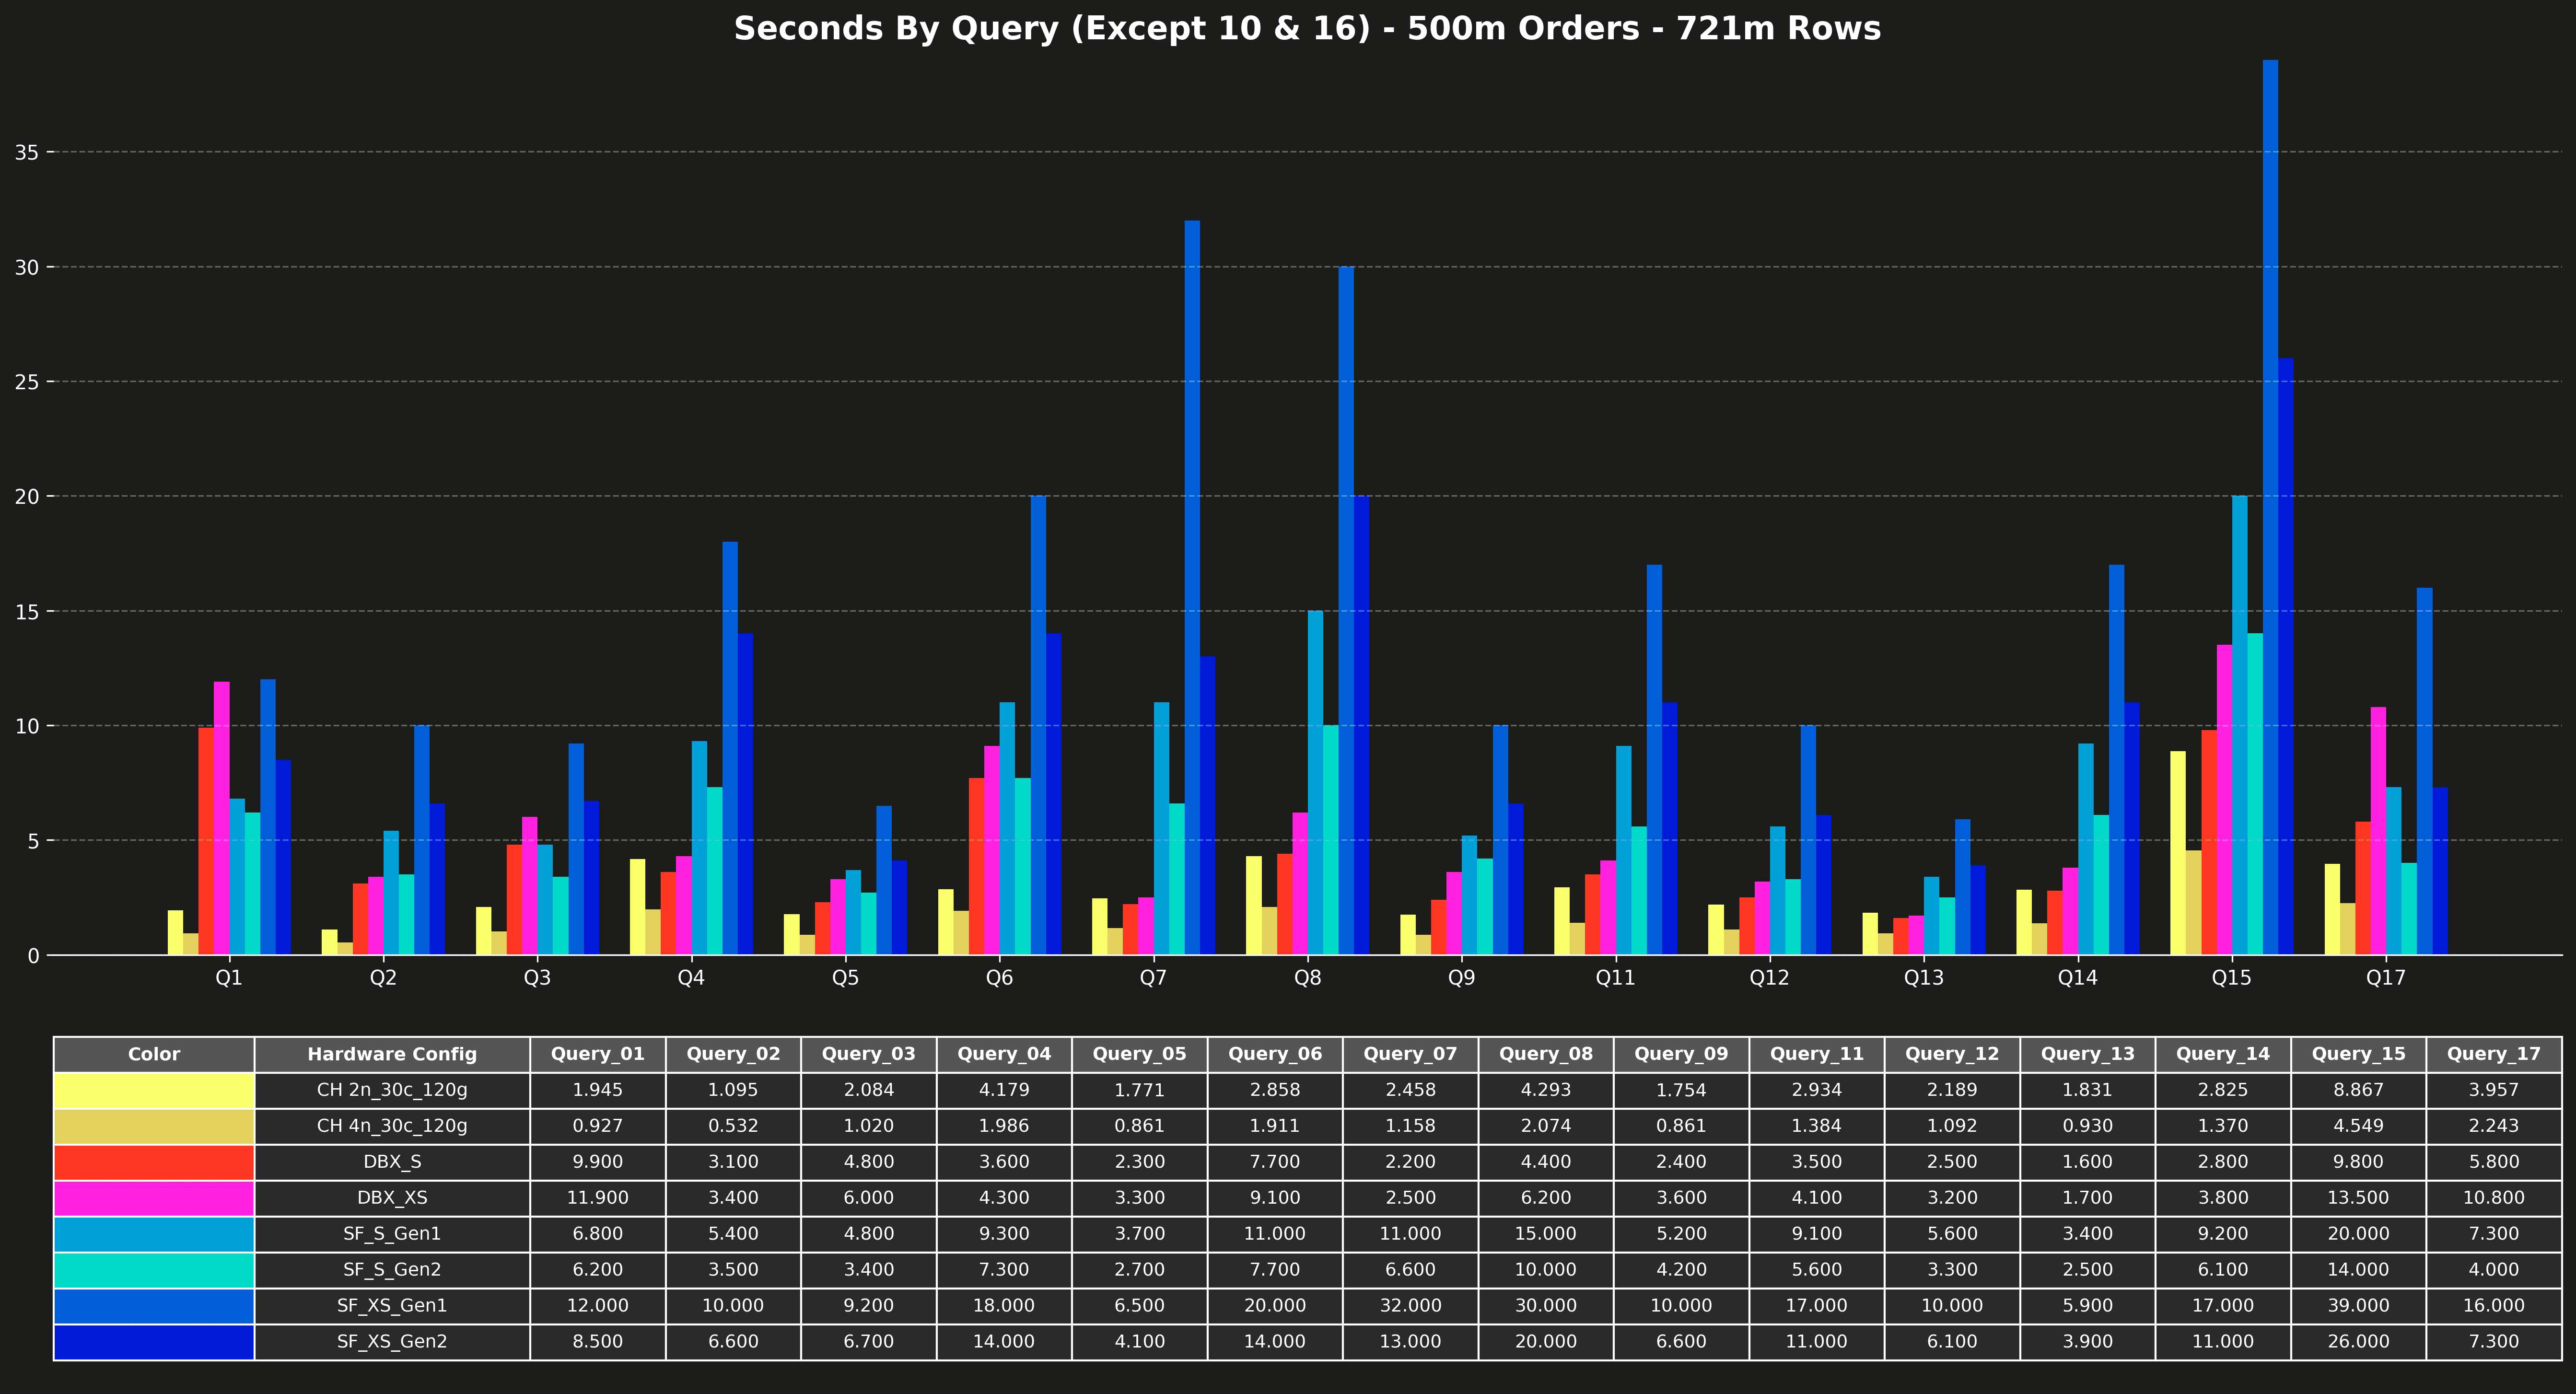
Runtime per query (excluding Q10 & Q16) #
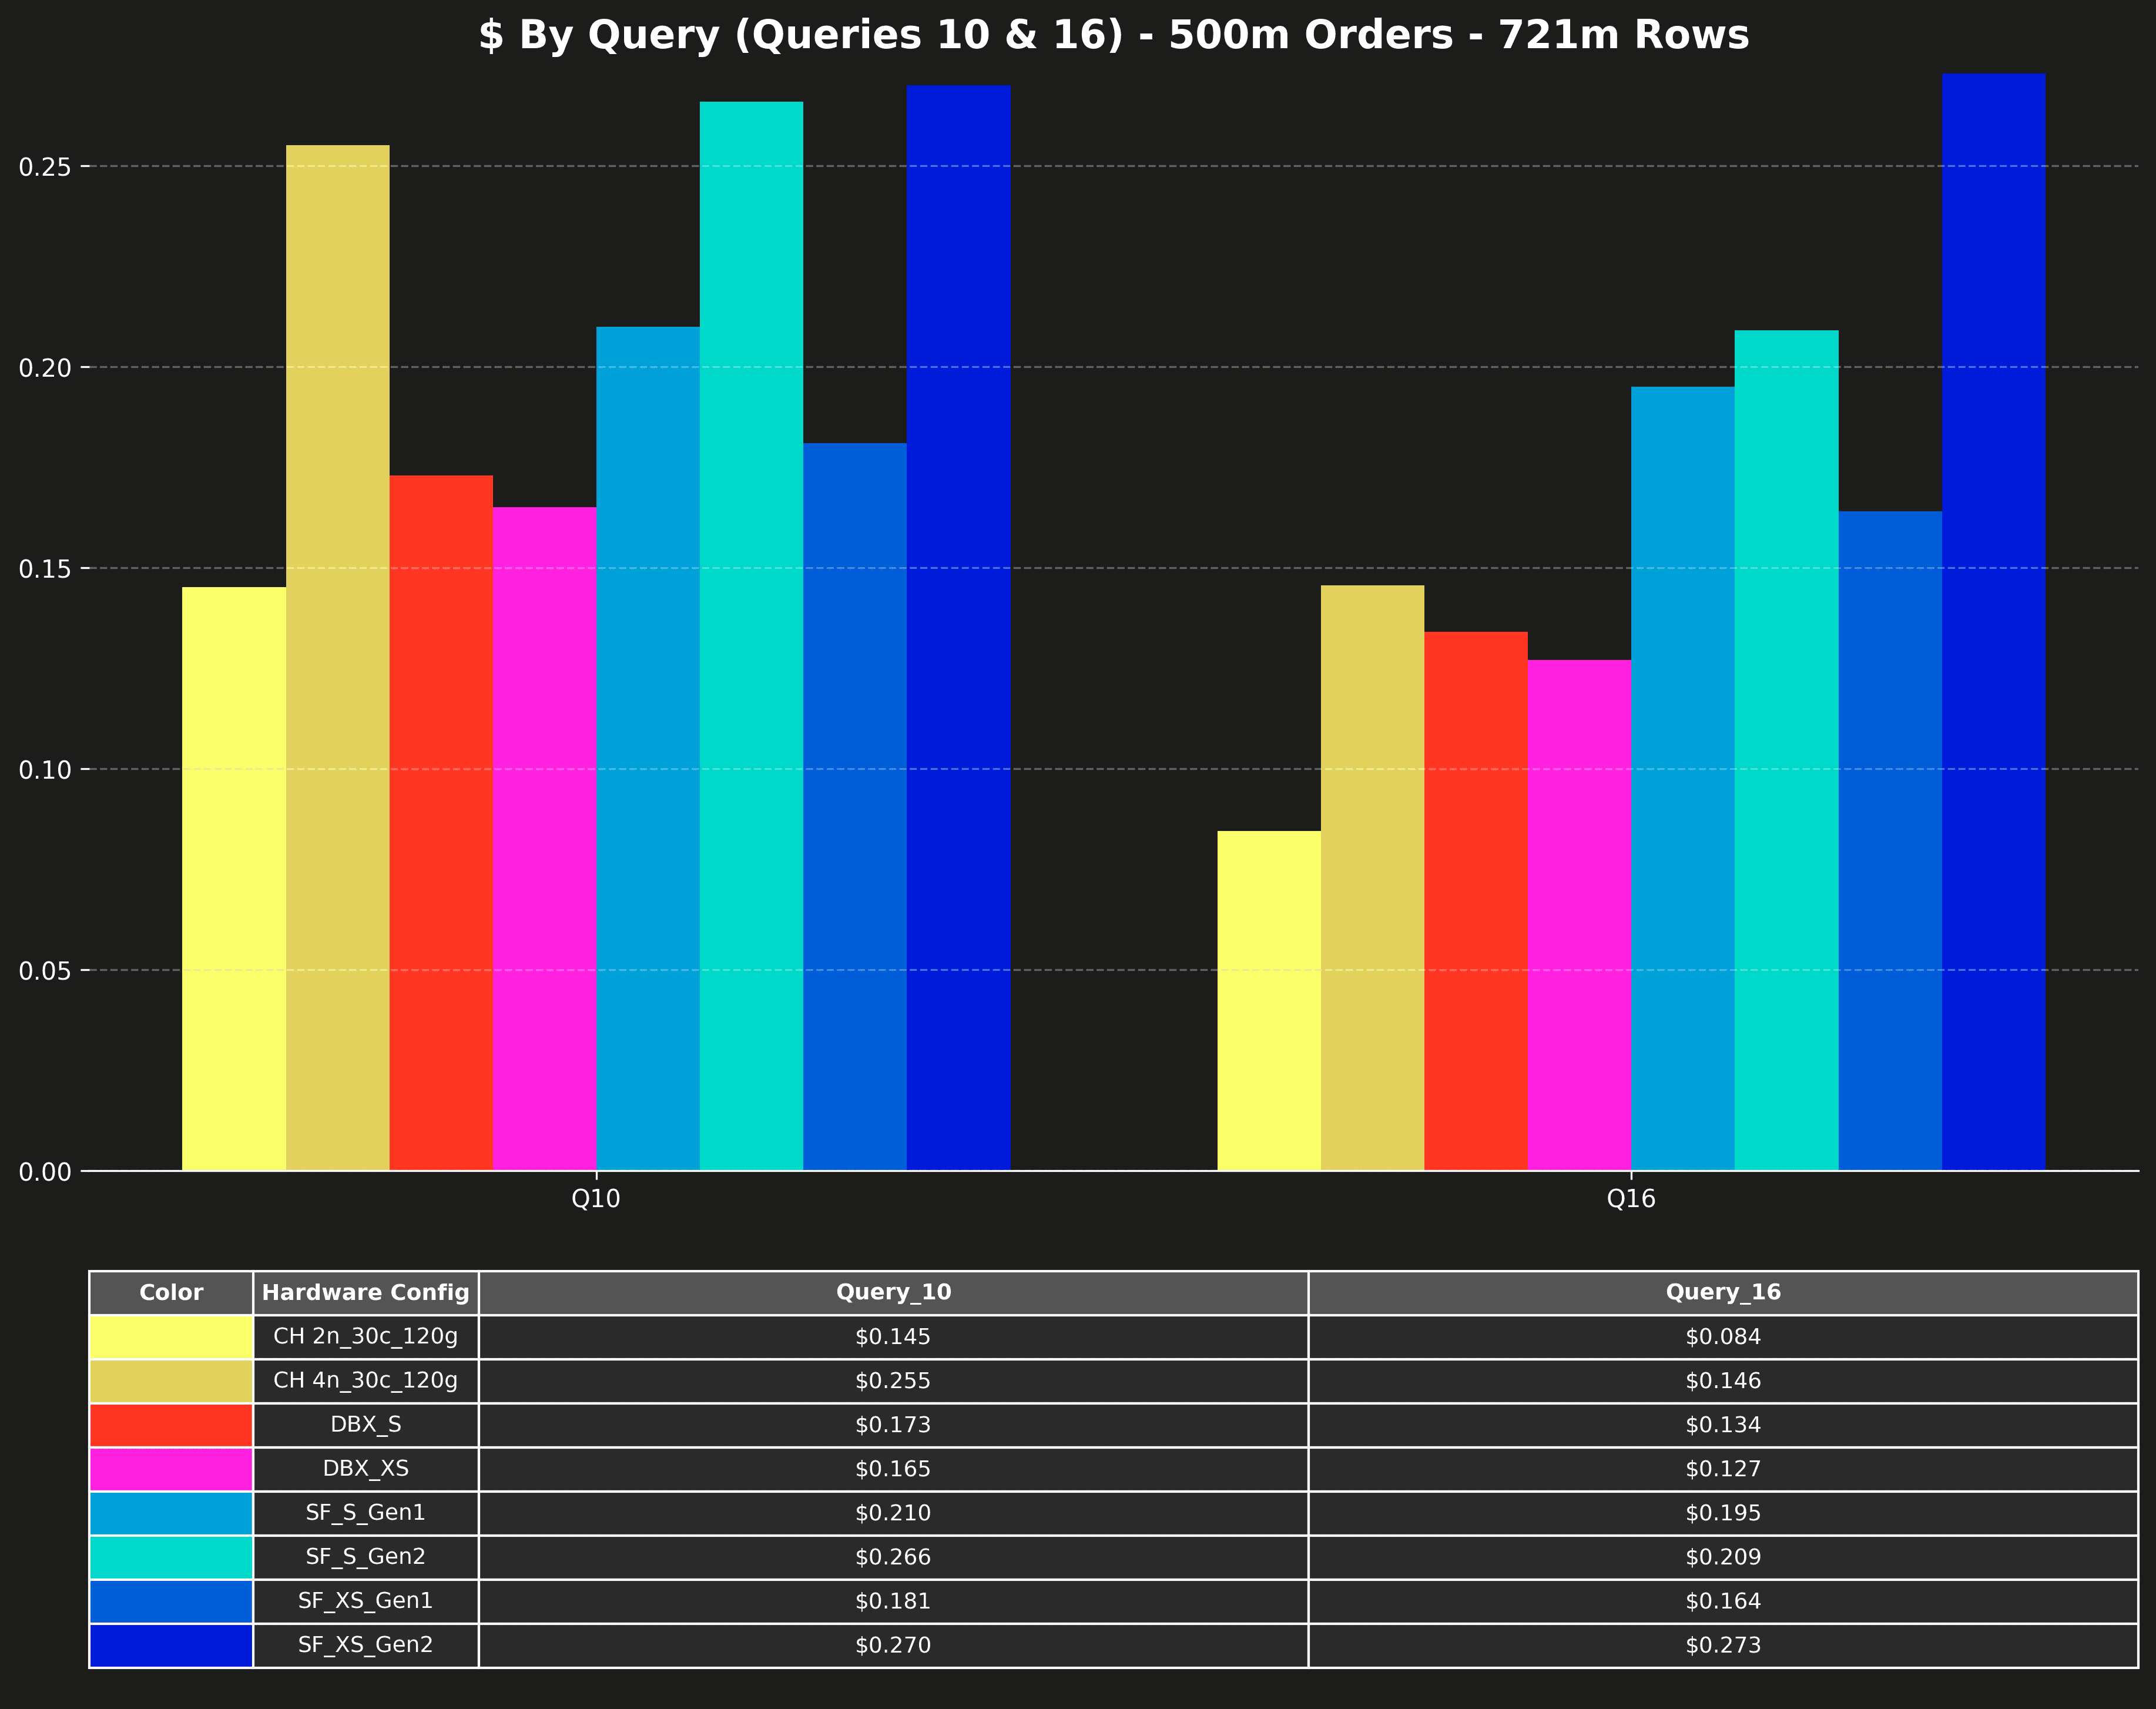
Cost per query (Q10 & Q16 only) #
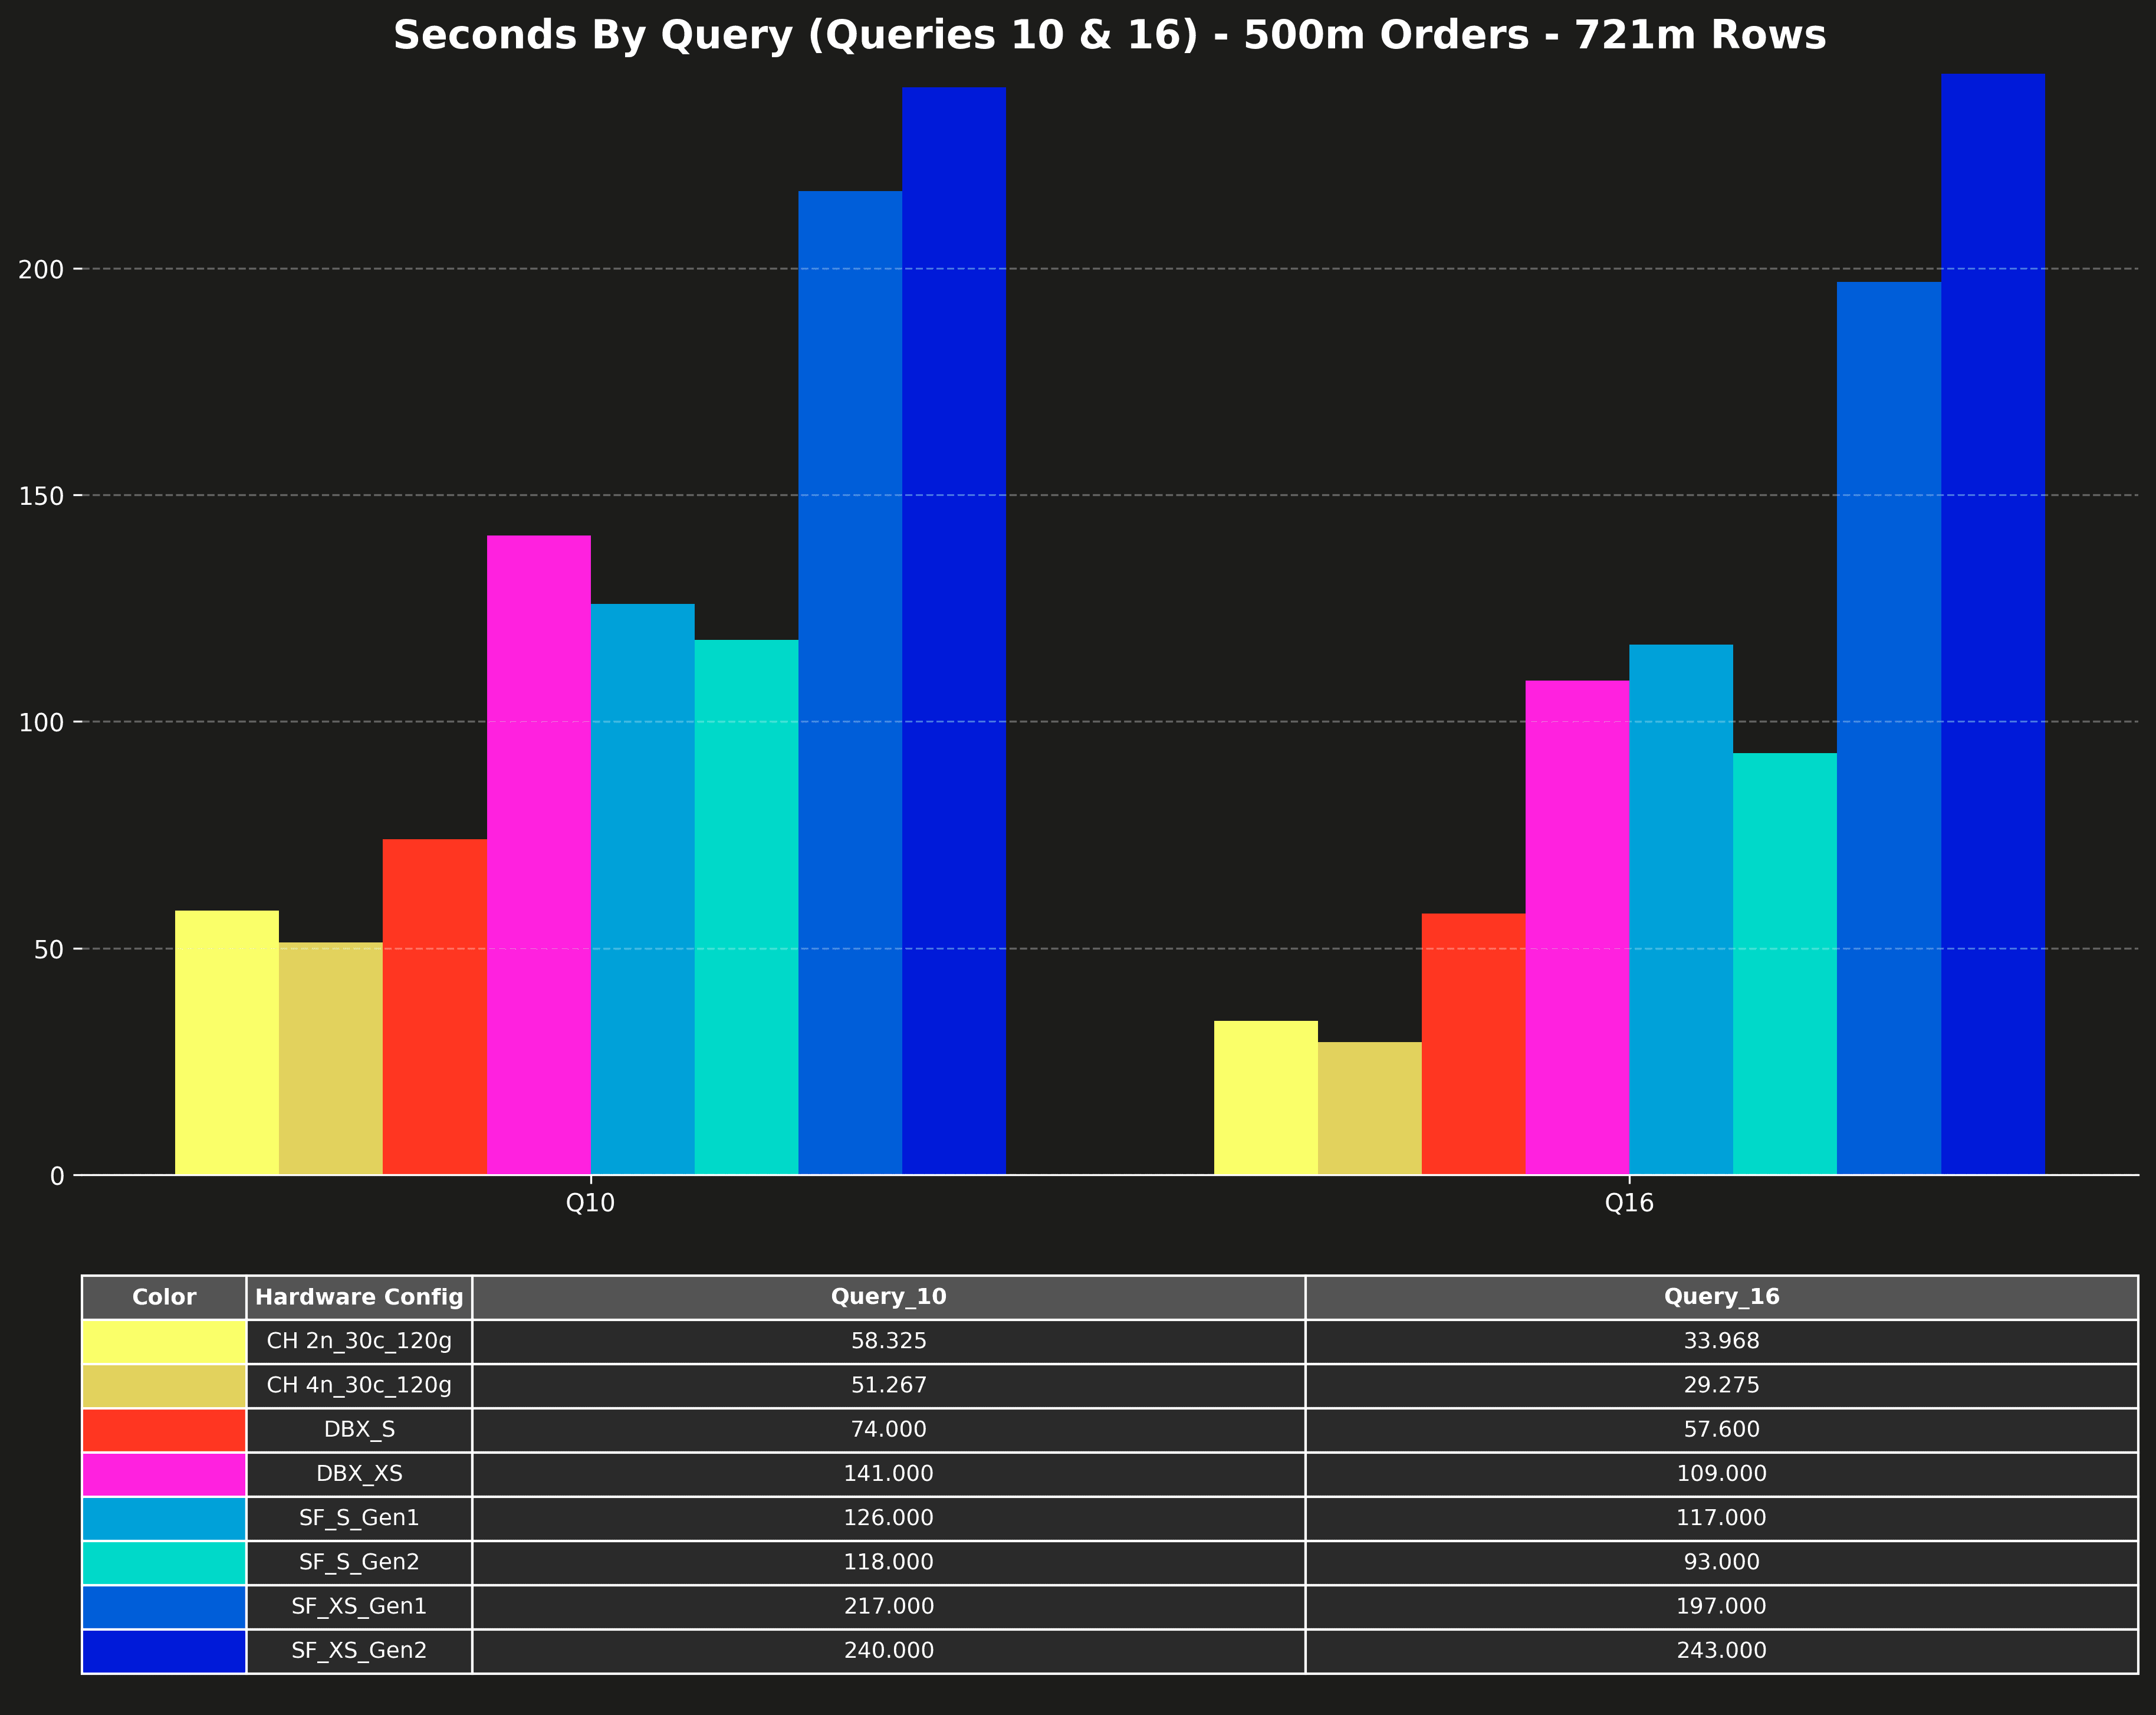
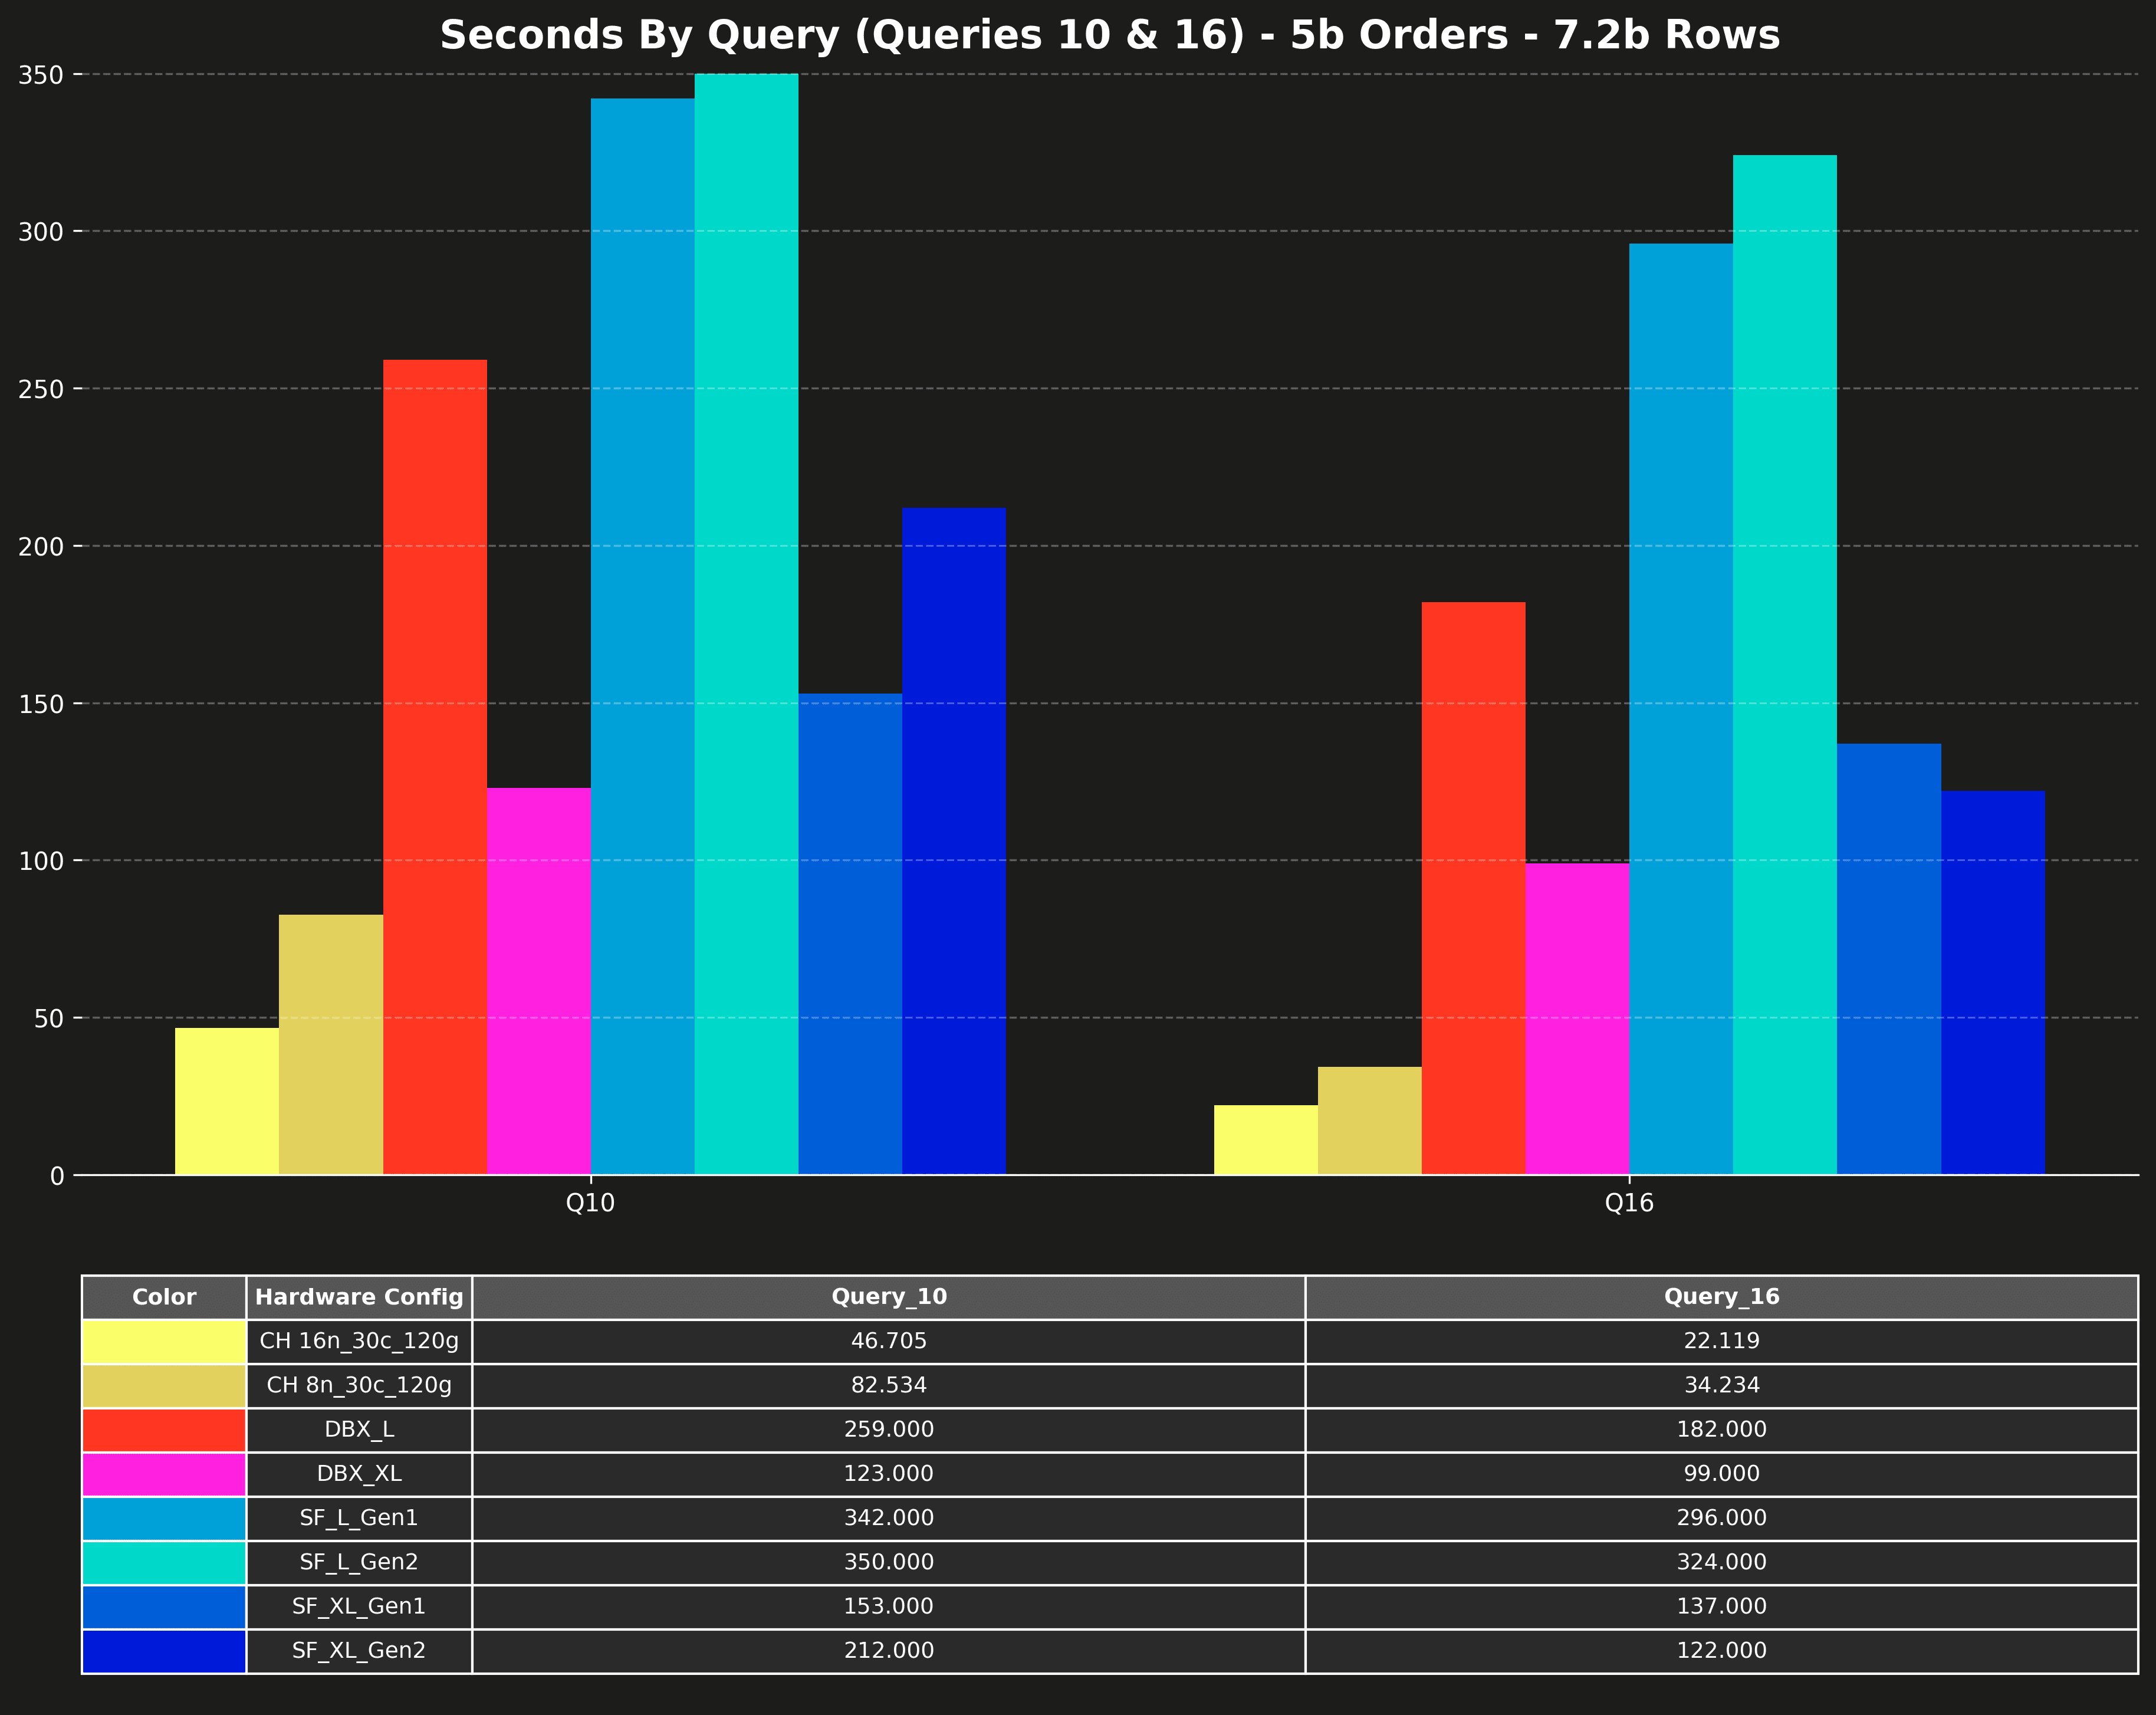
Runtime per query (Q10 & Q16 only) #
Results: 1b scale (1.4b rows) #
This scale uses a seed of 1b orders to generate a total of 1.4b rows.
Total cost #
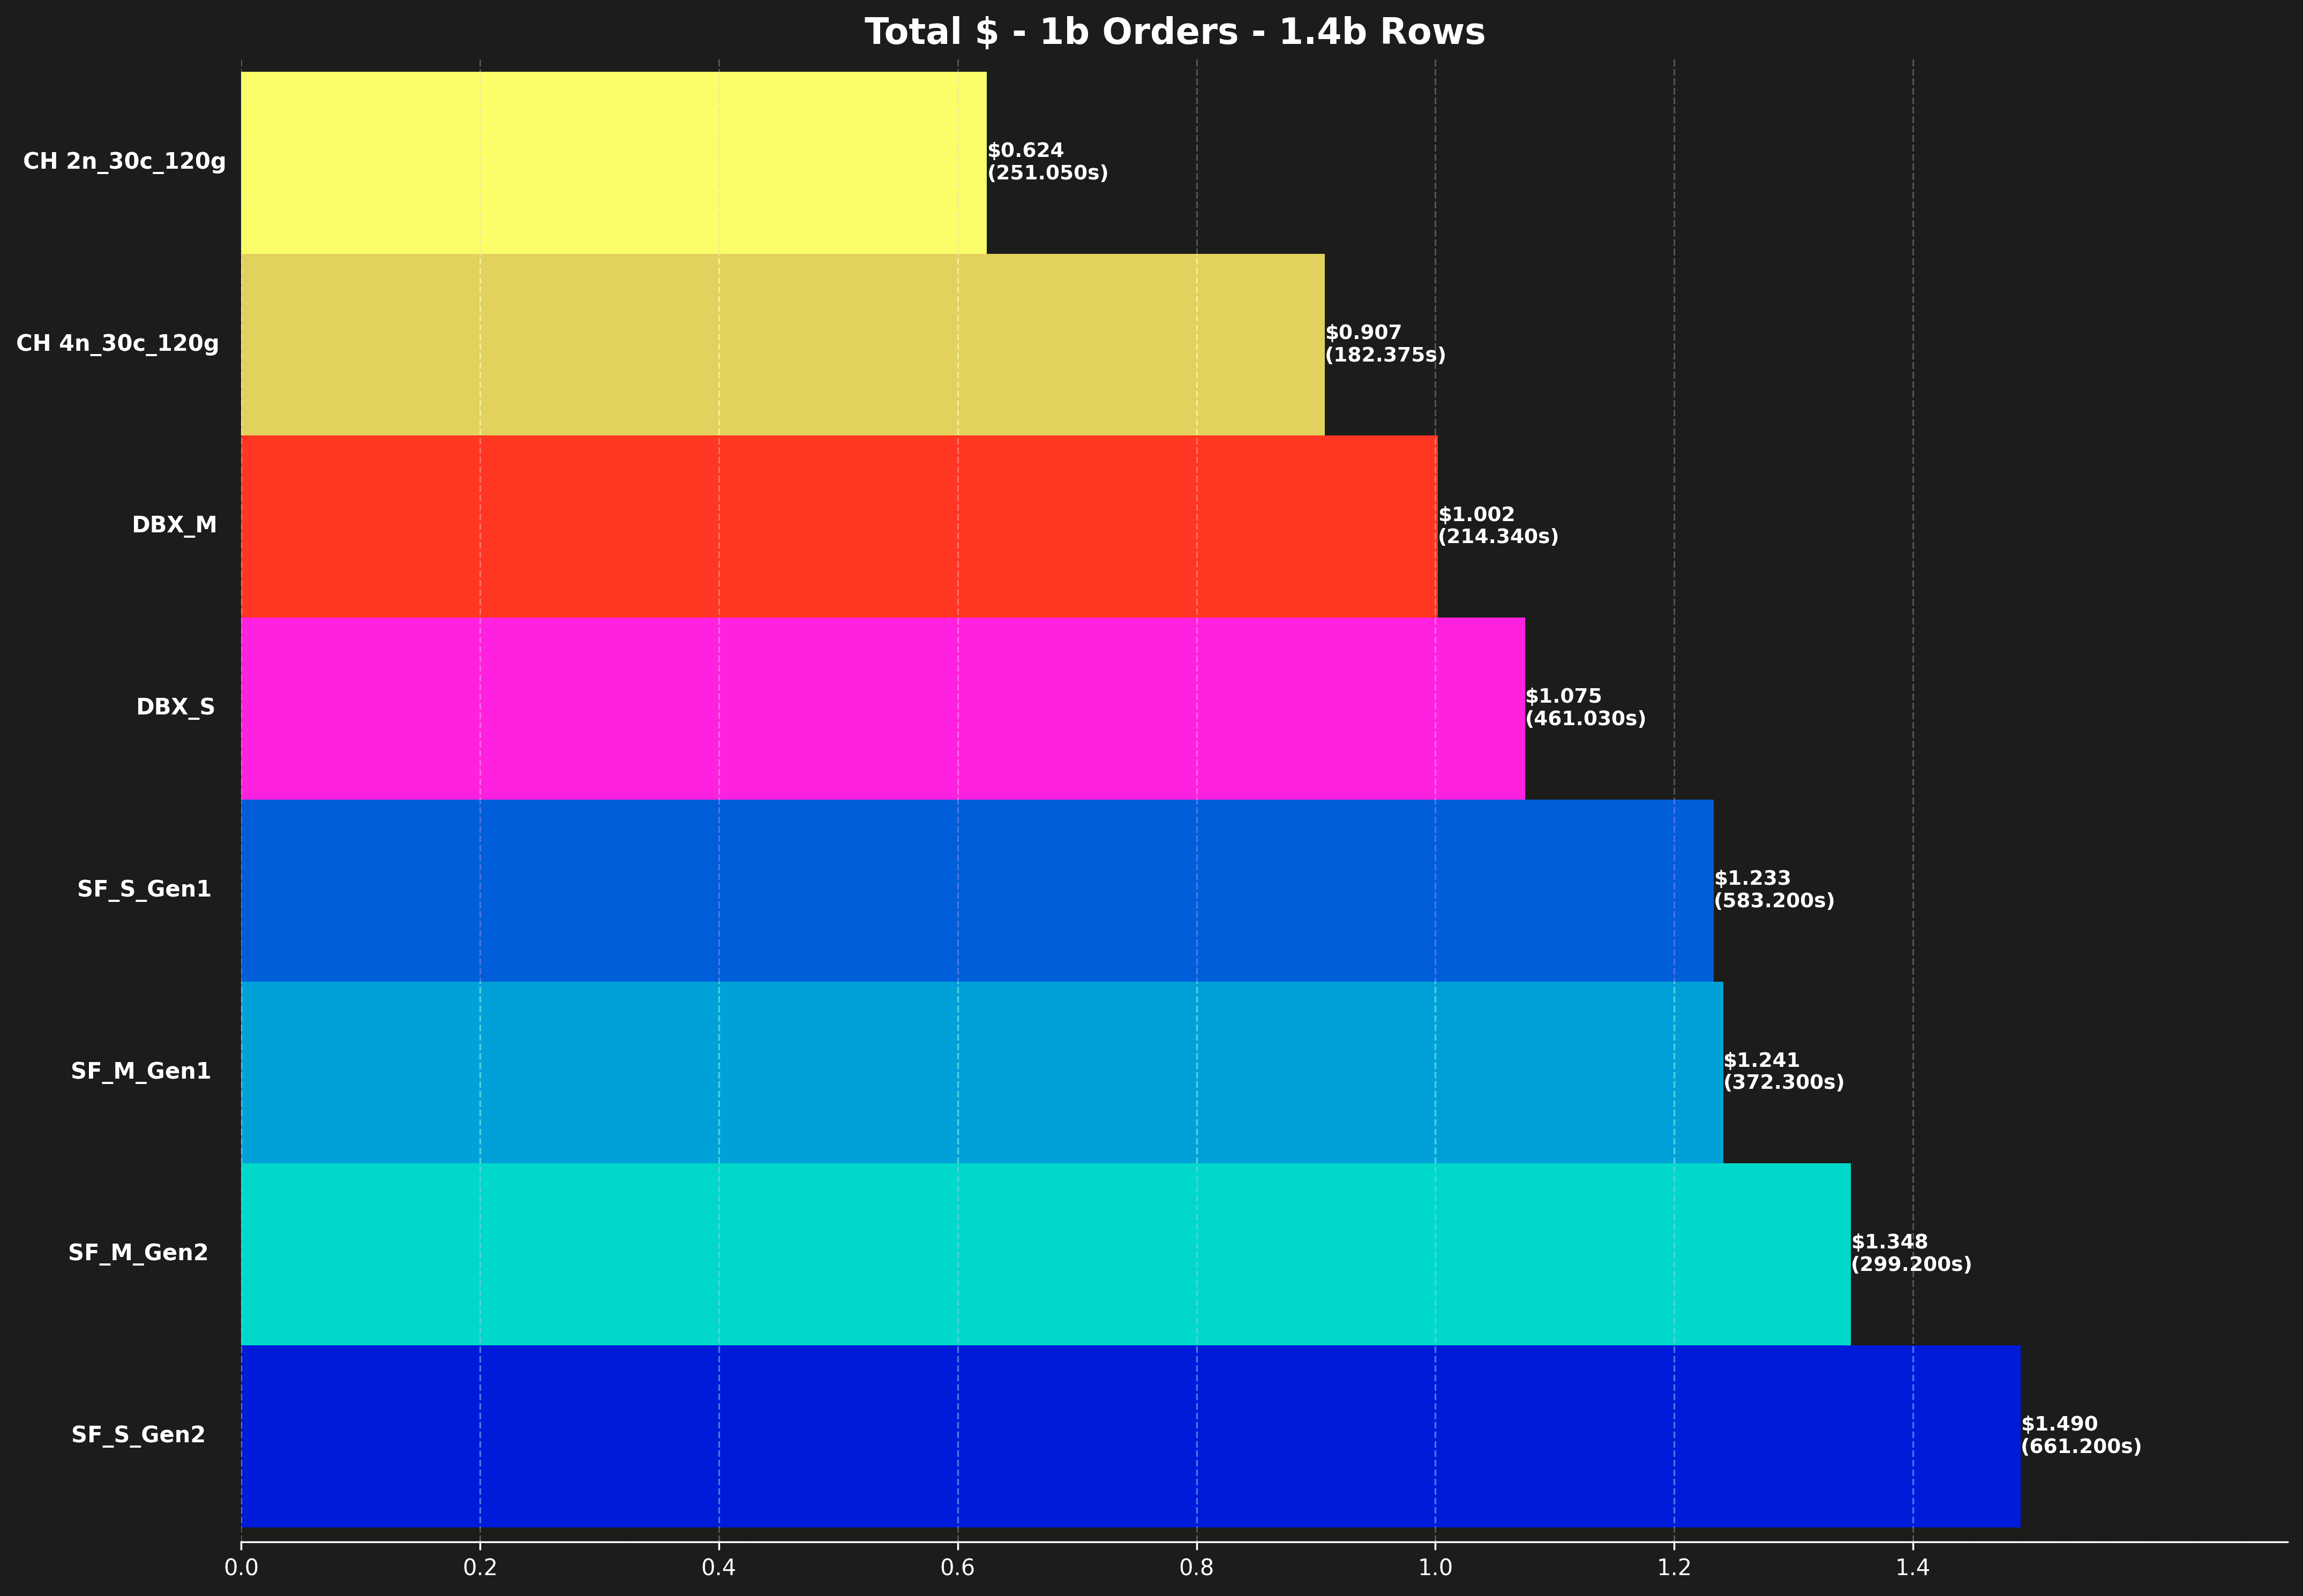
Each bar also shows the total runtime for all 17 queries, shown in parentheses.
Total runtime #
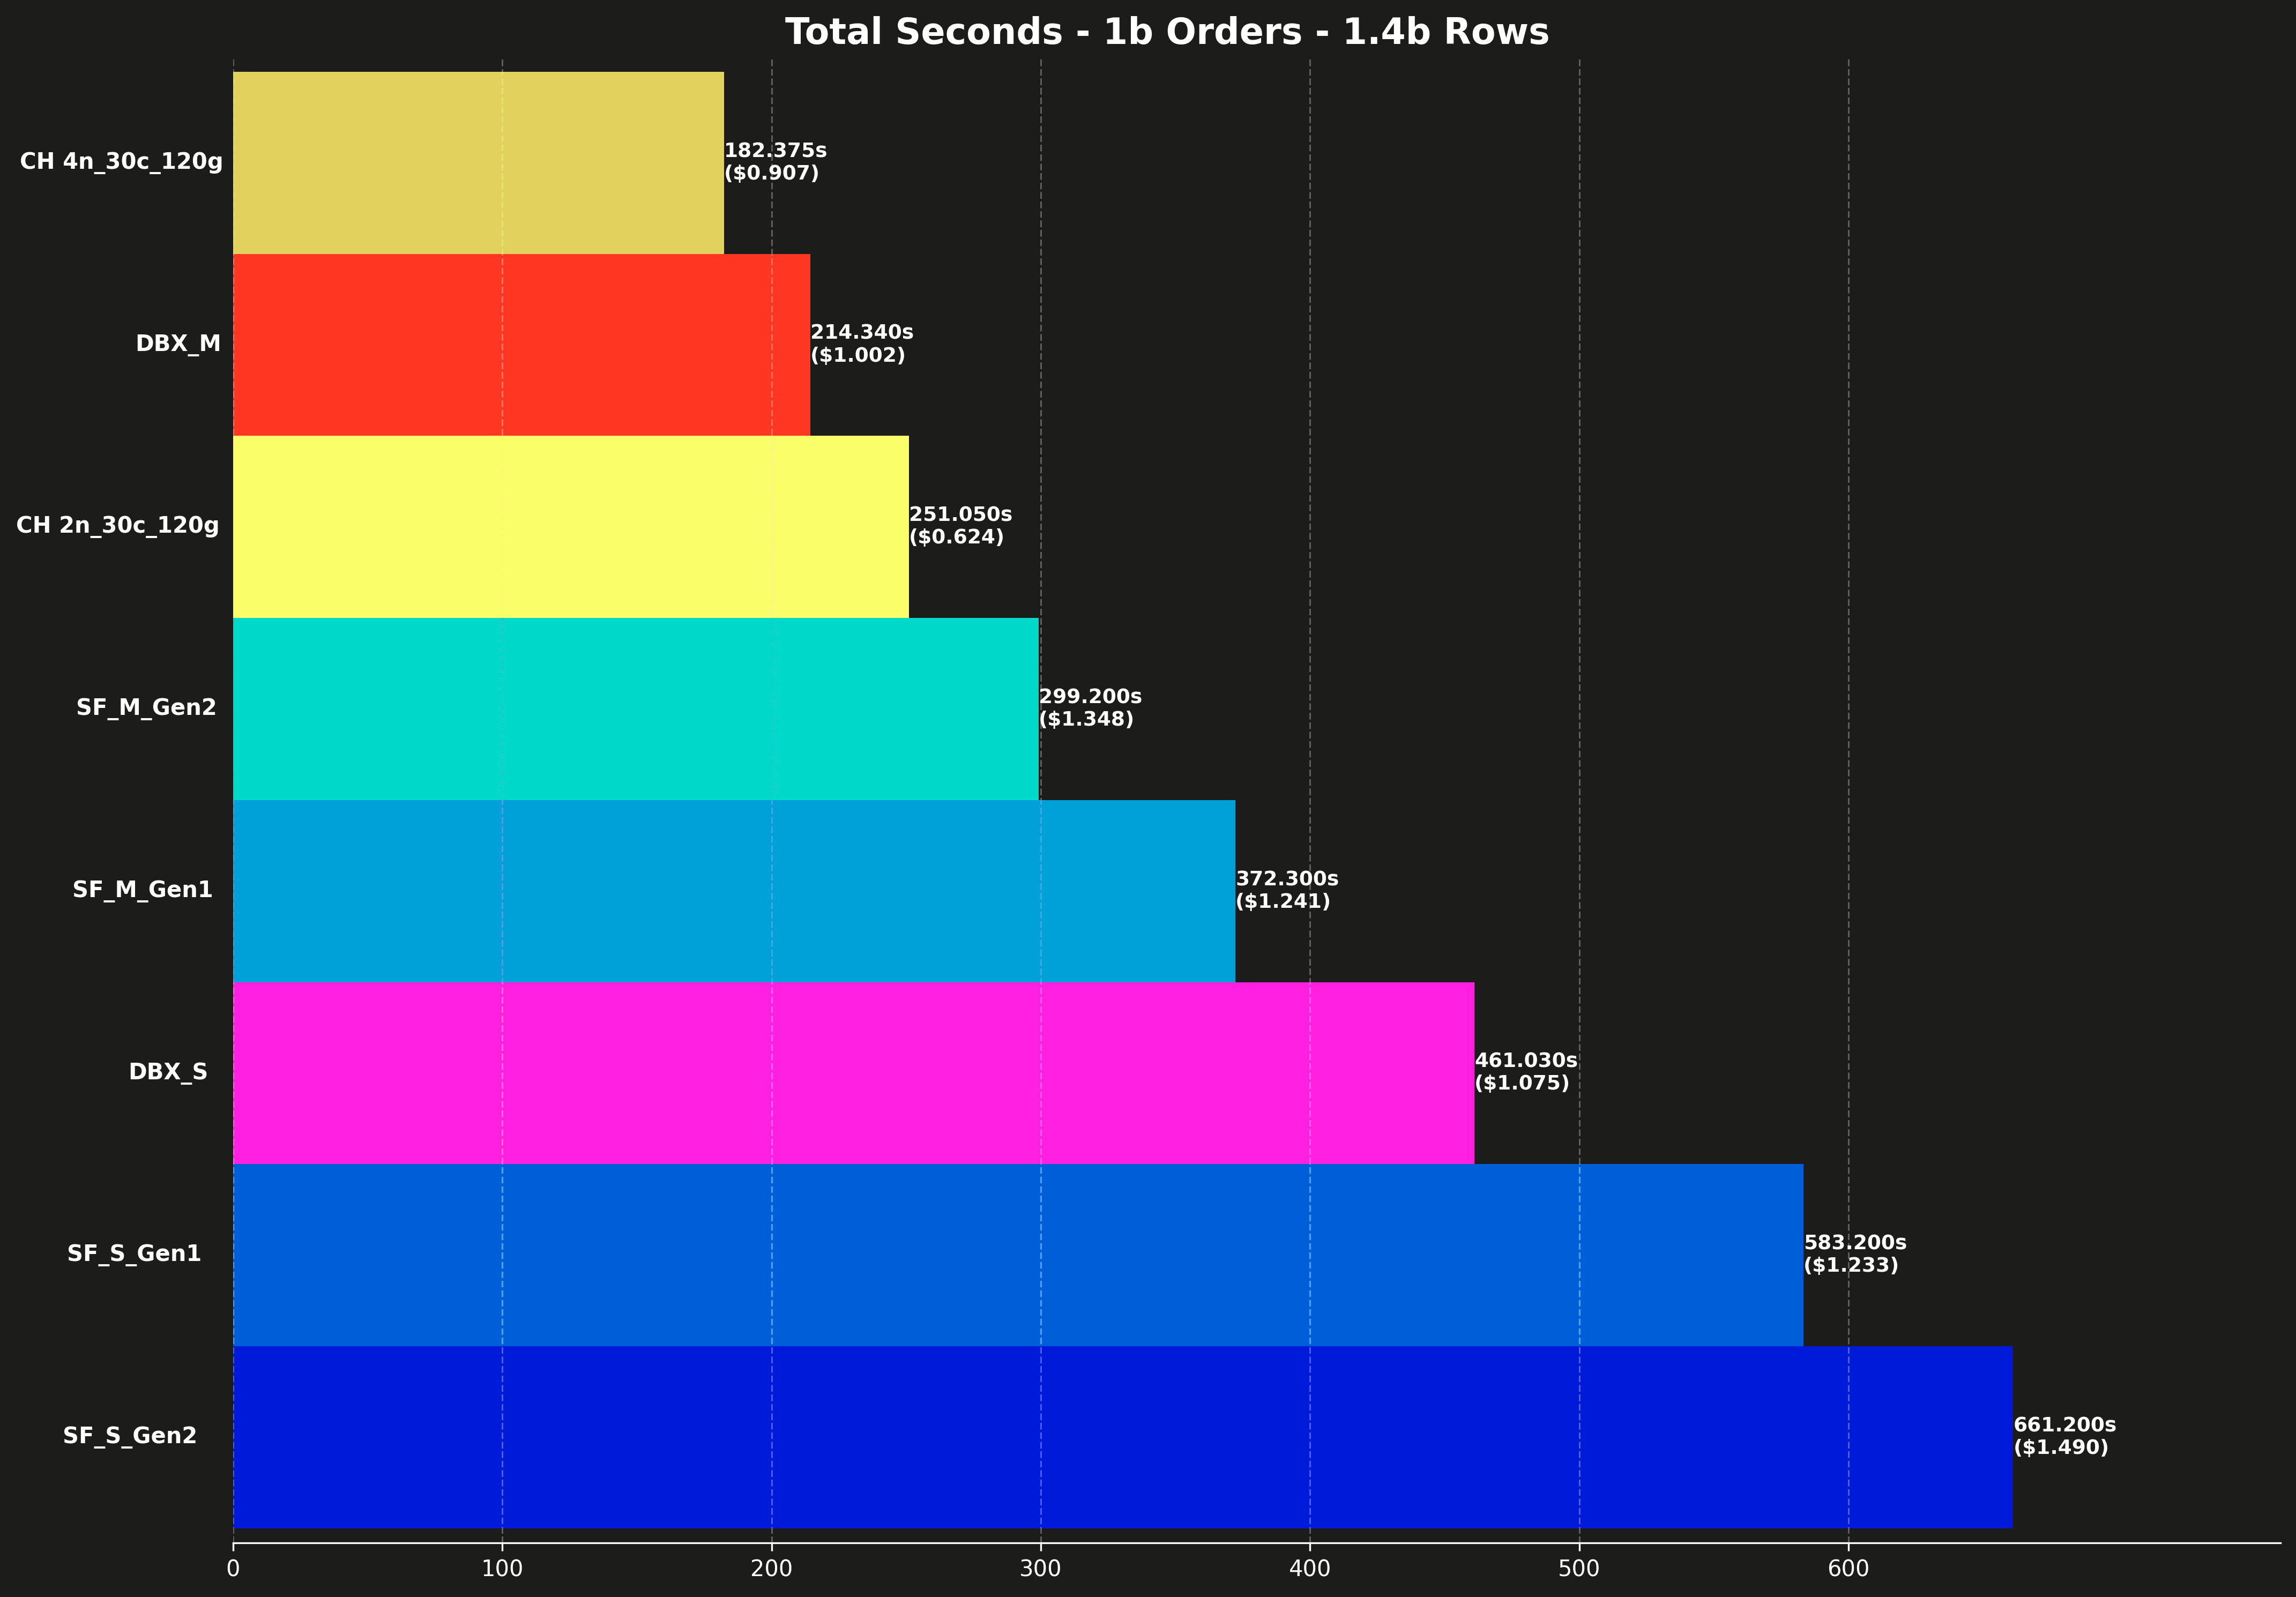
Each bar also shows the total cost for running all 17 queries, shown in parentheses.
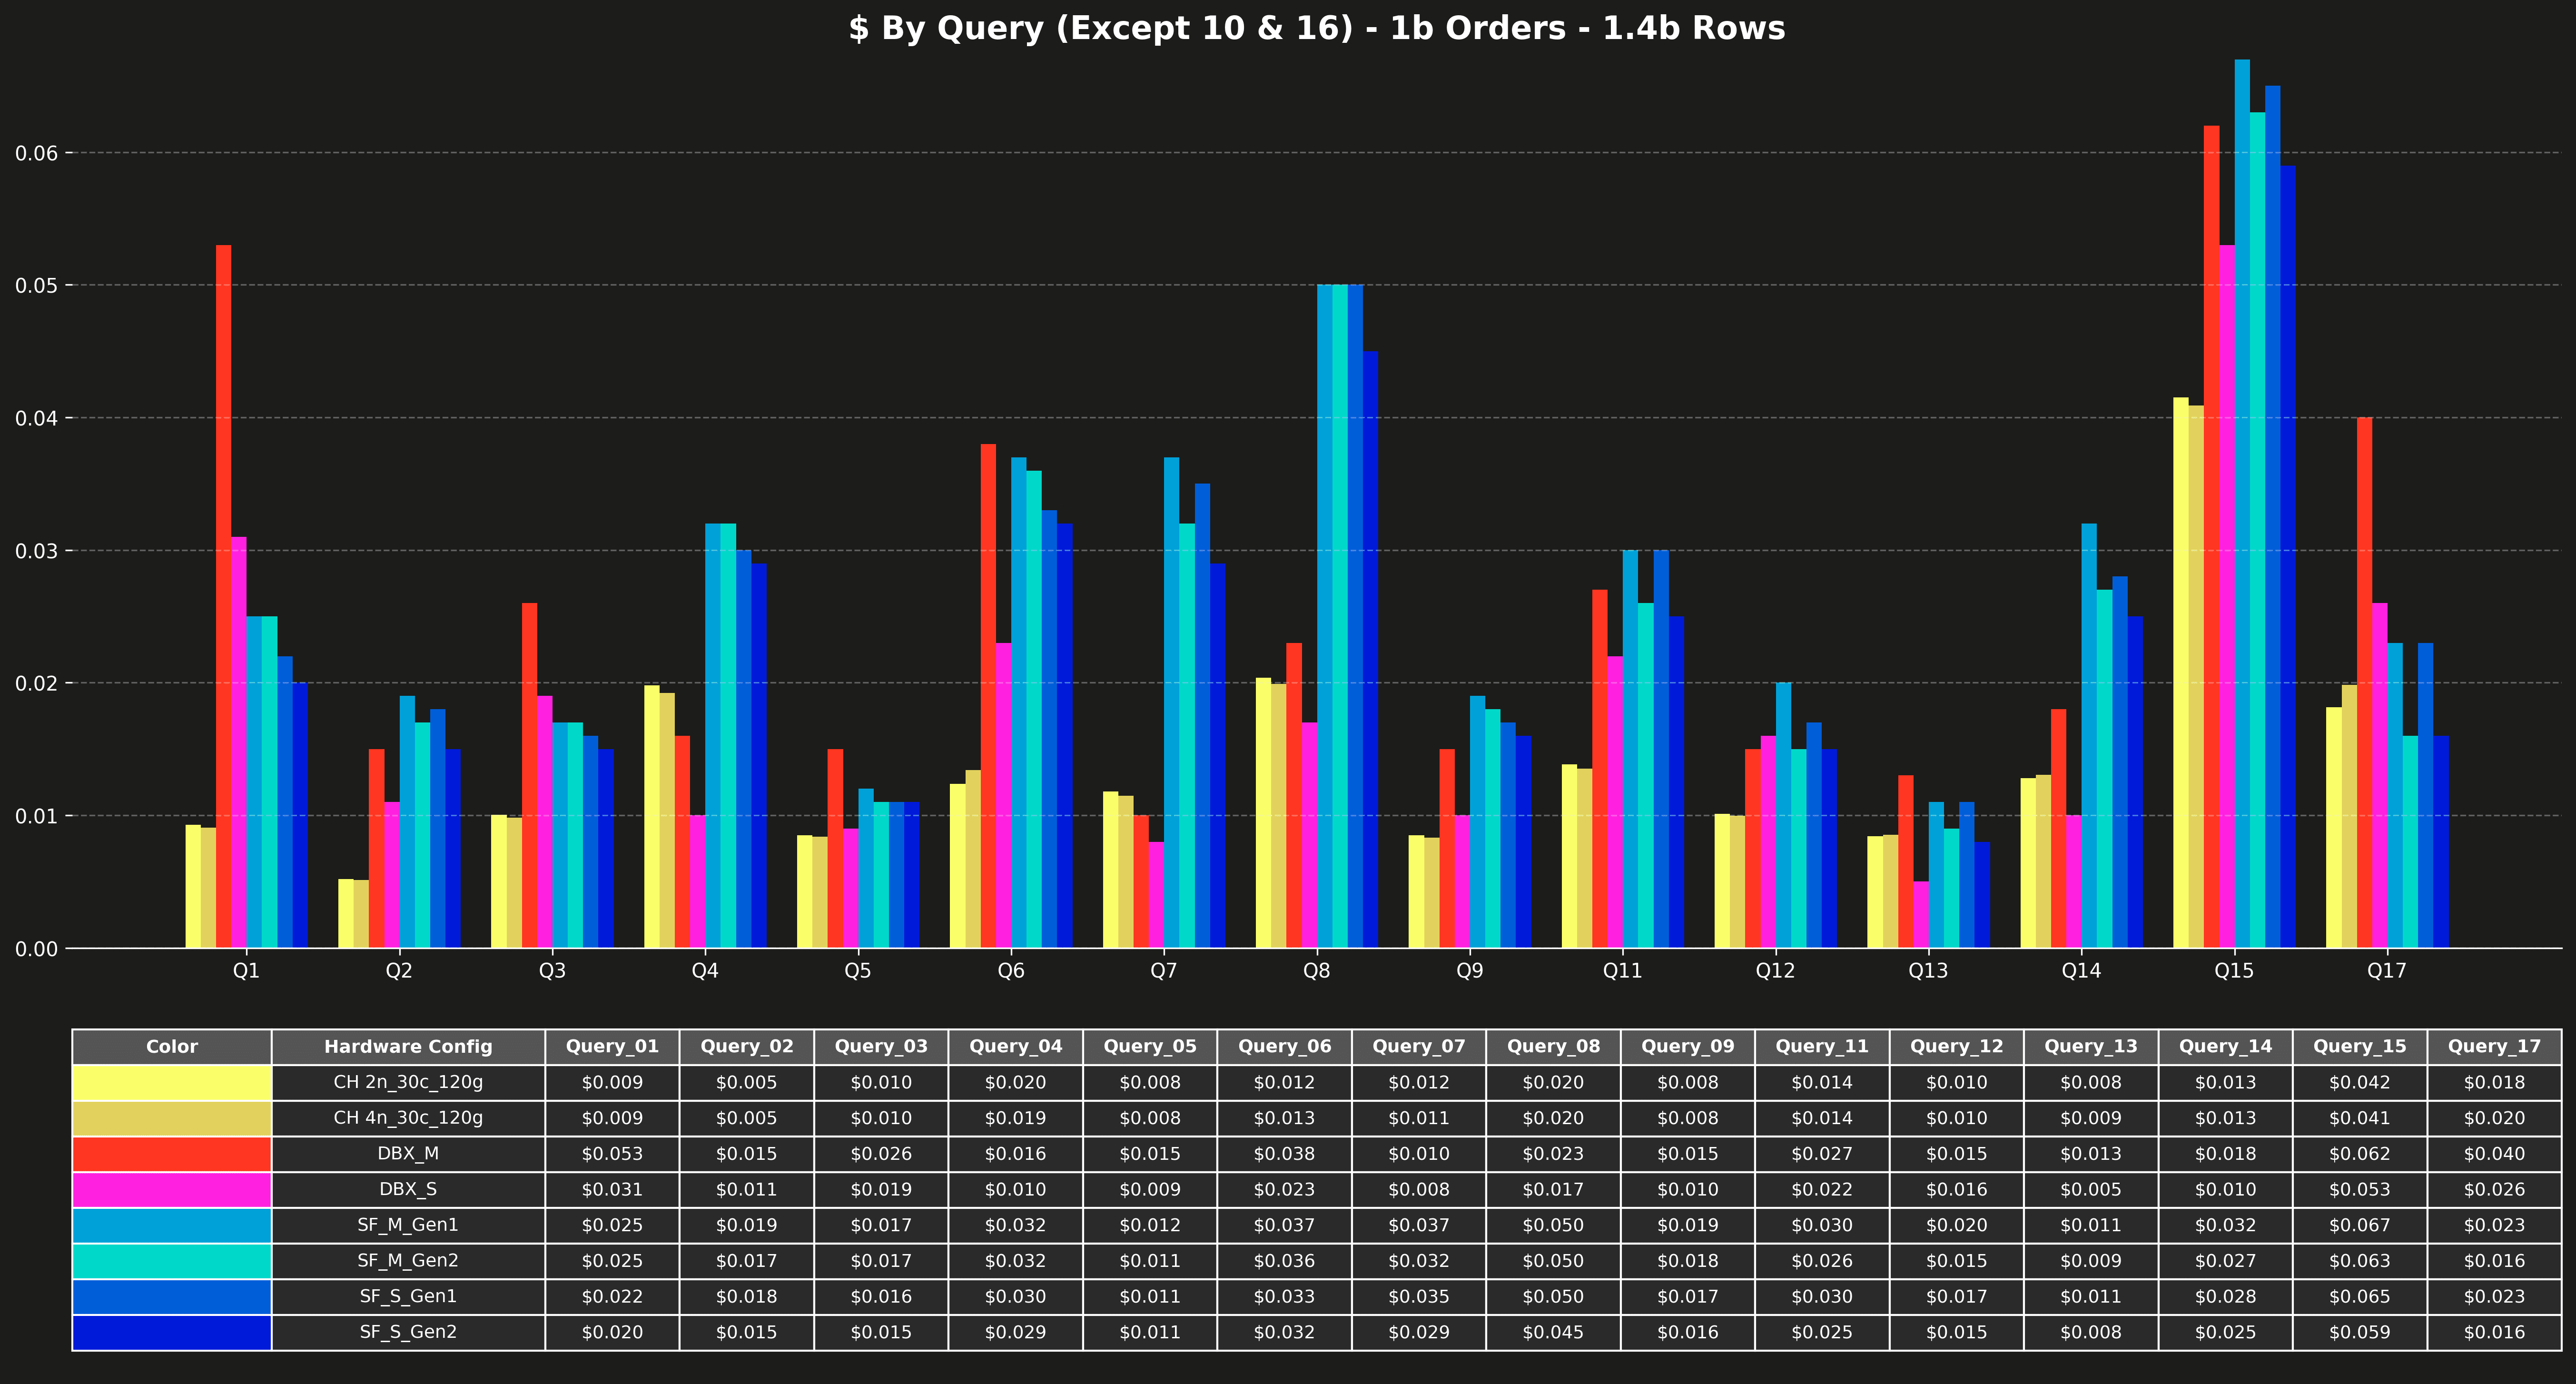
Cost per query (excluding Q10 & Q16) #
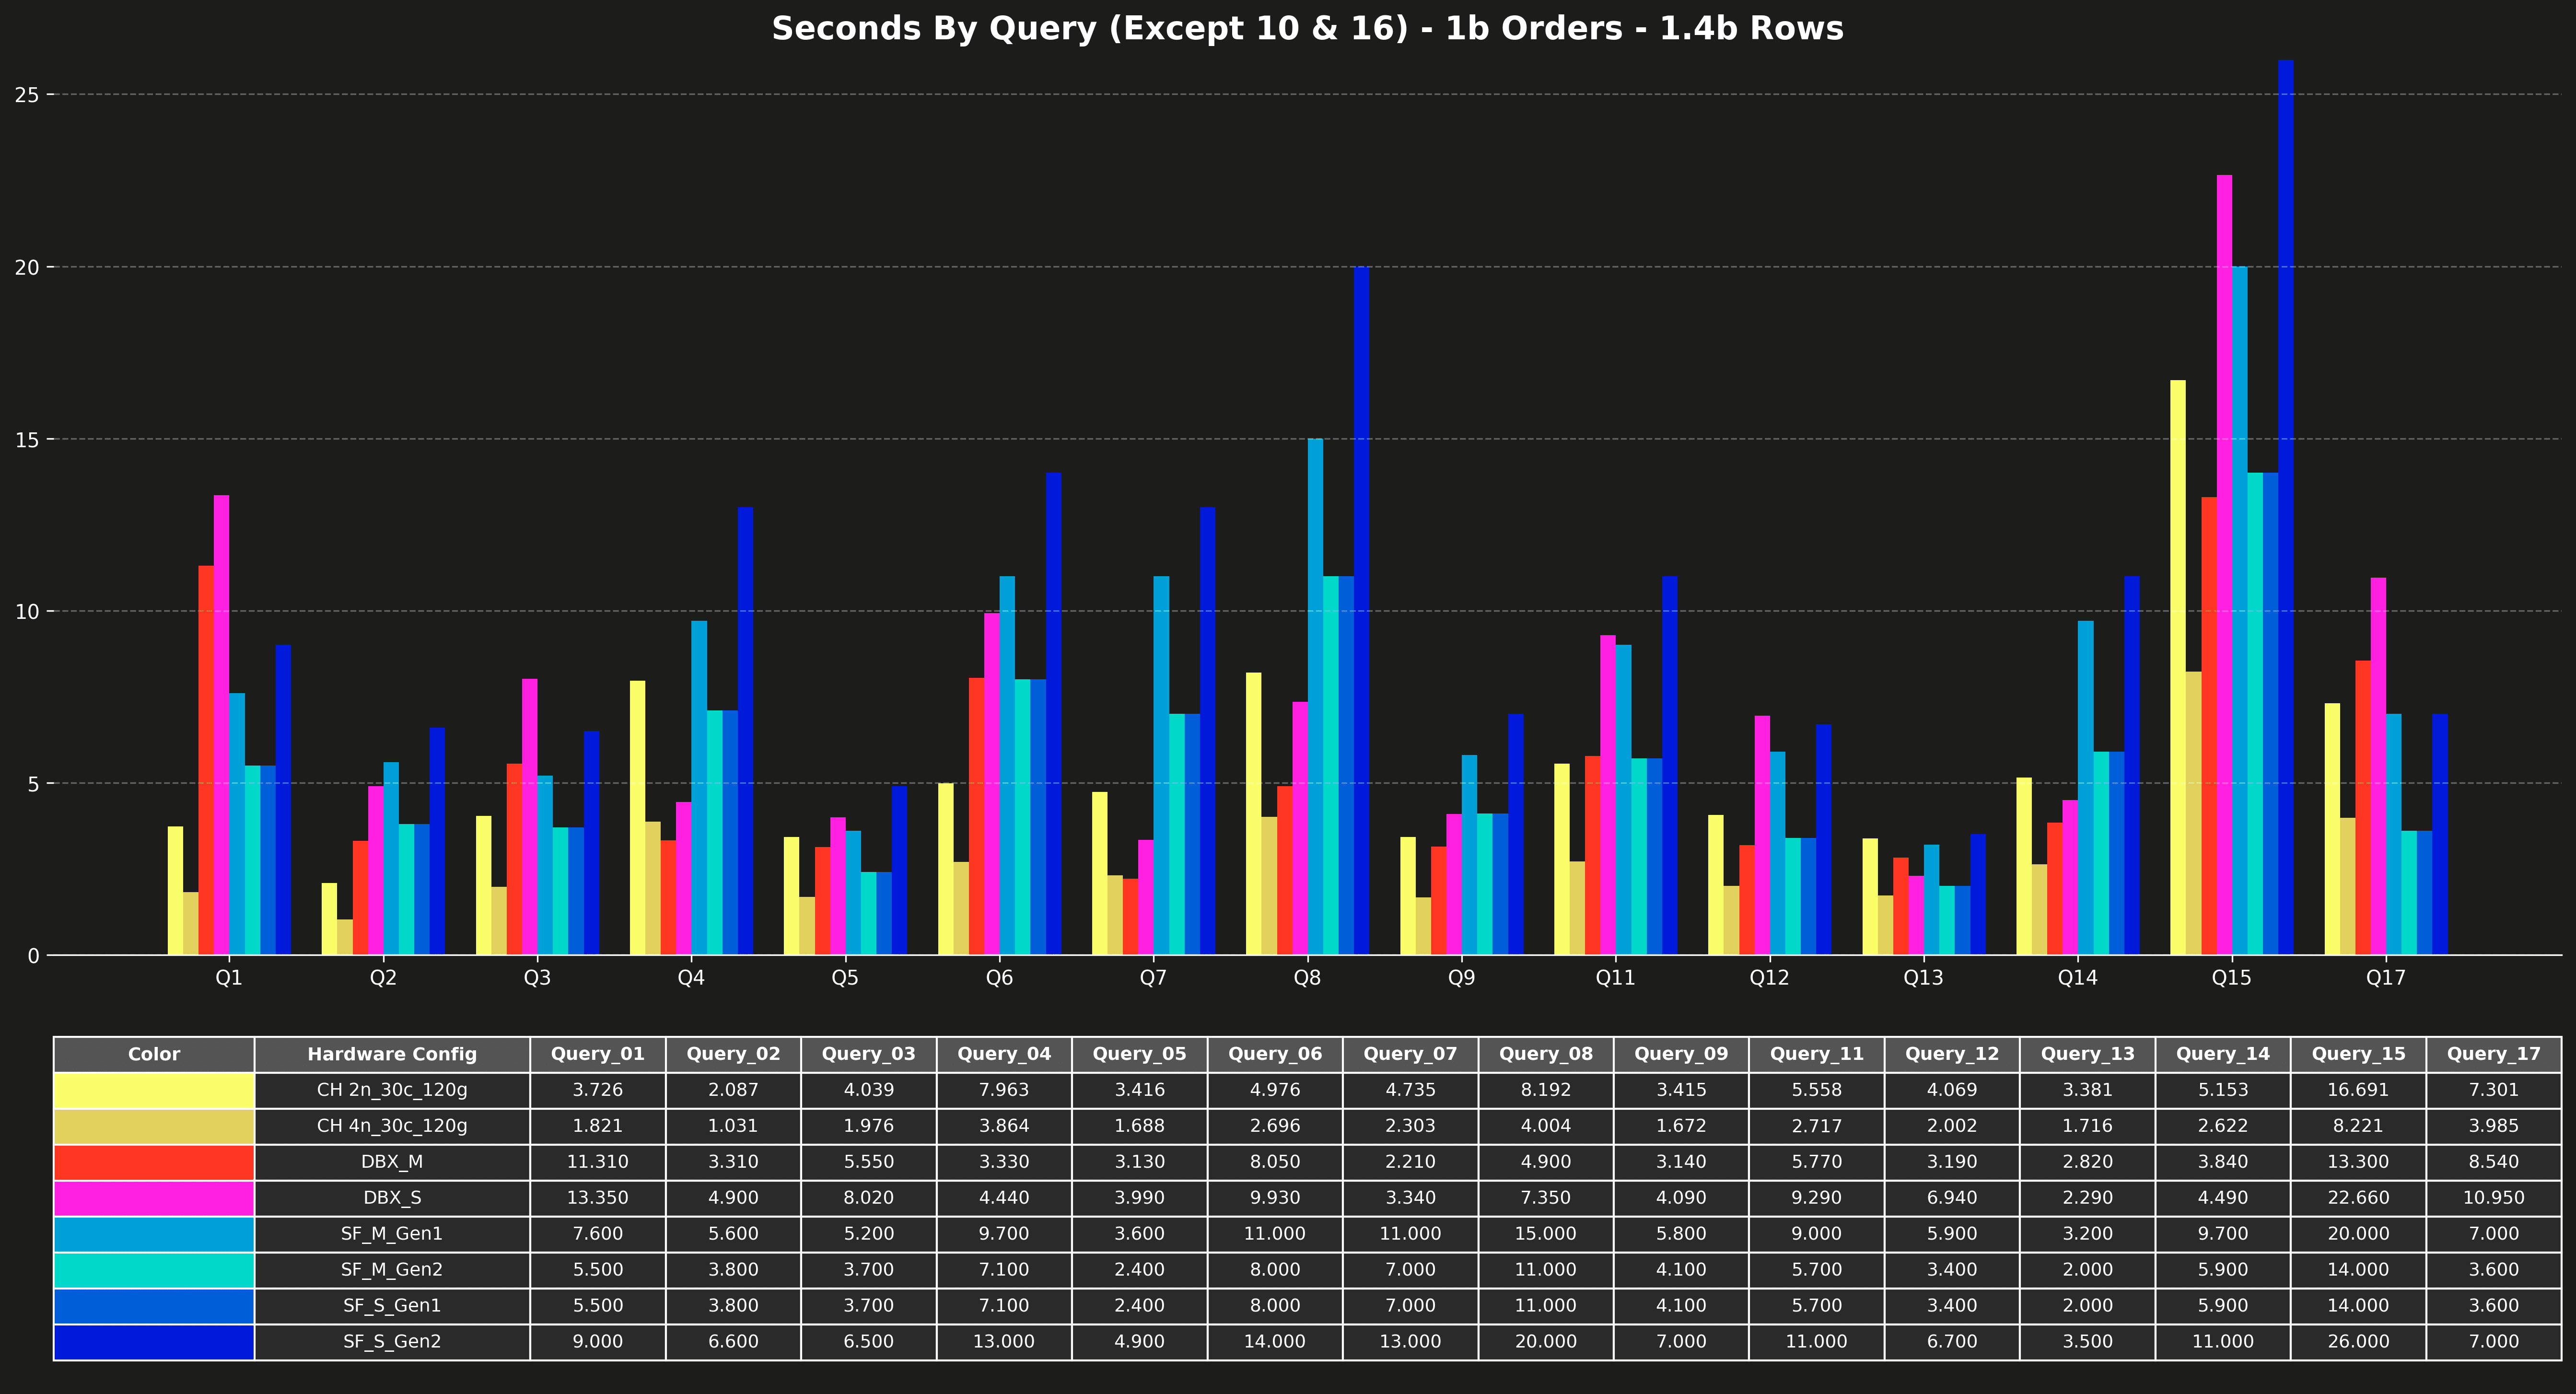
Runtime per query (excluding Q10 & Q16) #
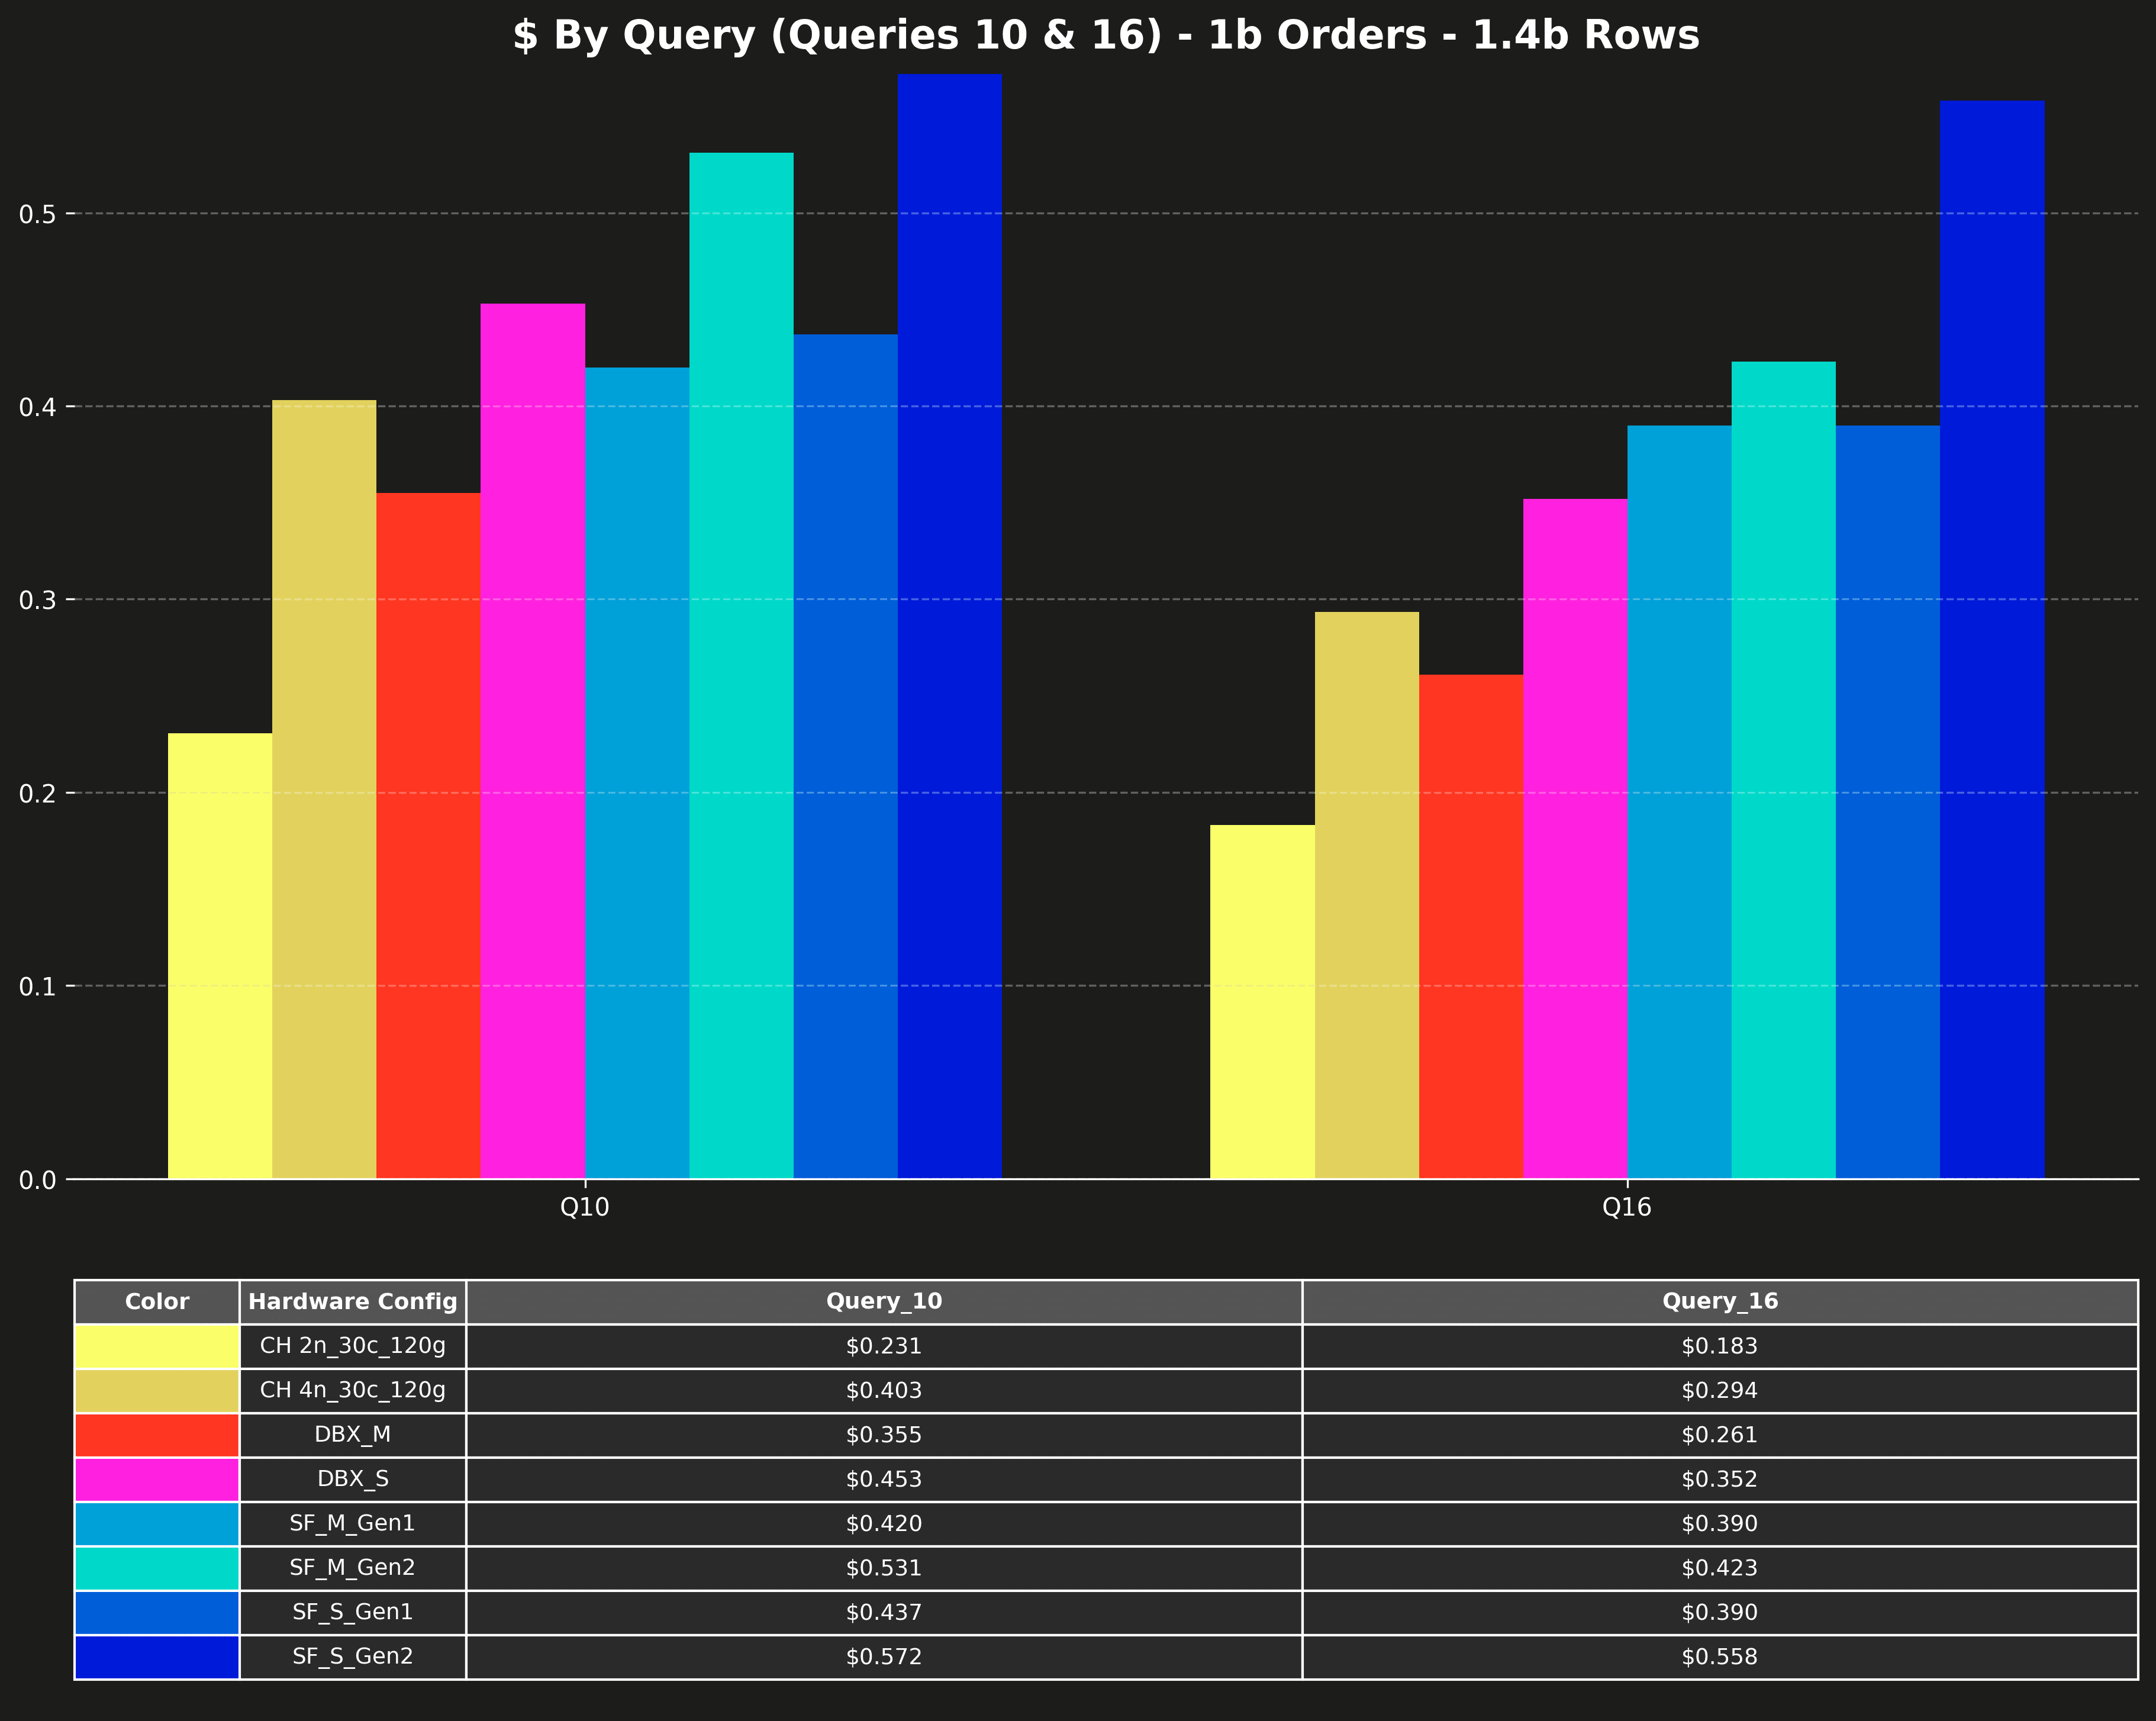
Cost per query (Q10 & Q16 only) #
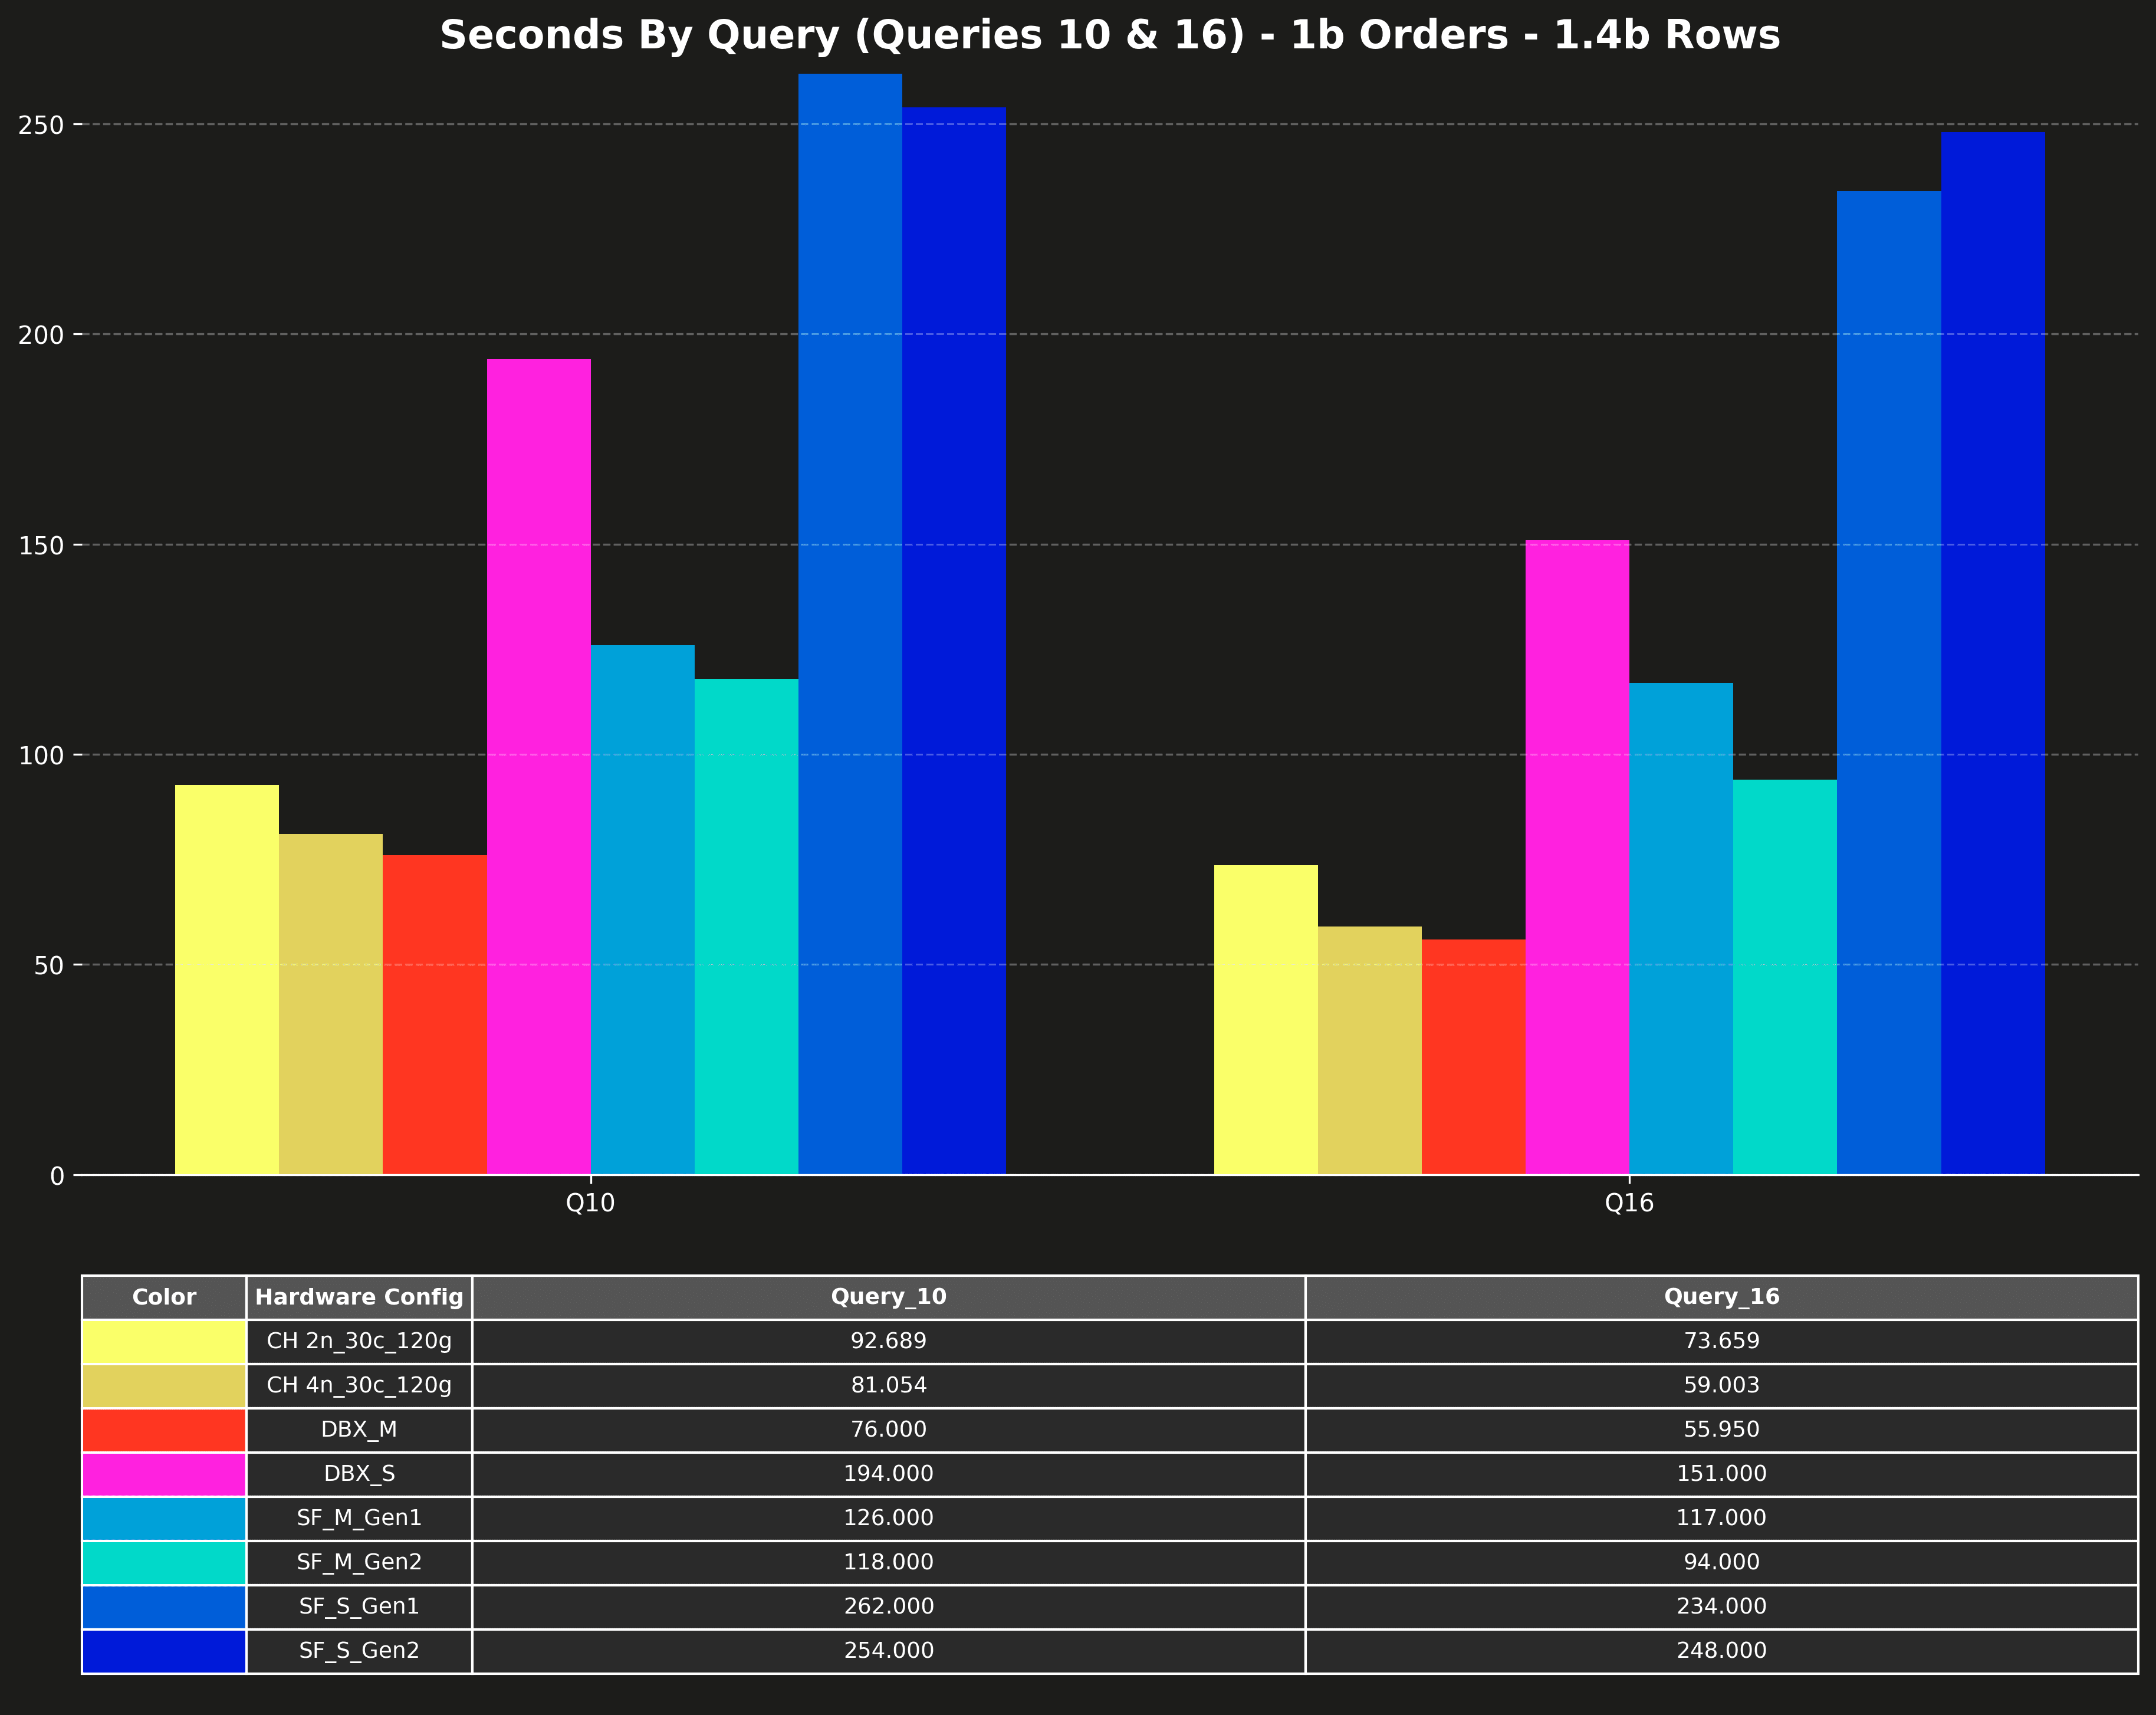
Runtime per query (Q10 & Q16 only) #
Results: 5b scale (7.2b rows) #
This scale uses a seed of 5b orders to generate a total of 7.2b rows.
Total cost #
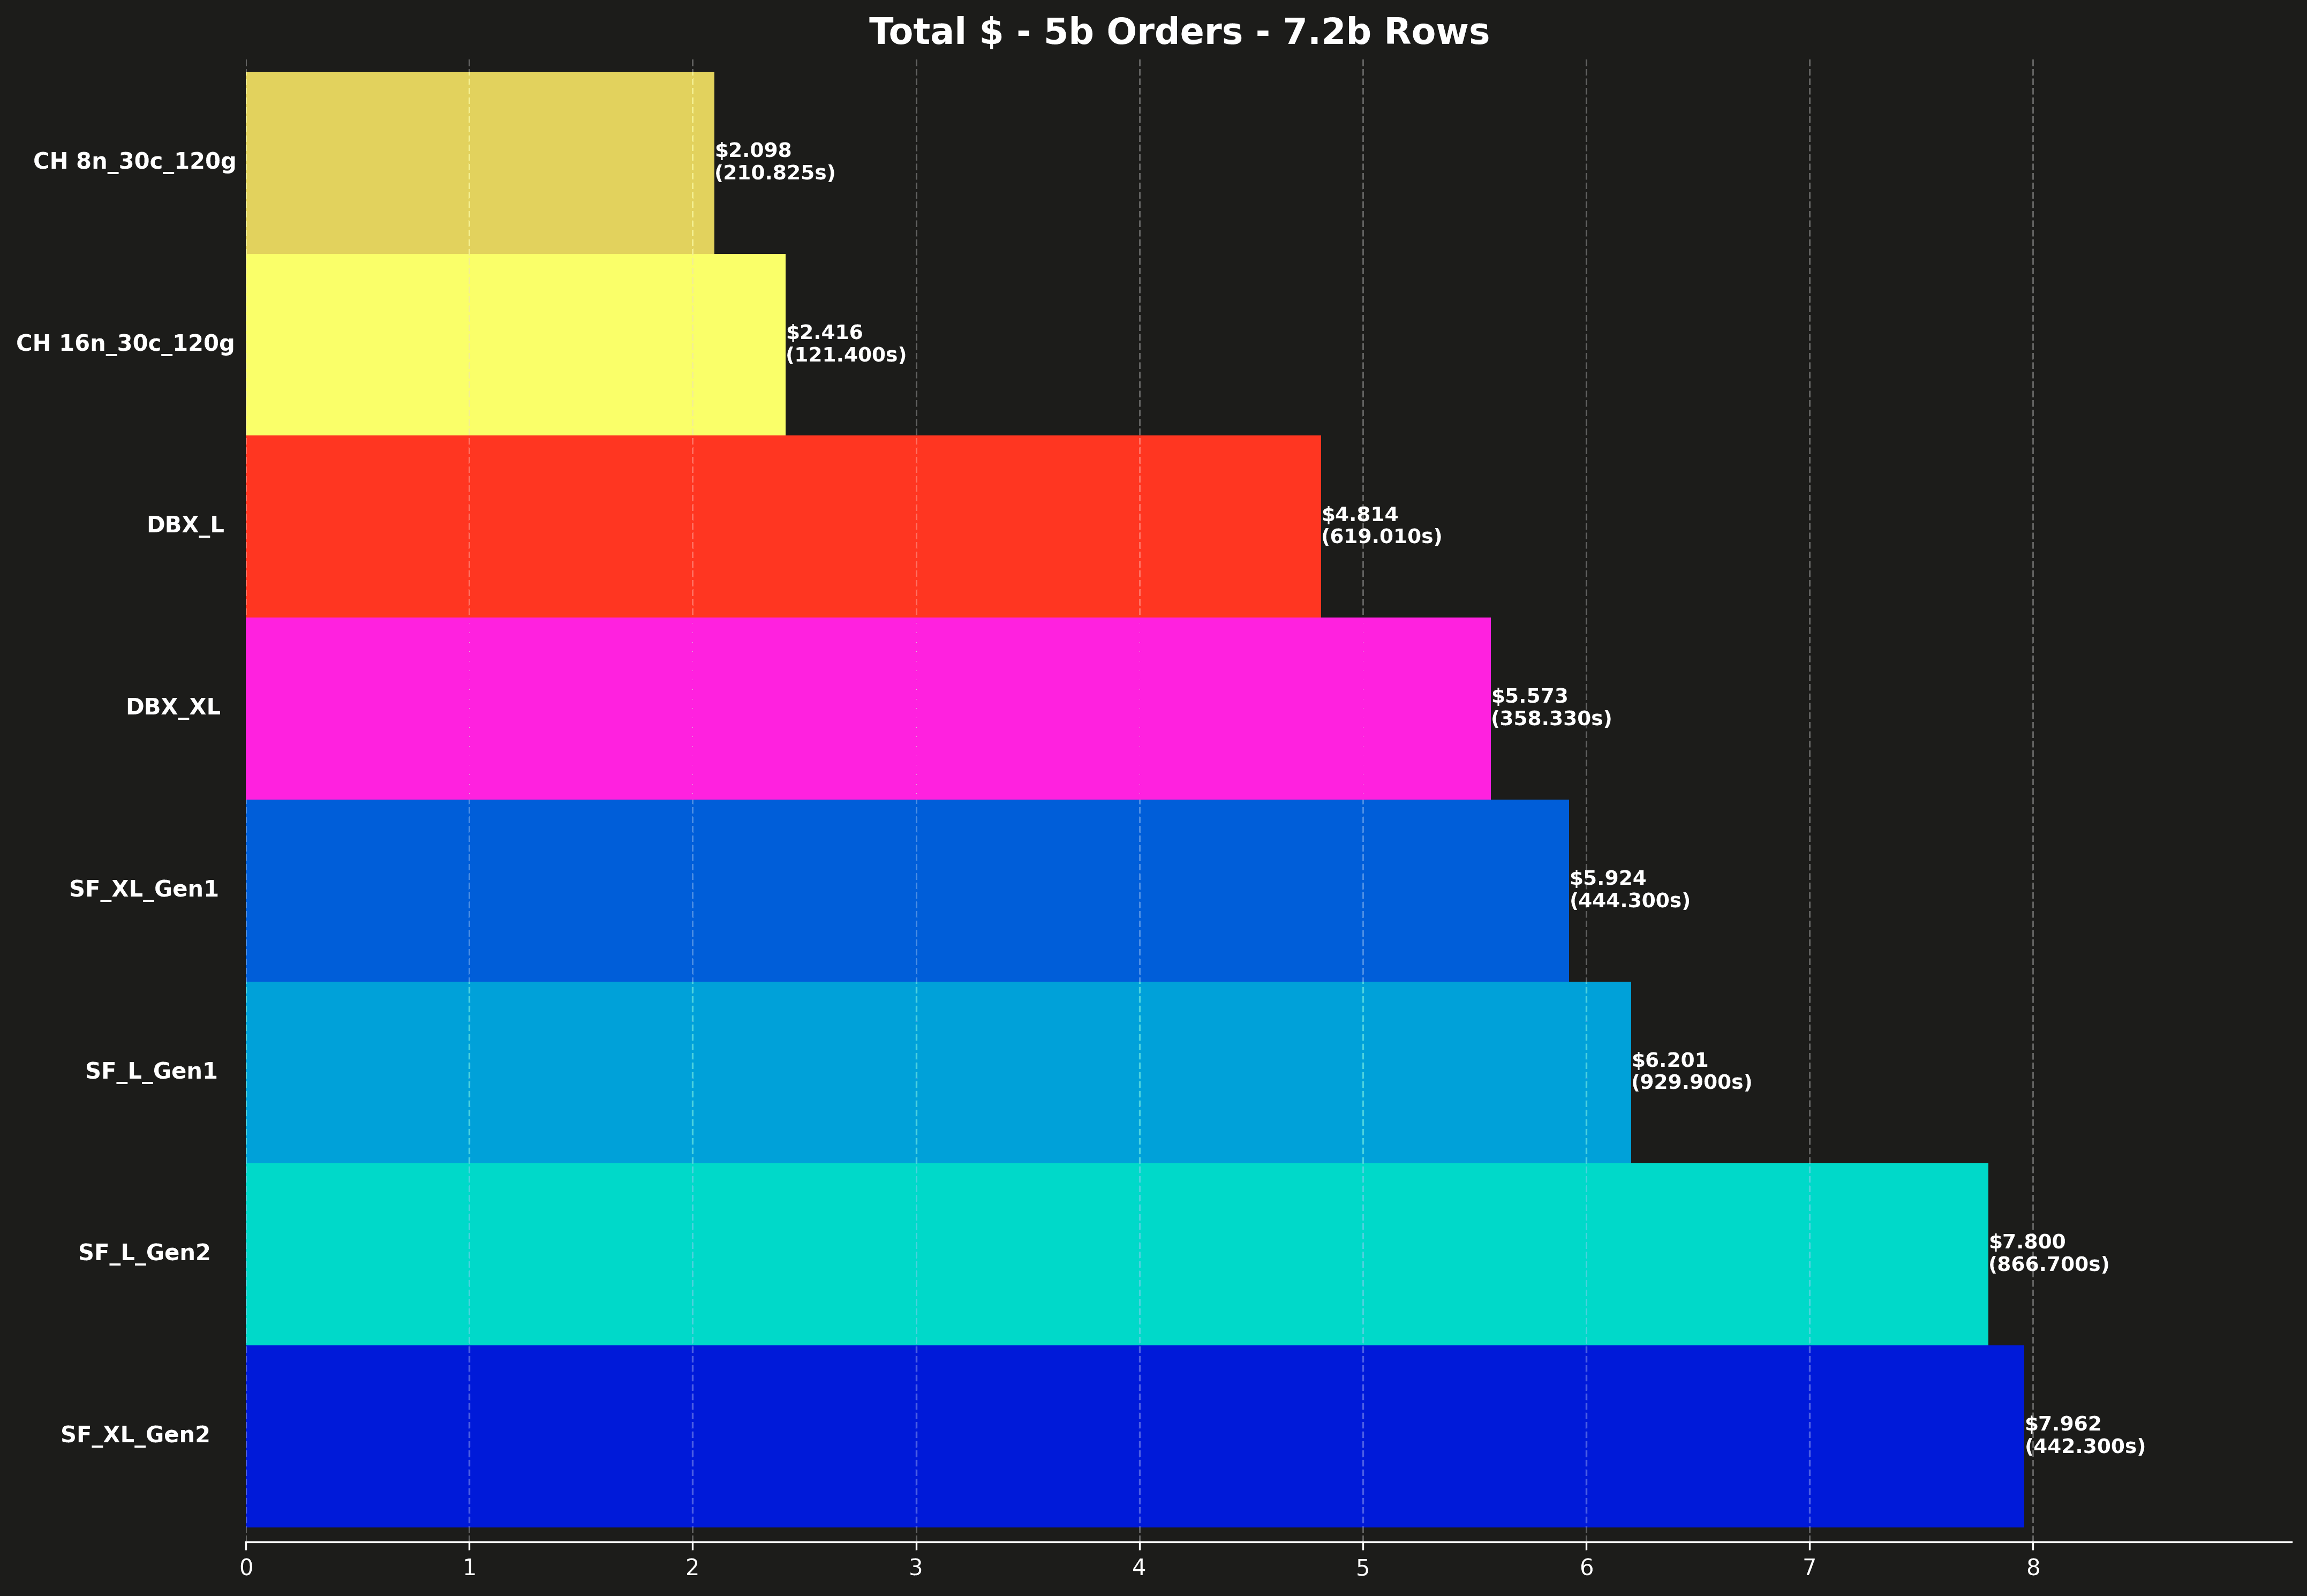
Each bar also shows the total runtime for all 17 queries, shown in parentheses.
Total runtime #
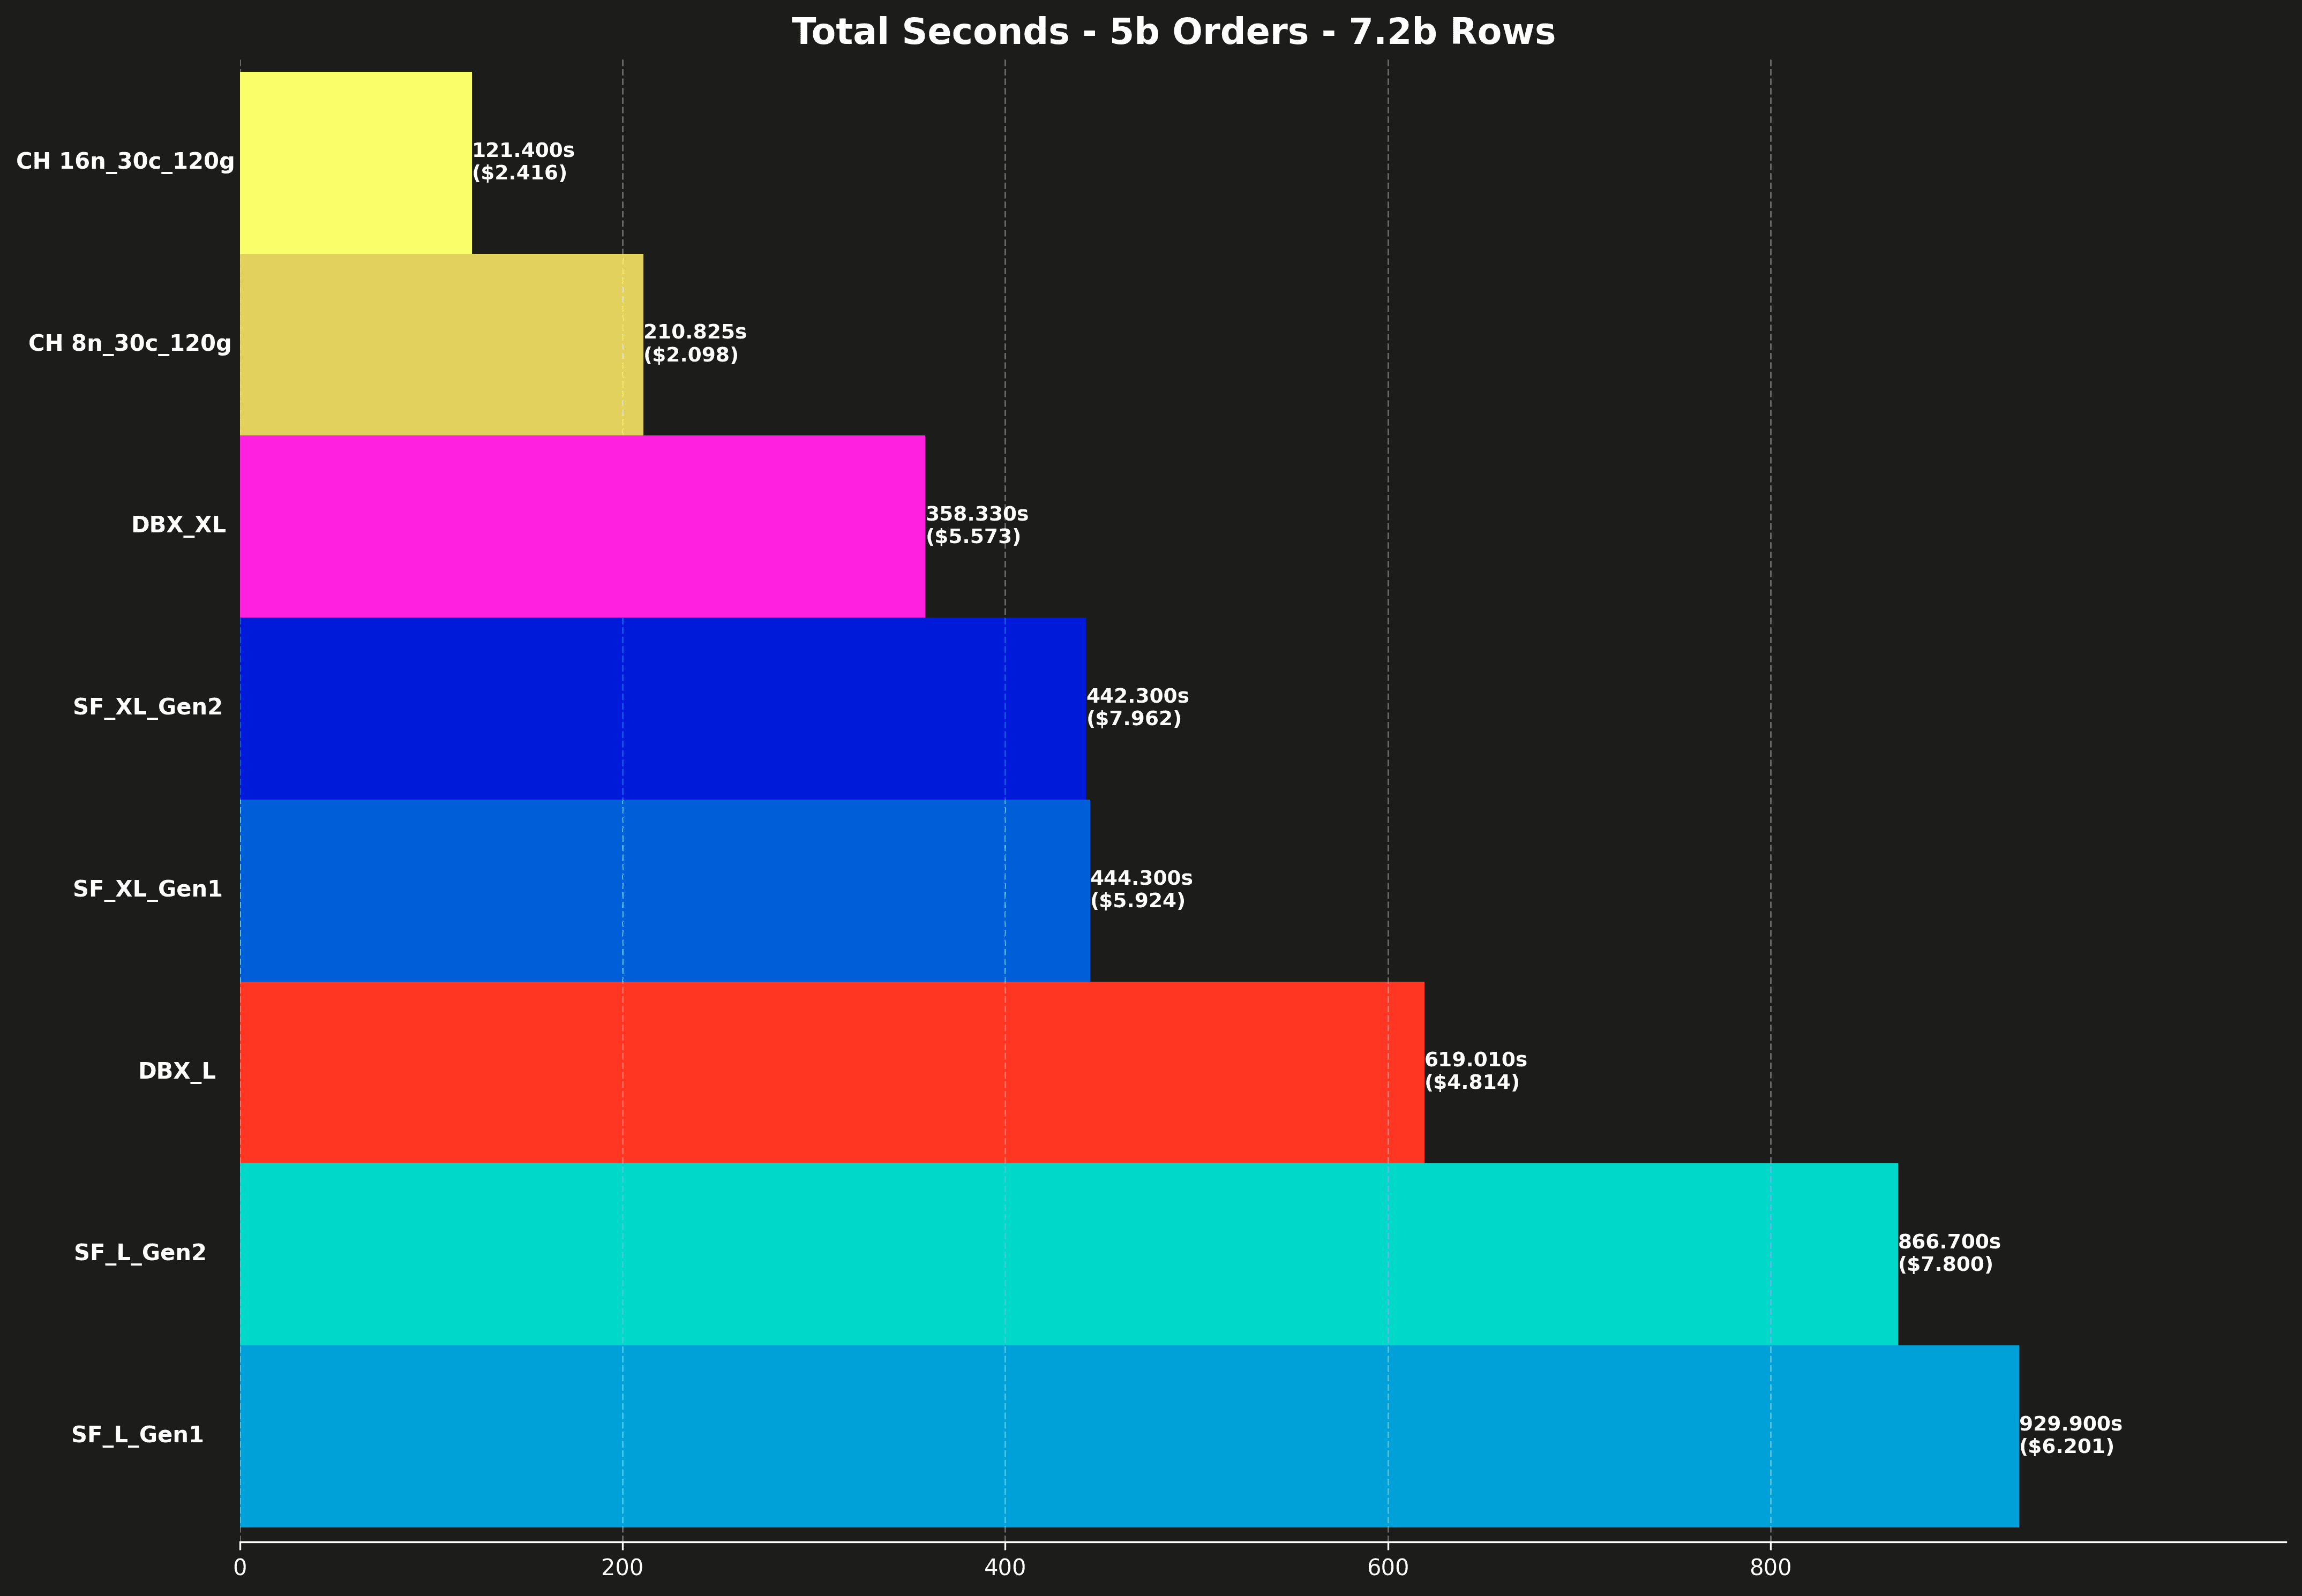
Each bar also shows the total cost for running all 17 queries, shown in parentheses.
Cost per query (excluding Q10 & Q16) #
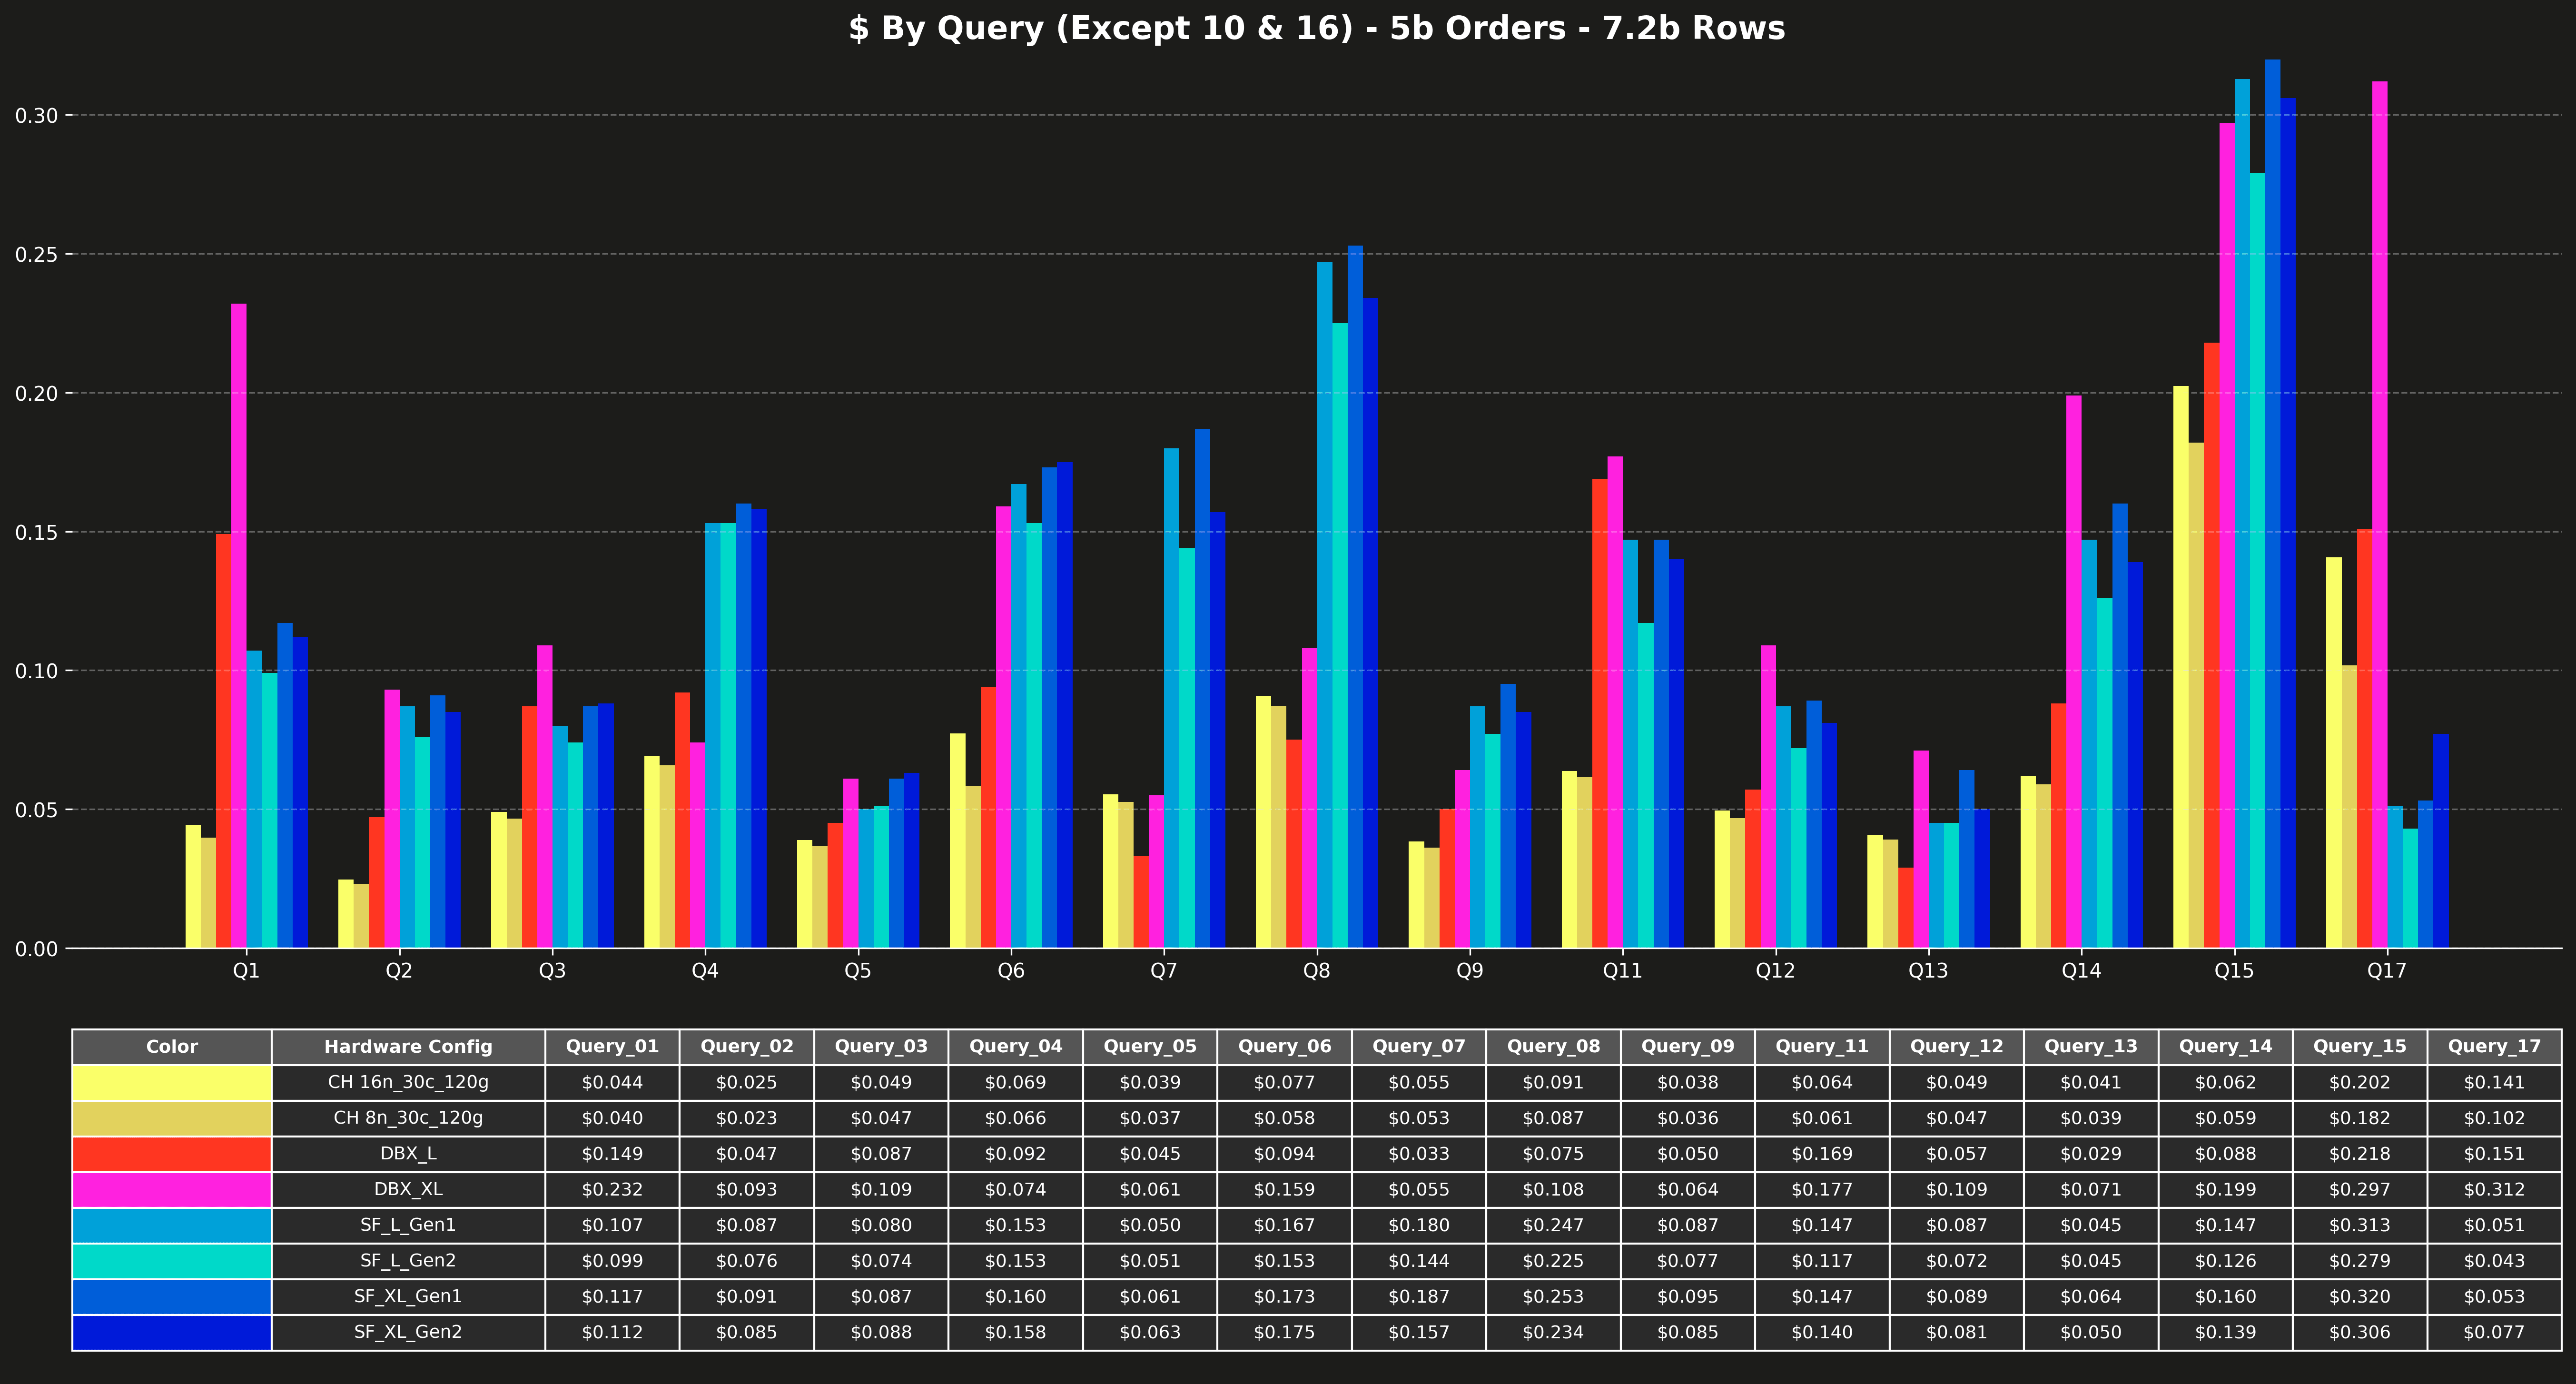
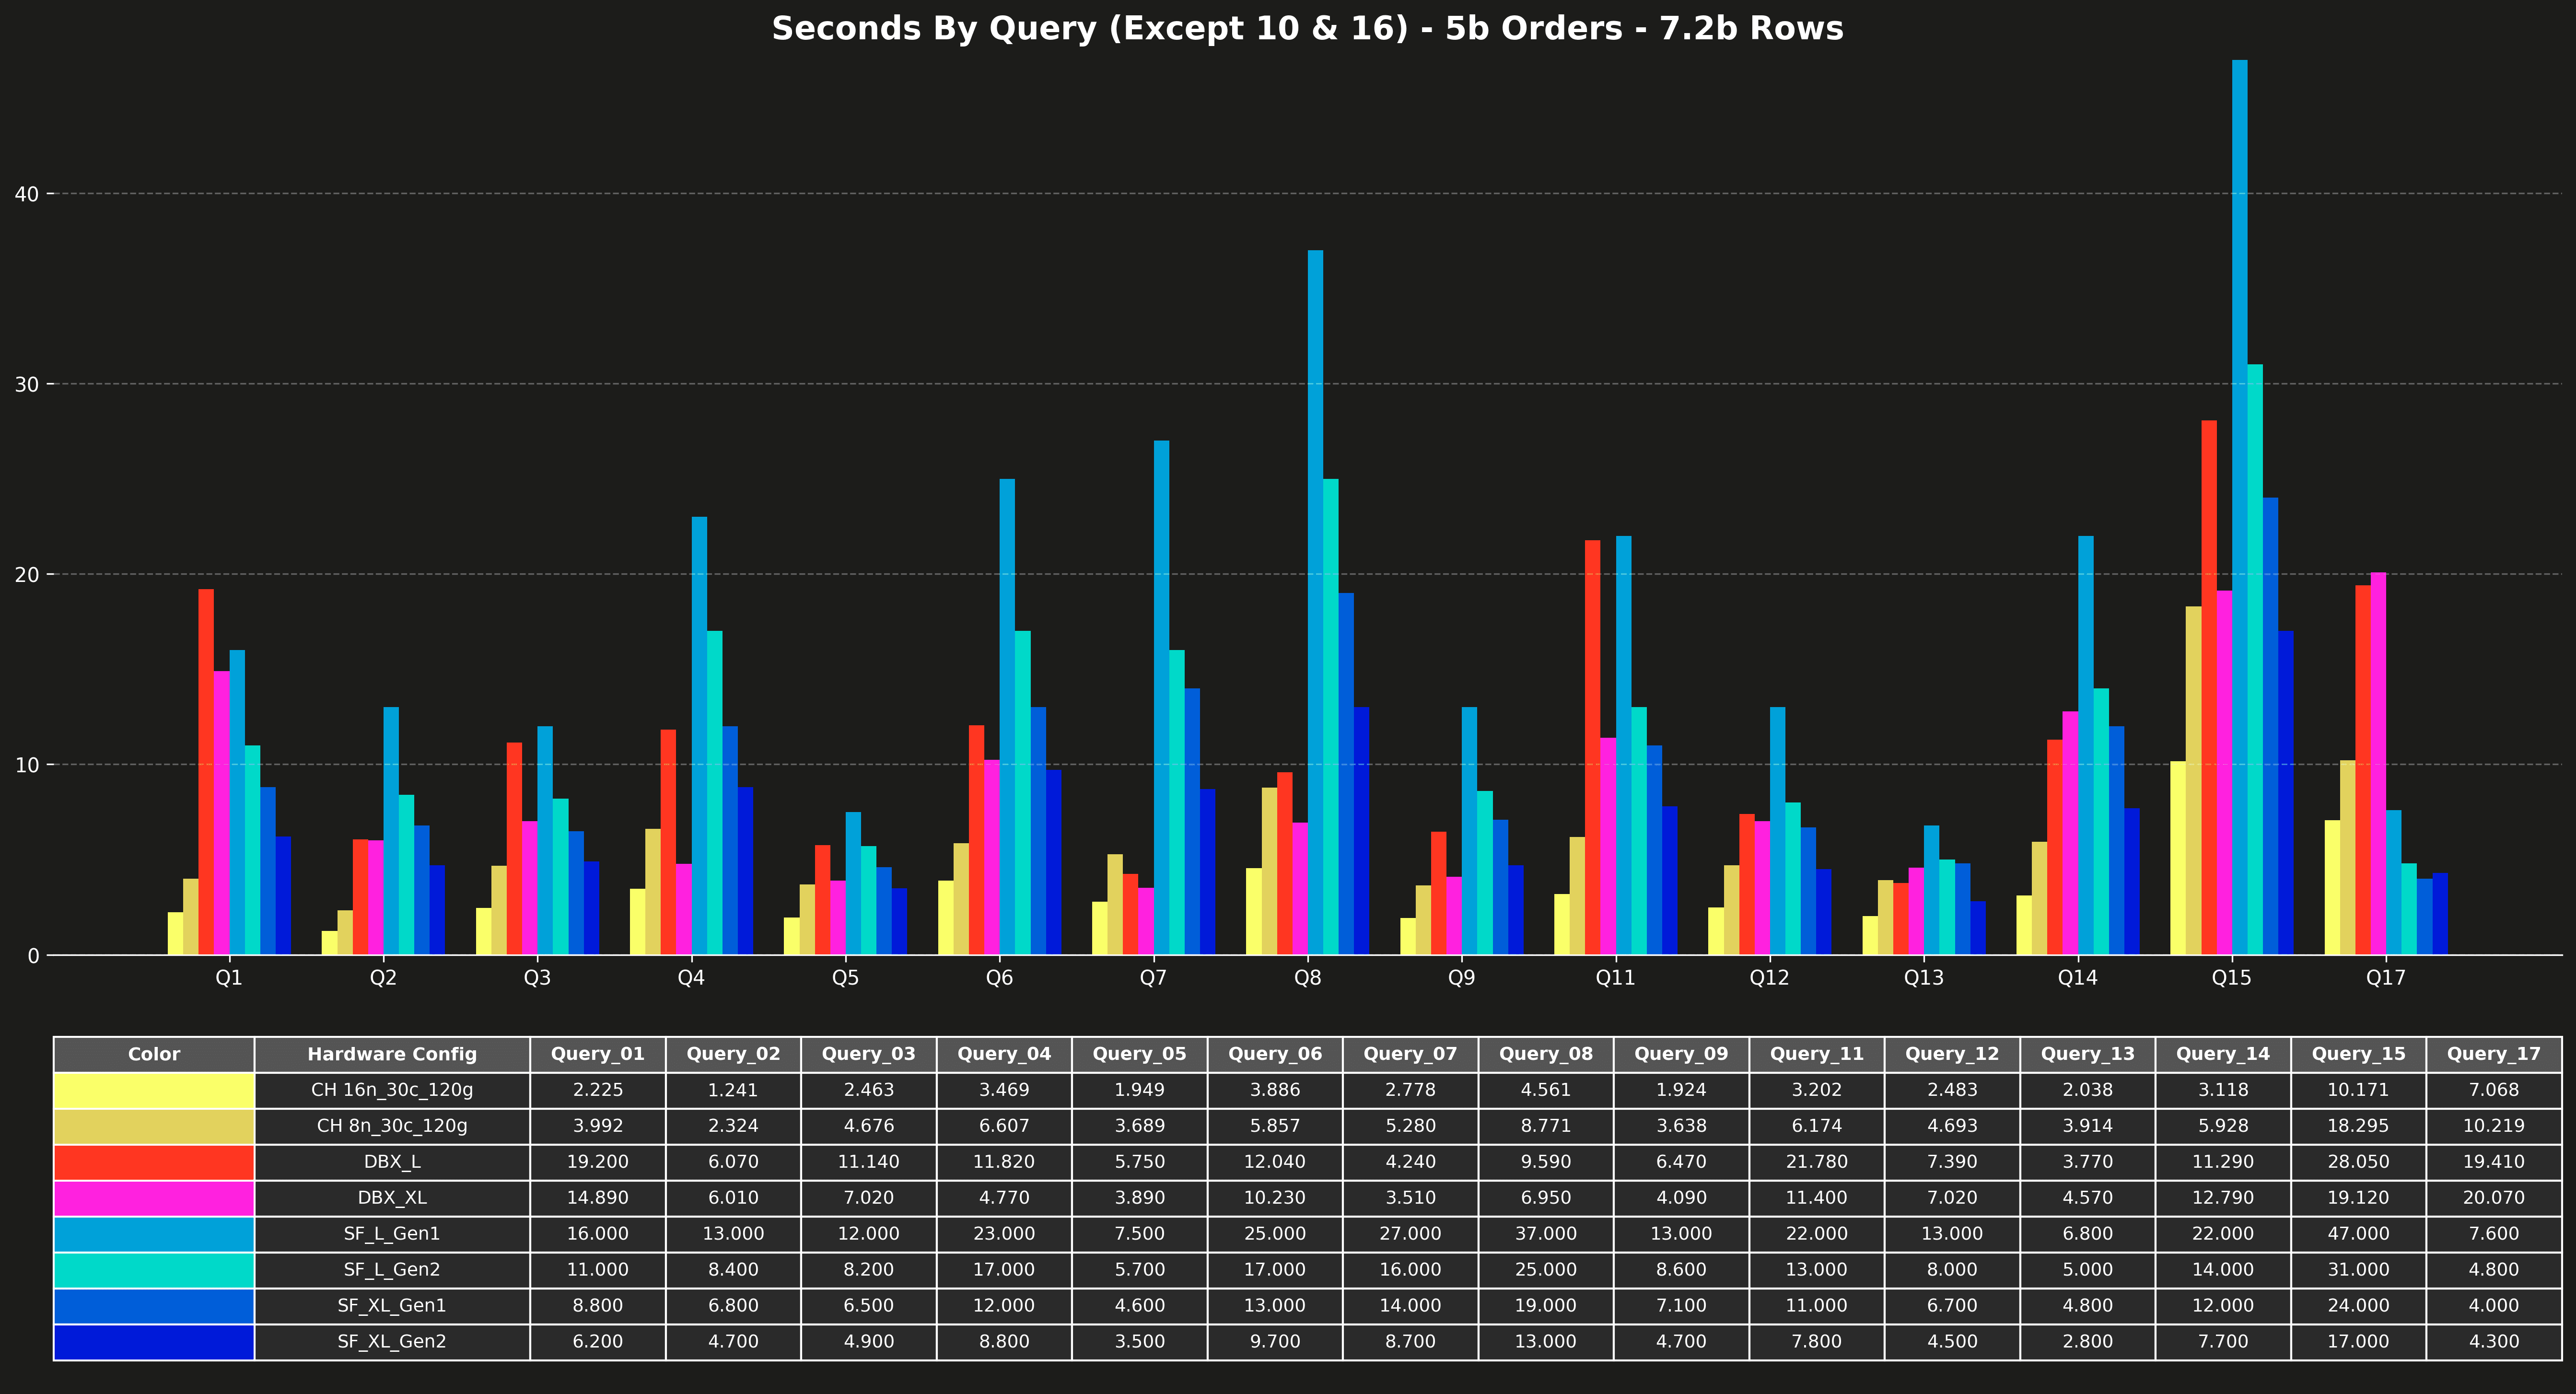
Runtime per query (excluding Q10 & Q16) #
Cost per query (Q10 & Q16 only) #
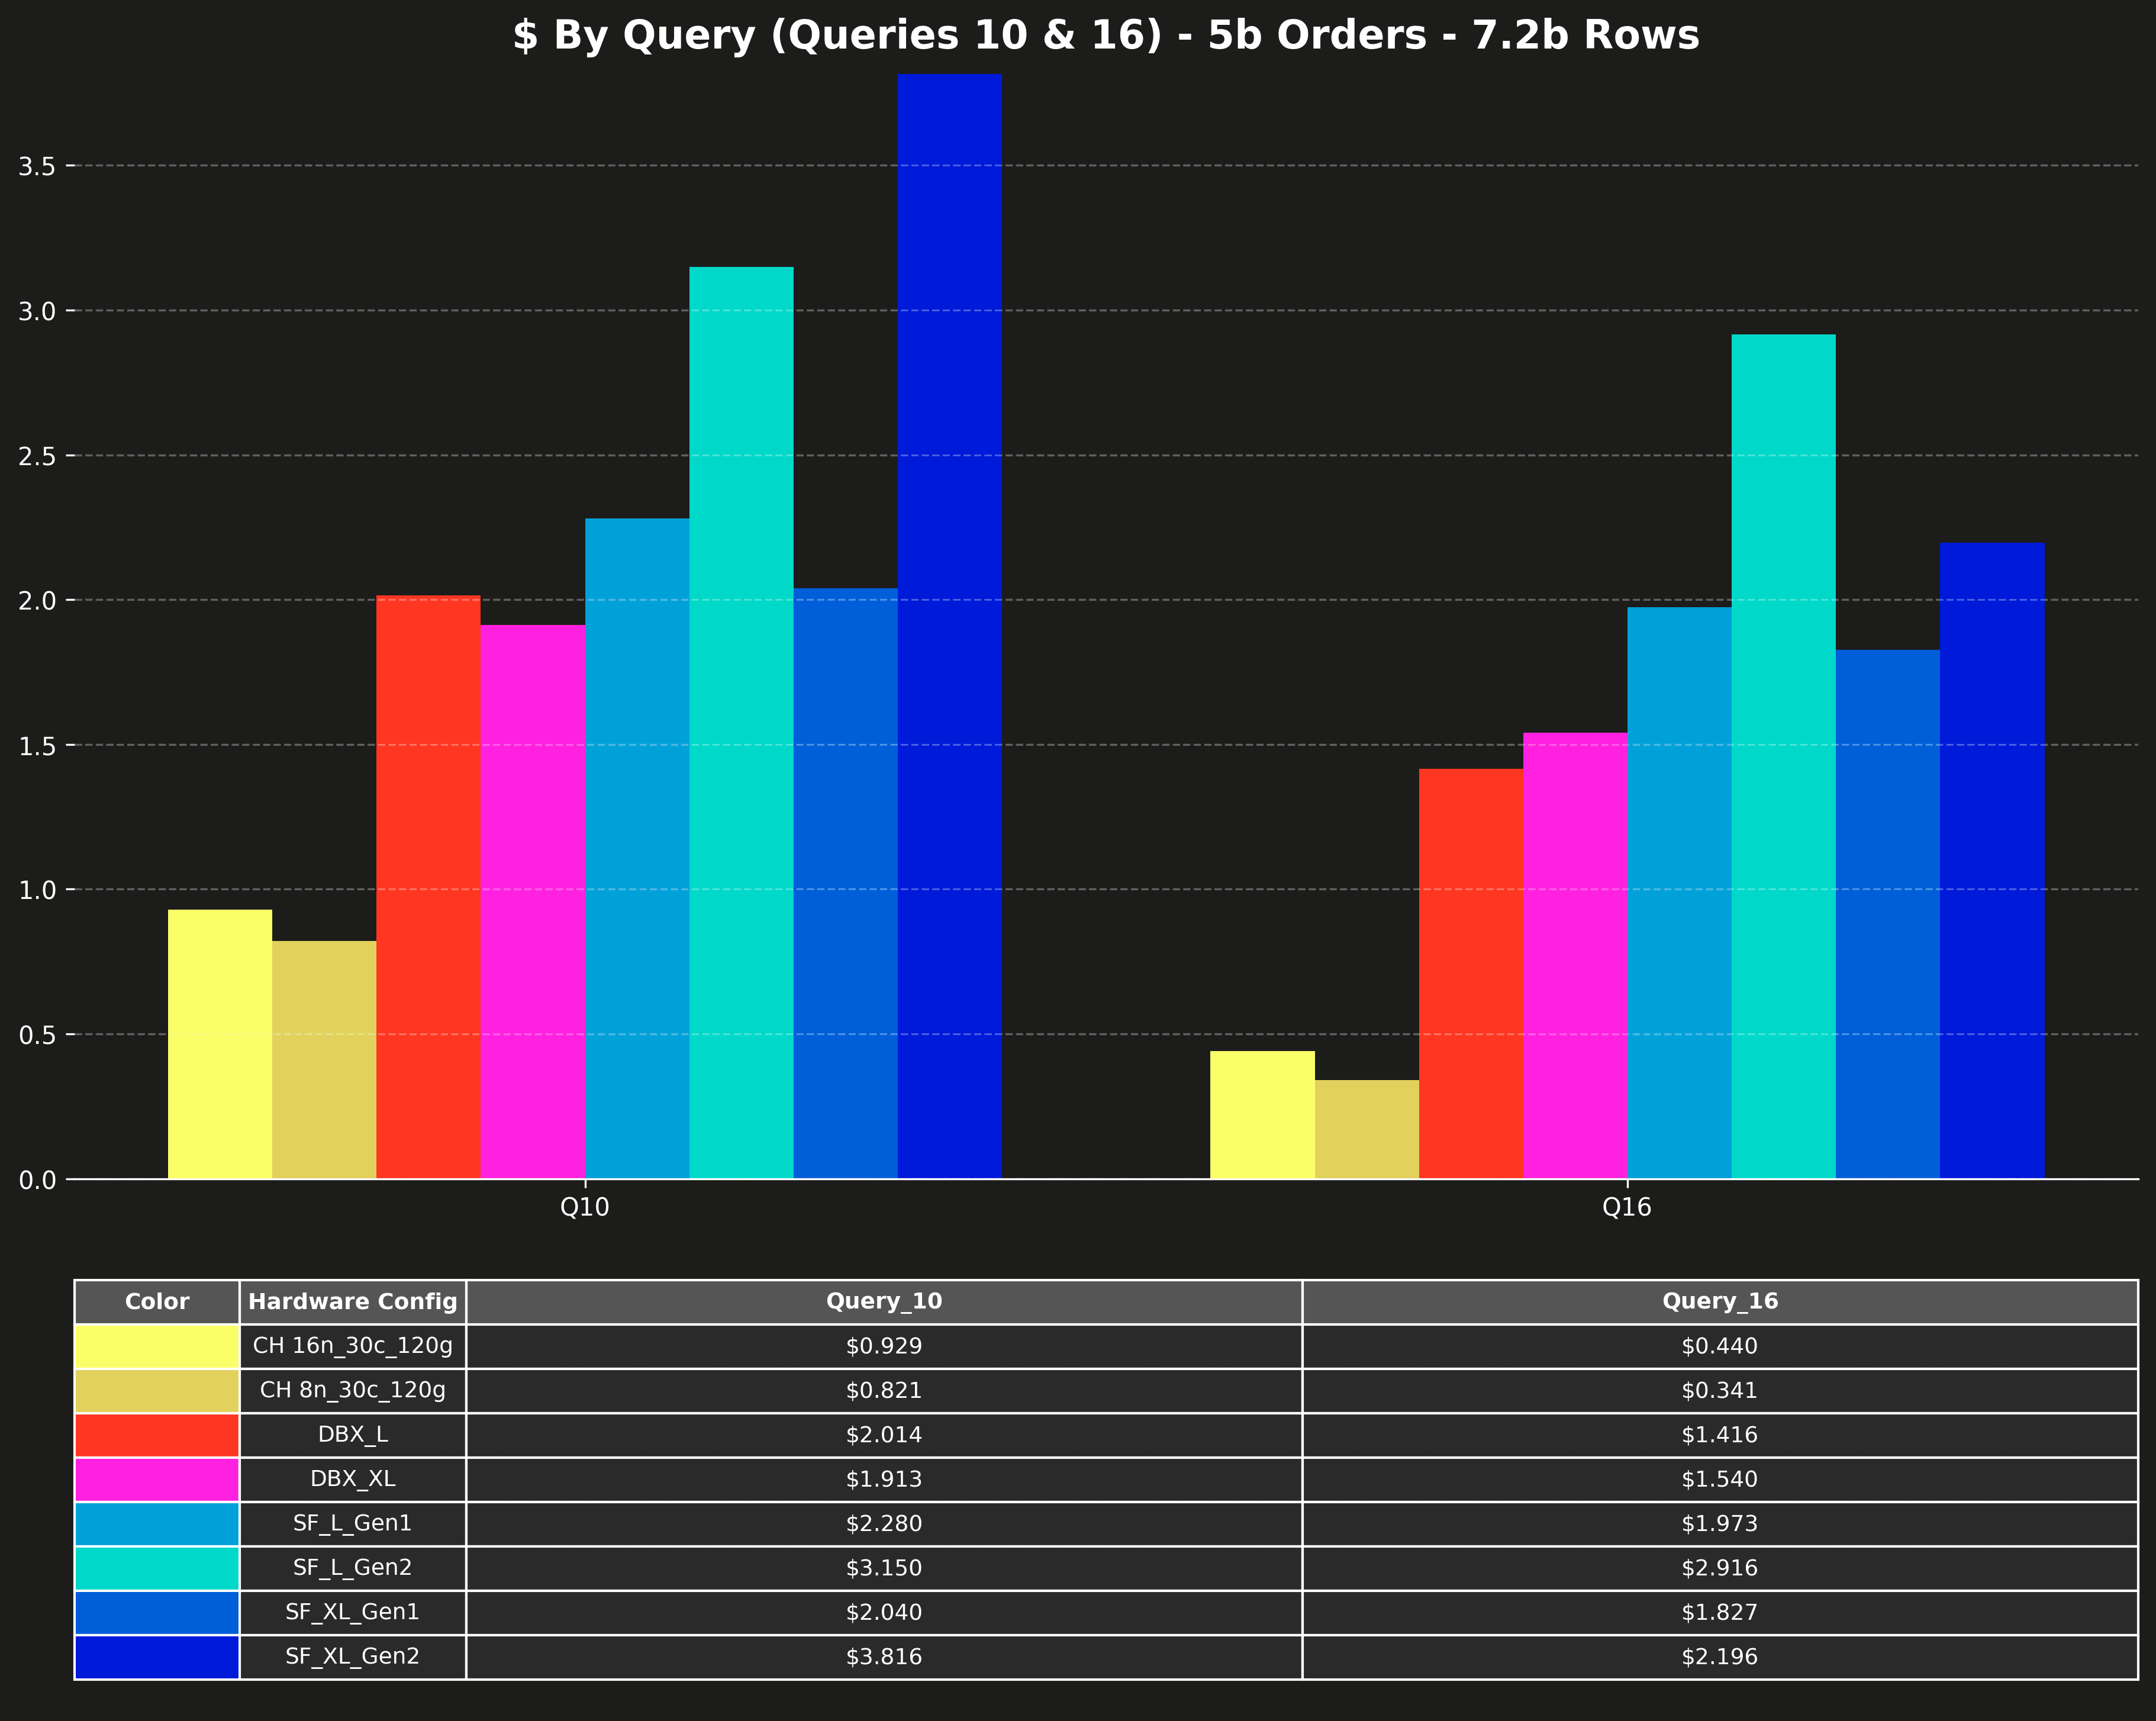
Runtime per query (Q10 & Q16 only) #
What we learned and what’s next #
ClickHouse is fast with joins. Really fast, across all scales.
The 17 queries in this benchmark focus on practical join workloads: 2–3 tables, no tuning, no rewrites. We ran them as-is to see how ClickHouse stacks up.
-
At 500m scale, most queries complete in under 1 second, with ClickHouse consistently 3–5× faster than the alternatives. And cheaper.
-
At 1b scale, ClickHouse joins, aggregates, and sorts 1.7 billion rows in just half a second, while other systems need 5 to 13 seconds, and still cost more.
-
At 5b scale, even the heaviest queries finish in seconds, not minutes, with ClickHouse staying the fastest and cheapest option overall.
We didn’t do anything special to get these results, no config tweaks, no ClickHouse-specific tricks. Just a clean run of the original benchmark.
In part 2, we’ll show you how to make it truly fast, the ClickHouse way, with a few powerful tricks up our sleeve.
Behind the scenes, we’ve spent the last 6 months making joins in ClickHouse much faster and more scalable, from improved planning and memory efficiency to better execution strategies.
And we’re not stopping here.
Next, we’re turning up the difficulty: full TPC-H, up to 8-way joins.
Want to see how ClickHouse handles the most demanding joins? Stay tuned for our TPC-H results.


