Introduction #
At ClickHouse, we are often asked how ClickHouse compares to Postgres and for what workloads it should be used. With our friends at Supabase introducing Foreign Data Wrappers (FDW) for their Postgres offering, we decided to use the opportunity to revisit this topic with a webinar early last week. As well as explaining the differences between an OLTP database, such as Postgres, and an OLAP database, such as ClickHouse, we explored when you should use each for an application. And what better way to convey these ideas than with a demo that uses both capabilities?
In this blog post, we show how we enriched an application built with Supabase with real-time analytics powered by ClickHouse and integrated using Supabase’s’ FDW. This demonstrates how users can query ClickHouse from a Supabase instance and thus integrate real-time analytics into an application without leaving the Supabase ecosystem and its familiar interfaces. We remind users of the difference between OLAP and OLTP and when each is the most appropriate choice when building an application. Finally, we touch on some FDW best practices and some options for pushing transactional data to ClickHouse when analytics need to be updated.
We have made the code available for our demo. Please excuse any rough edges and use for inspiration only.
Note: Supabase’s Clickhouse Wrapper is currently in Alpha and some functionality in this article might not be available for your Supabase project. If you need access, reach out to [email protected]: Supabase’s Clickhouse Wrapper is currently in Alpha and some functionality in this article might not be available for your Supabase project. If you need access, reach out to [email protected].
OLTP vs OLAP #
OLTP, or online transactional processing databases, are designed to manage transactional information.
The primary objective of these databases is to ensure that an engineer can submit a block of updates to the database and be sure that it will — in its entirety — either succeed or fail.
To demonstrate the utility of this, imagine you’re a bank, and you want to record a $10 wire transfer from one account (origin) to another (destination). Accomplishing this takes two steps:
- Deduct $10 from the origin’s account balance
- Add $10 to the destination’s account balance
It’s important that these two updates occur together or not at all. Otherwise, the bank may be left in a state where $10 is unaccounted for! (In the case where #1 is successful, and #2 fails).
These types of transactional guarantees are the main focus of OLTP databases.
Given these requirements, OLTP databases typically hit performance limitations when used for analytical queries over large datasets.
OLAP, or online analytical processing databases, are designed to meet those needs — to manage analytical workloads.
The primary objective of these databases is to ensure that engineers can efficiently query and aggregate over vast datasets. Real-time OLAP systems like ClickHouse allow this analysis to happen as data is ingested in real-time.
When is each most appropriate? #
OLTP databases excel when queries aim to retrieve a specific set of rows, potentially accessing a higher number of columns, and when data is subject to frequent updates that must be executed in real-time. By optimizing for high-speed transactions and concurrency, OLTP databases permit data to be accessed and modified simultaneously without conflicts. These access patterns make OLTP databases ideal for storing the data that maintains the application state and enables user interactivity. Postgres’ ability to respond rapidly despite high query concurrency under these workloads has made it the OLTP database of choice for applications, powering a wide range of use cases from e-commerce and financial trading platforms to customer service systems.
Conversely, OLAP databases, such as ClickHouse, excel at analytical queries that access many rows but few columns. These queries typically summarize billions (if not trillions) of rows using GROUP BY operations and analytical functions over several very large tables. These workloads are typically associated with larger datasets where query times of less than 50ms are still required. In order to deliver this high performance, OLAP databases typically sacrifice certain functionality such as transactions, support for limited query concurrency, update support, and requiring users to perform inserts in batches.
While ClickHouse can be categorized as an OLAP database, it also supports real-time analytical workloads, where query concurrency is typically much higher. This makes ClickHouse perfect for adding analytics to your application!
A real-world(ish) example #
To help users understand these principles, we decided to build an application utilizing each database appropriately. For any good demo, we need a dataset relatable to a real-world use case. The UK house price dataset, while moderately sized at around 30 m rows, may be useful to an estate agency business listing its properties online. This dataset has a row for every house sold in the UK since 1990. What if we could use this dataset as the basis for generating houses for sale but expose the full dataset in the form of analytics to assist users in their decision-making process when viewing a property? Never wanting to miss the opportunity for a good pun, HouseClick was born…”the fastest place to buy and sell your home” obviously.

Choosing technologies #
An estate agency business is not too dissimilar from an e-commerce site with respect to data access patterns - it needs to list products, provide rich functionality for searching, and the ability to retrieve specific products by id for detailed viewing. For this, an OLTP database is perfect. With some familiarity with Postgres and not waiting to host a database ourselves, Supabase was the perfect solution for our application data - specifically, our current properties for sale.
Supabase offers a real-time database that allows developers to store and sync data across multiple devices in real time. Simply put an OSS Firebase alternative. It also provides various backend services, including a serverless platform for running functions and hosting static assets.
With a rich set of clients that don’t require the user to write SQL (SQL-injection concerns addressed), as well as row-level security to limit anonymous users to read access, this provided the perfect solution to storing our current list of around 1000 properties for sale.
With our historical data loaded in ClickHouse Cloud for analytics, we next simply need to choose a web framework. With a basic familiarity of React and not wanting to spend significant time researching possible stacks, I yielded to advice from those at ClickHouse who do web development for more than creating fake estate agency businesses - NextJS with Tailwinds seemed to be the general recommendation. With three days assigned, I needed to find some actual properties for sale…
Generating data #
While the historical house price dataset provides us with some basic information regarding the address, price, and date a house was sold, it lacked the information we needed to build a rich, engaging estate agency website - missing titles, descriptions, and images.
SELECT *
FROM uk_price_paid
LIMIT 1
FORMAT Vertical

Row 1:
──────
price: 	1
date:  	1998-06-22 00:00:00
postcode1: CW11
postcode2: 1GS
type:  	detached
is_new:	0
duration:  leasehold
addr1: 	15
addr2:
street:	PENDA WAY
locality:
town:  	SANDBACH
district:  CHESHIRE EAST
county:	CHESHIRE EAST

1 row in set. Elapsed: 0.022 sec. Processed 57.34 thousand rows, 4.31 MB (2.64 million rows/s., 198.59 MB/s.)
Selecting 1000 random properties, we projected a 2023 valuation based on their original date of sale and price using the price increase for their property type in their respective postcode - adding a little variance to ensure some houses seemed better deals than others.
Using this price and the properties area, we tried to project a house size i.e. number of bedrooms, using some very crude heuristics - admittedly, this was far too simple and later produced some amusing results, especially when combined with images.
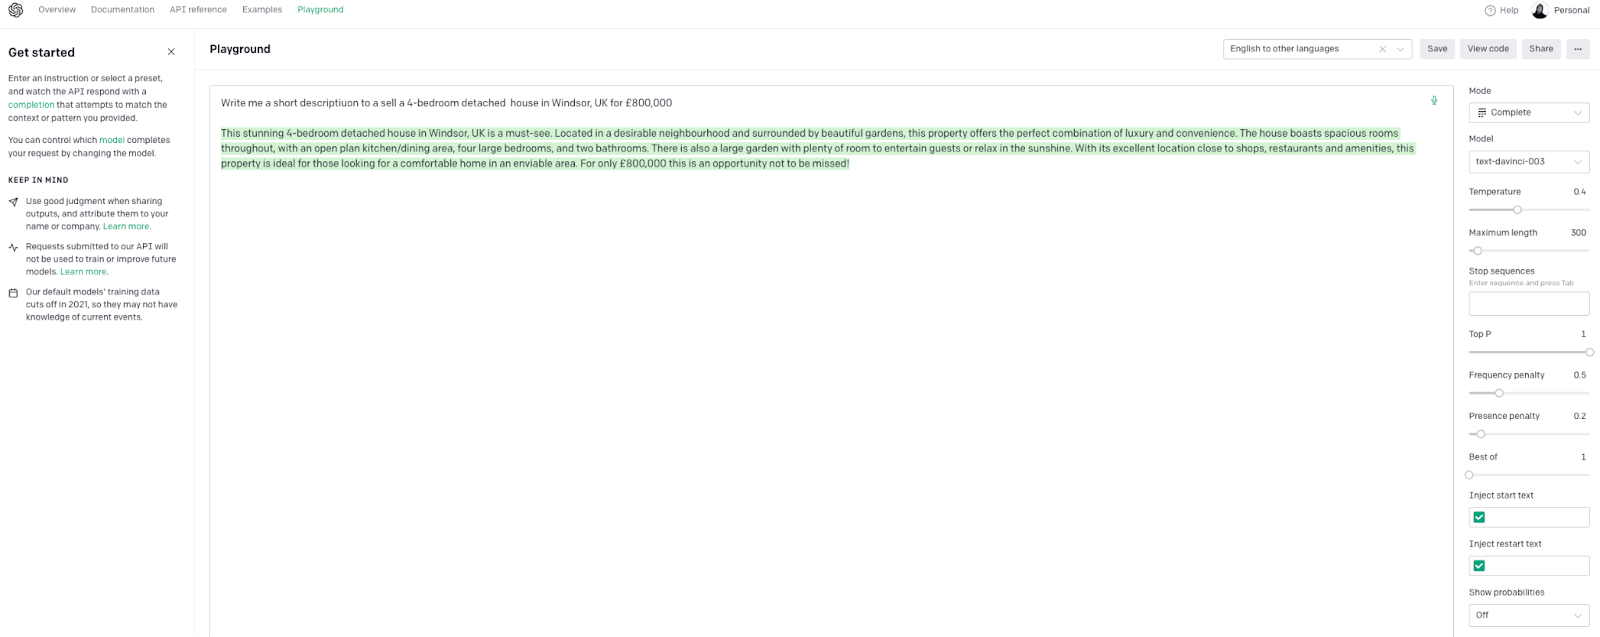
For descriptions, titles and a list of possible house features we turned to the Open AI’s Text Completion API and ChatGPT-3 text-davinci-003 model. This cost around $10 for all 1000 properties.
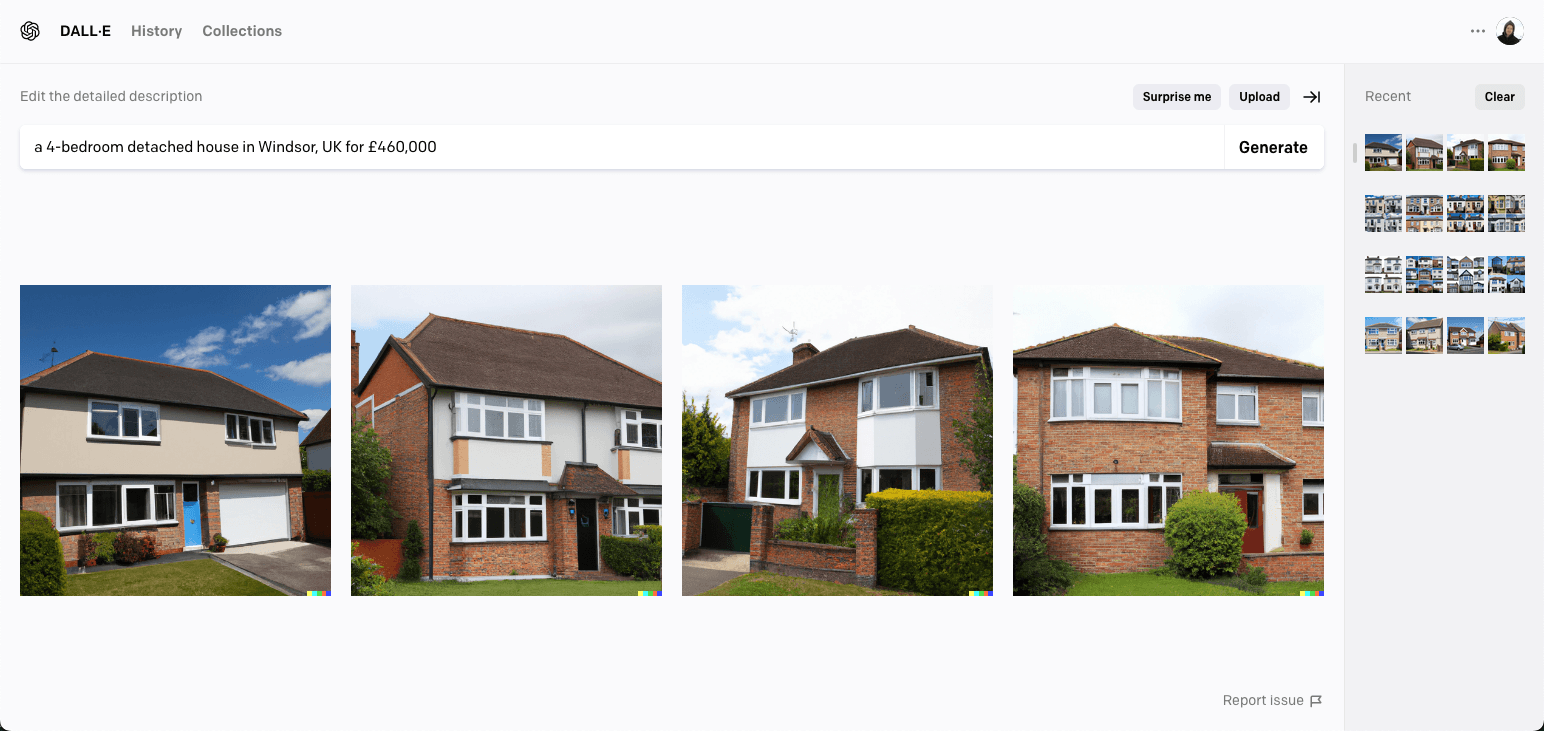
Satisfied with our AI-based estate agent, we just needed images. While AI-generated images were viable, using the DALL-E model, they tended to produce fairly unengaging images.
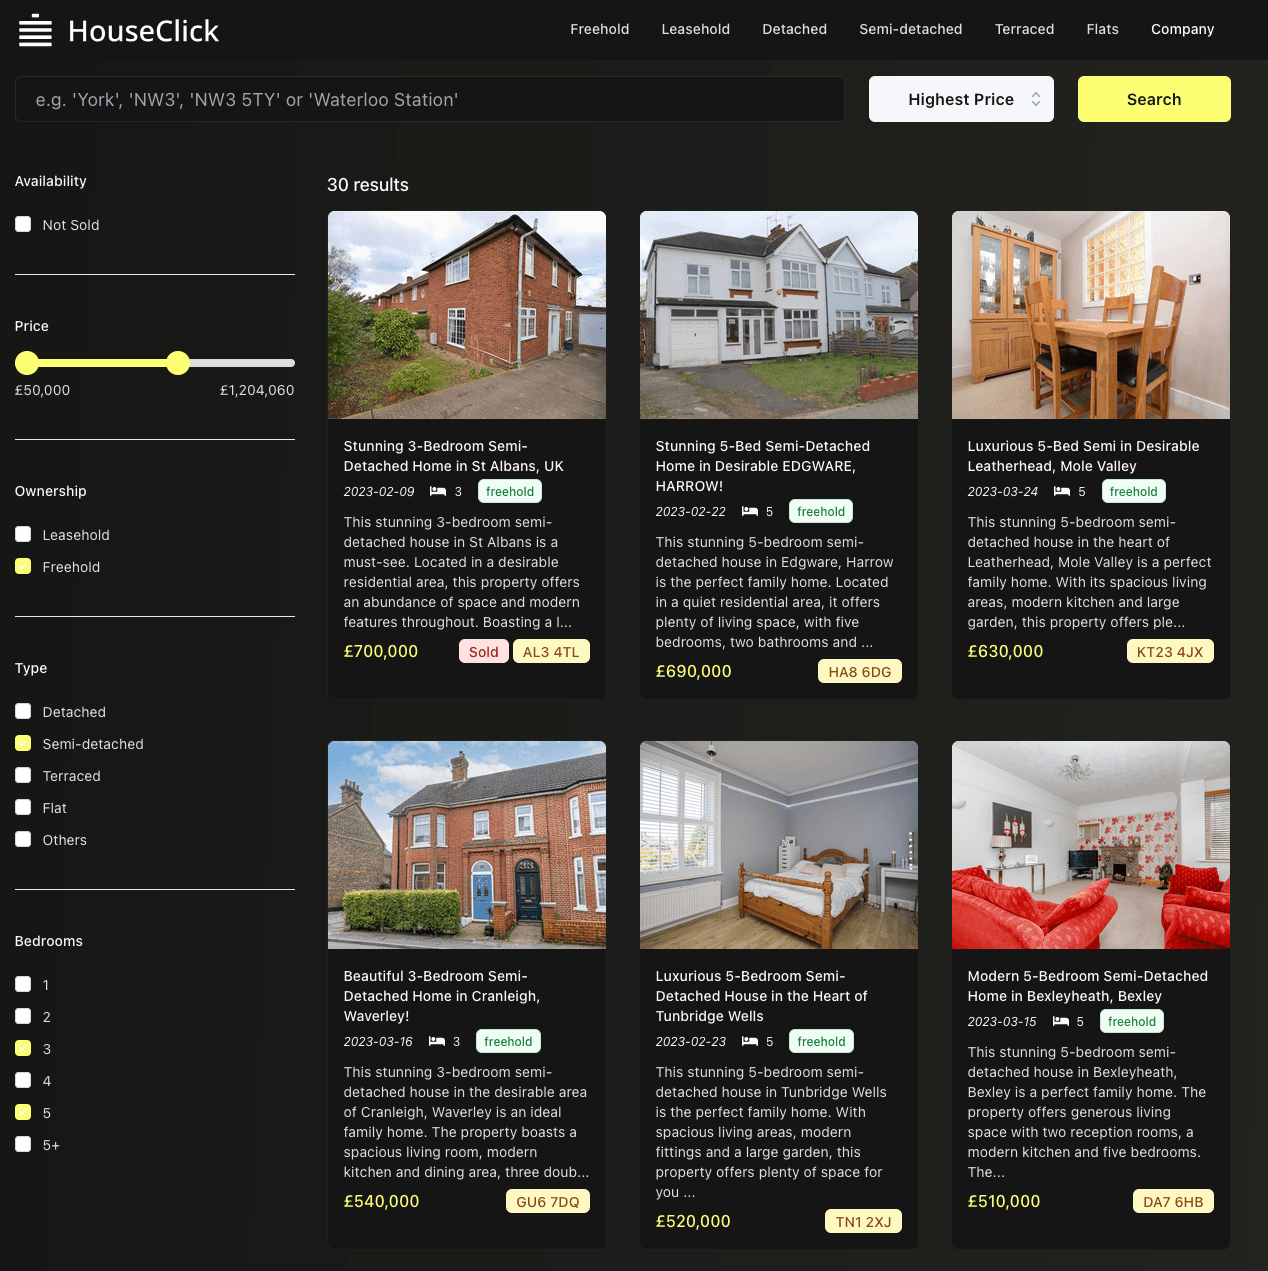
Armed with our titles and descriptions, the Bing Image API generated more appealing images for a demo. Combined with rather optimistic pricing, this rather crude method admittedly led to some amusing results.

Not needing to sell the properties and dreaming of buying a 24-bedroom house in Windsor for £460,000, we combined the above techniques into a single script and generated our 1000 properties as a CSV.
Building rich experiences easily with Supabase #
Aside from taking away the hassle of deploying and managing Postgres, Supabase provides a number of features that notably accelerated development:
- Allows users to apply access policies permitting only read access for users with an anonymous token. This meant for client-side rendered pages, such as search, we could safely query the database from the browser - avoiding needing to write server-side API endpoints.
- A simple data loading API which allowed us to load our listings with zero code (we also wrote a convenience script but this got us started quickly).
- Full-text search capabilities using Postgres indexes avoid the need for a dedicated search engine such as Elasticsearch.
- A rich Javascript client that made formulating SQL queries easy using method chaining. This was particularly useful when combining filters and sorting in a simple search UI e.g.
const { data, error } = await supabase.from(table).select('id,type,price,town,district,postcode1,postcode2,duration,urls,description,title,rooms,sold,date').order('date', {ascending: false}).limit(4)
Adding Analytics #
Unlike our current listings, our historical price data is based on real UK house sales. Loading this into ClickHouse takes only two commands, as specified in our documentation.
With the dataset loaded, we need to choose some analytics that might be useful to a user buying a house. On viewing a specific property, maybe purchasers are interested in:
- The historical prices for the area and how they compare to the national average
- How much has the area's postcode increased over the last 30 yrs relative to the average
- When are houses bought and sold in the area?
- How does the area compare to the rest of the country, i.e., what percentile does it lie in the price distribution?
These are simple to formulate in ClickHouse SQL thanks to the support for functions that make analytical queries easy to write. The query below queries for the average house price for the postcode 'SL4' over the last 30 yrs, by month, as well as the average price for the whole country.
SELECT
	toStartOfMonth(date) AS month,
	round(avgIf(price, postcode1 = 'SL4')) AS filter_price,
	round(avg(price)) AS avg
FROM uk_price_paid
GROUP BY month
ORDER BY month ASC
LIMIT 10

┌──────month─┬─filter_price─┬───avg─┐
│ 1995-01-01 │   	123855 │ 68381 │
│ 1995-02-01 │   	103594 │ 65646 │
│ 1995-03-01 │   	118140 │ 65750 │
│ 1995-04-01 │   	113352 │ 67835 │
│ 1995-05-01 │   	116996 │ 67079 │
│ 1995-06-01 │   	107411 │ 67990 │
│ 1995-07-01 │   	110651 │ 70312 │
│ 1995-08-01 │   	123354 │ 70601 │
│ 1995-09-01 │   	111195 │ 68368 │
│ 1995-10-01 │   	128282 │ 67573 │
└────────────┴──────────────┴───────┘

10 rows in set. Elapsed: 0.303 sec. Processed 28.11 million rows, 290.73 MB (92.90 million rows/s., 960.73 MB/s.)
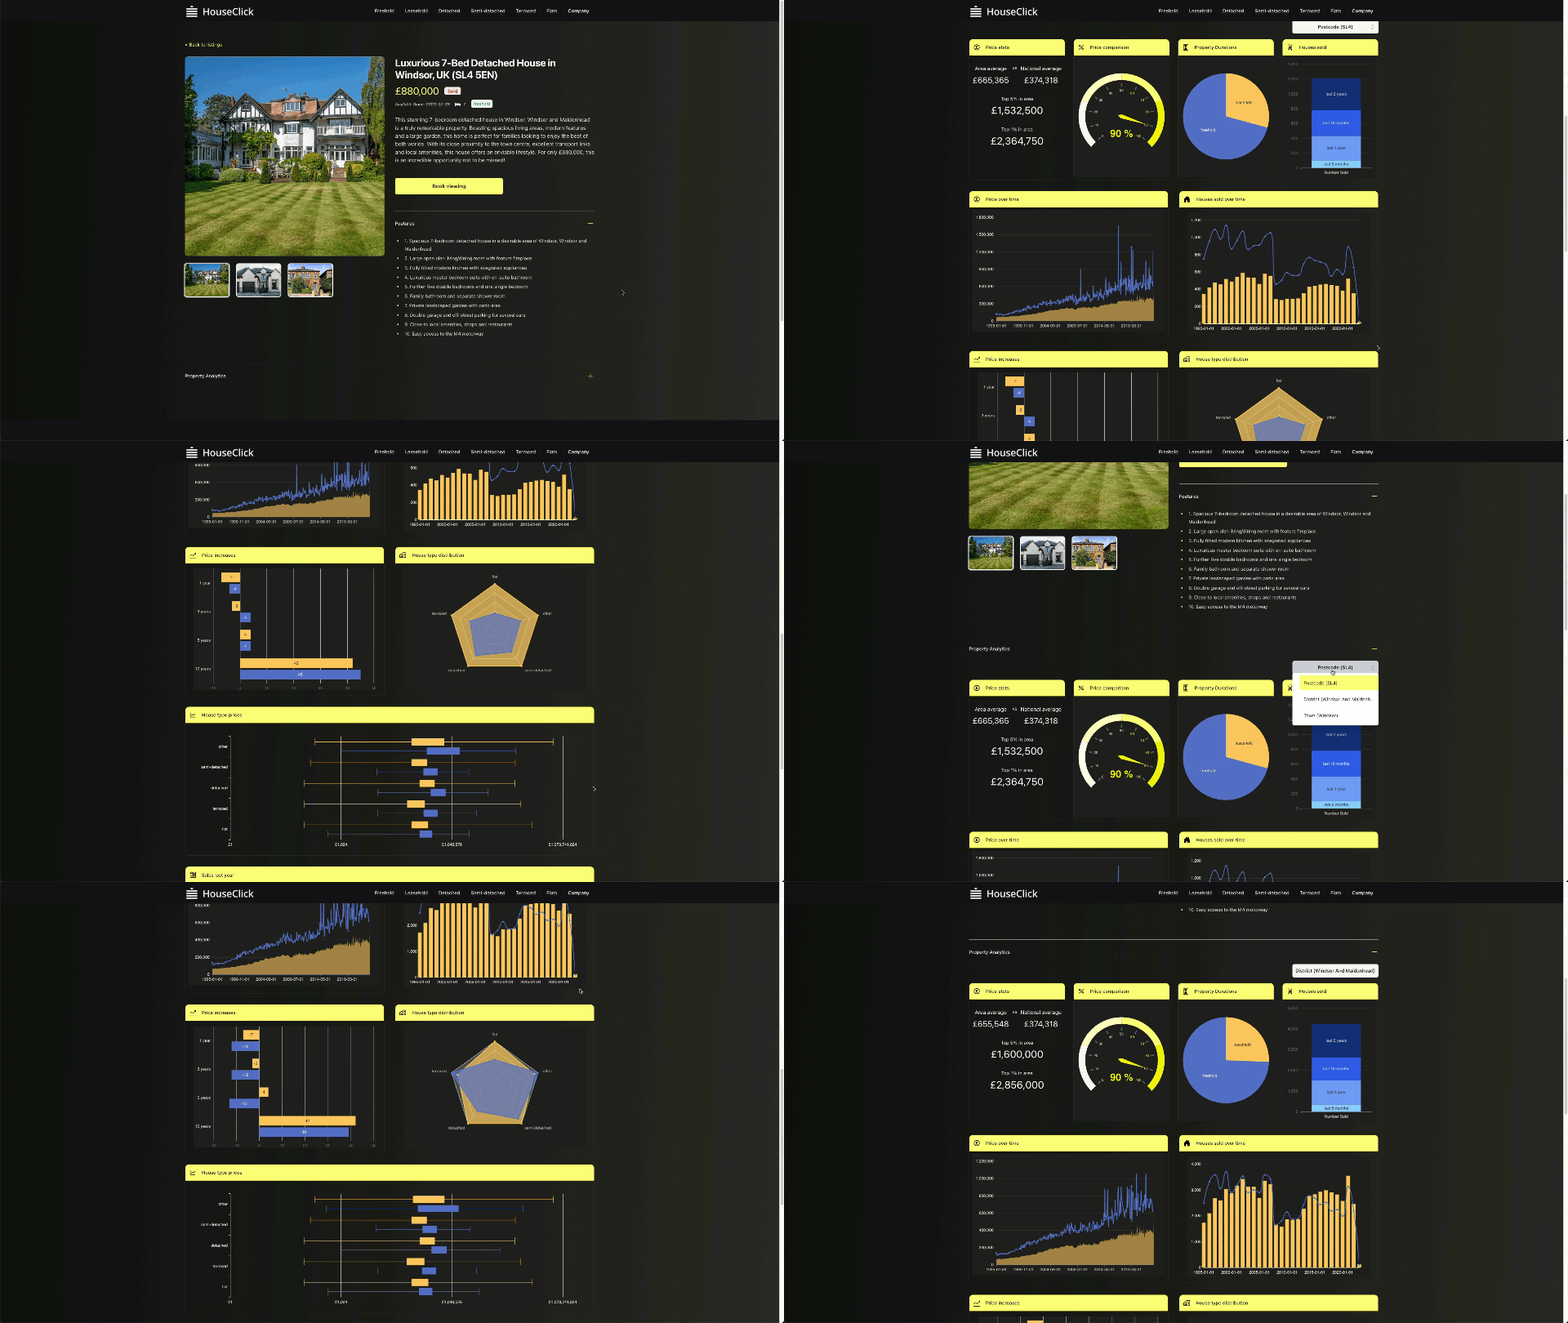
After formulating a number of these queries, we needed a visualization method. With the Clickhouse Javascript client supporting the return of results in JSONEachRow format, Apache ECharts seemed ideal, given its configuration utilizes simple JSON objects. With some simple map functions, we were able to achieve reasonable results with minimal effort. The above query translates to a bar and line.
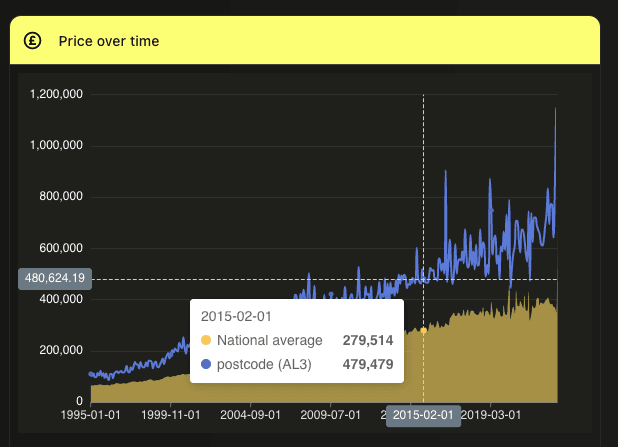
Adding these to the view for a specific property provided an obvious way to introduce these analytics. As well as allowing the user to obtain an overview of the properties’ postcode, we allow the filter to be changed such that data is aggregated from the perspective of town and district.
Foreign Data Wrappers - a single endpoint #
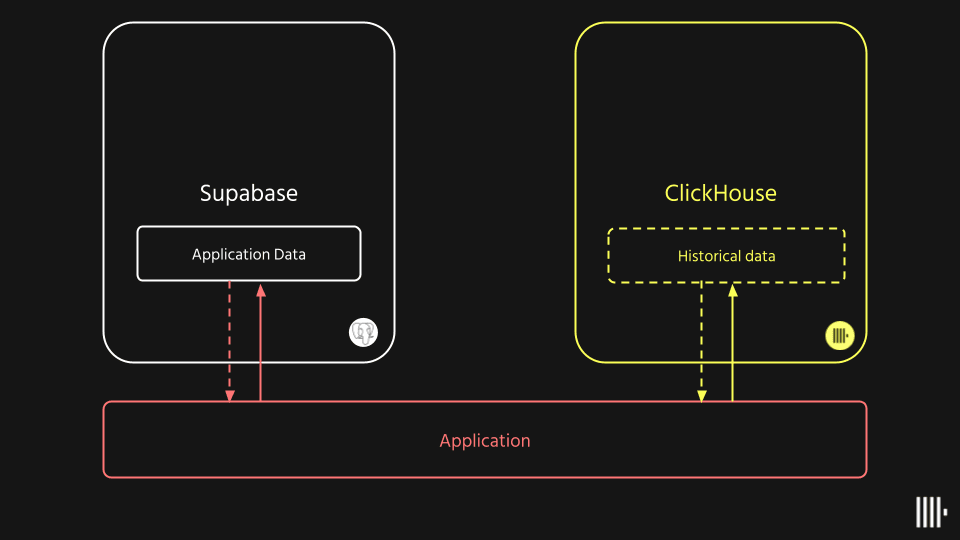
Initially we added analytics to our application by querying ClickHouse directly using the JS client, to deliver the architecture shown above. This is fine; it's fast and works. However, suppose we aspired to communicate through a single interface and not burden our developers with having to maintain multiple connections and learn two libraries and syntaxes. To allow this, Supabase provides Foreign Data Wrappers (FDW). These allow Postgres to connect to external systems such as ClickHouse, querying the data in place.
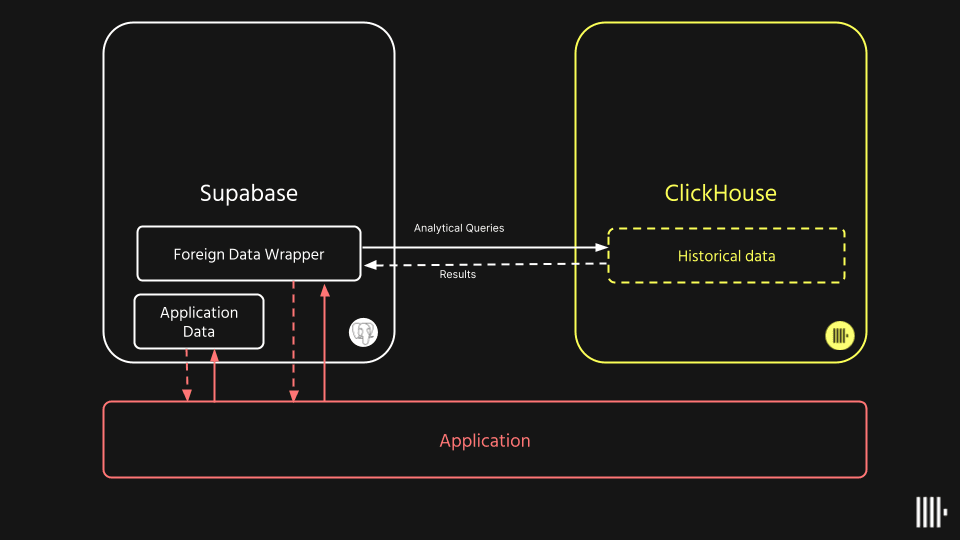
Whereas other similar technologies may aim to pull the datasets into the query engine to perform filtering and aggregations, FDWs emphasize relying on an extract-only methodology where the query is pushed down and aggregation and filter performed in the target data source. Only the results are then returned to Postgres for display. This approach has some distinct advantages with respect to ClickHouse. With billions, if not trillions, of rows in ClickHouse, pulling the source data into Postgres is infeasible. By pushing the query down and allowing ClickHouse to do what it does best (aggregate very large datasets quickly), the FDW can scale by minimizing transferred data while still exposing real-time analytics in an end-user application through a consistent interface where developers aren't required to learn a new tool or language client.
Other possible benefits of this approach include:
- Providing an interface aggregator similar to GraphQL engines but through a language, all developers are familiar with - SQL.
- Offloading workloads which are inappropriate for Postgres, e.g., analytics to queries to specialized data stores such as ClickHouse or even APIs such as OpenAI.
- By not moving the data, it is always in sync with the underlying data stores. Developers don’t need to worry about maintaining complex ETL pipelines.
- Transactional/operational data can be joined with analytics data in ClickHouse, exposing new features such as in our HouseClick example.
- Reduction of infrastructure to manage as well as savings in setup time and bandwidth.
Adding a Foreign ClickHouse table to Supabase is trivial. Firstly we need to enable the foreign data wrapper for ClickHouse by installing the extension and specifying the handler and validator.
create extension if not exists wrappers;
create foreign data wrapper clickhouse_wrapper
 handler click_house_fdw_handler
 validator click_house_fdw_validator;
Once installed, we can create a connection to ClickHouse. Note that the below example passes the credentials in plain text. Supabase supports more secure storage of credentials using pgsodium and Vault.
create server clickhouse_server
  foreign data wrapper clickhouse_wrapper
  options (
	conn_string 'tcp://default:<password>@<host>:9440/default?connection_timeout=30s&ping_before_query=false&secure=true'
  );
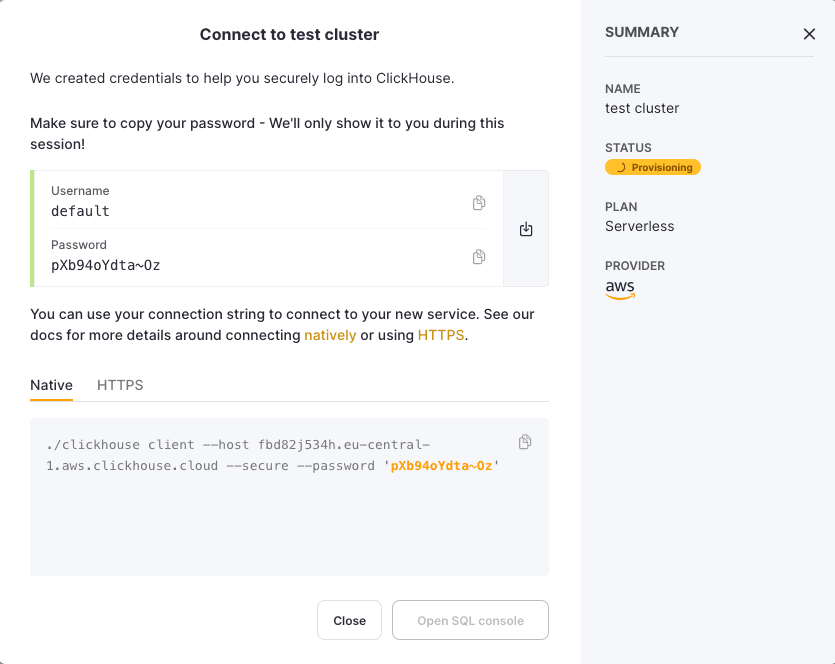
If using ClickHouse Cloud, note the password and host on cluster creation and use the secure port 9440.
create foreign table people (
  <schema>
)
  server clickhouse_server
  options (
	table '<clickhouse_table>'
  );
Before we do this for our HouseClick application, let's establish a few best practices when using the FDW with ClickHouse.
Best practices #
Wherever possible, Supabase users should ensure query push-down occurs when using the ClickHouse FDW. This means that the FDW runs the query on ClickHouse, instead of pulling the dataset into Postgres and aggregating locally. This is essential for performance reasons, as ClickHouse can often perform the query far more efficiently than Postgres - even the transfer of data of hundreds of billions of rows is typically infeasible and would take hours. Push-down is also useful for security reasons, as ClickHouse can enforce access control. While the FDW supports limited push-down support as of the time of writing, users can ensure this occurs by creating parameterized views in ClickHouse and exposing these as foreign tables in Postgres via the wrapper.
Parameterized views are similar to normal views but can be created with parameters that are not resolved immediately but at query time. These views can be used with table functions, which specify the name of the view as the function name and the parameter values as its arguments. The primary concept here is to encapsulate the complexity of a query (and a specific visualization) within a view ClickHouse side and ensure any large complex processing is done at the source, thus guaranteeing push down.
Suppose we have the following query, which computes the ratio of freehold to leasehold properties for a specific postcode (in this case, SL4). For non-UK readers, leasehold and freehold are simply different ownership types distinguished by ownership of the underlying land.
SELECT
	duration AS name,
	count() AS value
FROM default.uk_price_paid
WHERE postcode1 = 'SL4'
GROUP BY duration

┌─name──────┬─value─┐
│ leasehold │  6469 │
│ freehold  │ 15683 │
└───────────┴───────┘

2 rows in set. Elapsed: 0.114 sec. Processed 28.11 million rows, 75.52 MB (247.22 million rows/s., 664.11 MB/s.)
We use this specific query to drive a pie chart visual.
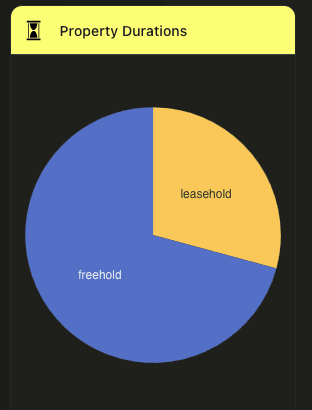
Given that our interface supports filtering by postcode, town, and district, we need a way to pass these to our view and underlying query so that only one value is ever passed. We do this by constructing an OR clause. When matching on a value, e.g., postcode, we pass invalid non-matching values for the other columns. Below we create the parameterized view sold_by_duration and illustrate using the view to obtain the same result as above.
CREATE VIEW sold_by_duration AS
SELECT
	duration AS name,
	count() AS value
FROM default.uk_price_paid
WHERE (postcode1 = {_postcode:String}) OR (district = {_district:String}) OR (town = {_town:String})
GROUP BY duration


SELECT *
FROM sold_by_duration(_postcode = 'SL4', _district = 'X', _town = 'X')

┌─name──────┬─value─┐
│ leasehold │  6469 │
│ freehold  │ 15683 │
└───────────┴───────┘

2 rows in set. Elapsed: 0.230 sec. Processed 28.11 million rows, 201.23 MB (122.00 million rows/s., 873.21 MB/s.)
Note that we incur a performance penalty here as the town and district fields have to be also matched. Future improvements may allow us to use these views more succinctly and efficiently.
Connecting this view to a foreign table in Supabase requires some DDL commands to Postgres. Below we create a foreign table, sold_by_duration, that queries a view of the same name in ClickHouse, using the connection created previously. Note how the table allows the parameters postcode, district, and town to be specified.
create foreign table sold_by_duration (
  name text,
  value bigint,
  postcode text, -- parameter column, used for input parameter,
  district text,
  town text
)
server clickhouse_server
  options (
	table '(select * from sold_by_duration(_postcode=${postcode1}, _district=${district}, _town=${town}))',
	rowid_column 'name'
);
From Postgres, we can now query this table using the psql client, applying the filters using a standard WHERE clause.
postgres=> select name, value from sold_by_duration where postcode1='SL4' AND district='X' AND town='X';
   name	| value
-----------+-------
 leasehold |  6469
 freehold  | 15683
(2 rows)
Using the FDW #
Utilizing a foreign table from the Supabase client is no different than using any other table, allowing us to query ClickHouse transparently. Prior to creating the foreign table, our piechart was powered by the following function using the Clickhouse JS client. Here condition is simply the filter being applied, e.g., postcode1=SL4.
async function soldByDuration(condition) {
   const results = await clickhouse.query({
       query: `SELECT duration as name,count() as value FROM uk_price_paid WHERE ${condition} GROUP BY duration`,
       format: 'JSONEachRow',
   })
   return await results.json()
}
With the foreign table created, we can import and configure the Supabase JS client with the anonymous public token. Our soldbyDuration function is replaced with a Supabase implementation - not the absence of any SQL.
import { createClient } from '@supabase/supabase-js'

const supabase = createClient('https://sfzygnnbtbttbtpiczck.supabase.co', '<anon key>')

const filter_config = {
   'postcode': {
       column: 'postcode1'
   },
   'town': {
       column: 'town'
   },
   'district': {
       column: 'district'
   },
}

async function soldByDuration_fdw(filters) {
   const default_value = 'X'
   let query = supabase.from('sold_by_duration').select('name, value')
   for (let k in filter_config) {
       let filter = filters.filter(f => f.column == filter_config[k].column)
       query = filter.length > 0 ? query.eq(filter[0].column, filter[0].value): query.eq(filter_config[k].column, default_value)
   }
   const { error, data } = await query
   return data
}
Our results are returned in the same format, so our changes are minimal. The filter_config object simply provides a mapping between our filter names and columns.
Pushing data to ClickHouse #
Suppose that HouseClick sells a property. One of the benefits of using Postgres, our application data, is the ability to update rows transactionally. A property can be marked as sold with a simple update:
UPDATE uk_house_listings
SET sold = True,
   sold_date = '2023-05-01'
WHERE id = '99';
Here we mark the property with id 99 as sold on the 1st of May.
With properties selling, we may wish to update our historical analytical data in ClickHouse periodically. We can achieve this in a number of ways:
- The FDW for ClickHouse is bi-directional. We can push rows to ClickHouse with a simple
insert into selectstatement. We could use thesold_dateto identify recently sold properties. This query could then be periodically scheduled using pg_cron to ensure our analytical data is kept current. Note this would require our ClickHouse table to have an identifying id column since the FDW requires arowid_columnin order for updates to be supported. - Using the postgresql table function in ClickHouse, we can pull rows from the Supabase instance. Below we utilize this to pull sold properties with a sold_date greater than or equal to the 1st of May, inserting these into our
uk_price_paidtable. This approach would require us to schedule our import periodically, e.g., using a cron job.
INSERT INTO uk_price_paid SELECT
   price,
   sold_date AS date,
   postcode1,
   postcode2,
   type,
   is_new,
   duration,
   addr1,
   addr2,
   street,
   locality,
   town,
   district,
   county
FROM postgresql('db.sfzygnnbtbttbtpiczck.supabase.co', 'postgres', 'uk_house_listings', 'migration', 'clickhouse')
WHERE (sold = true) AND (sold_date >= '2023-05-01')
This completes our architecture by introducing bi-directionality in the data flow between ClickHouse and Supabase.
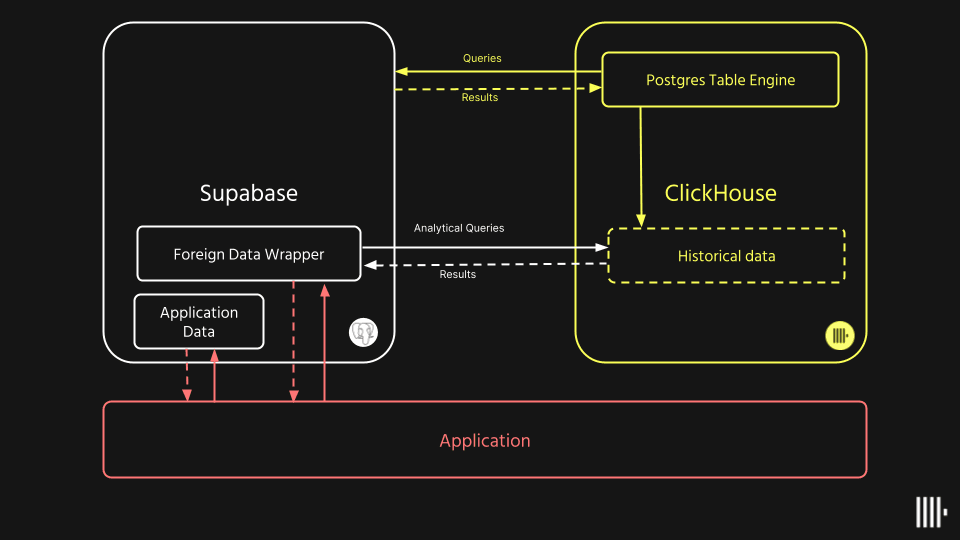
For further details on the postgresql table function see our recent blog series.
Conclusion & Next Steps #
In this blog post, we've explored the difference between an OLTP and OLAP database, specifically Postgres and ClickHouse, and how the former can be used to power an application's state and transactional functionality. In contrast, the latter can be used to provide real-time analytics. In addition to showing how this might be exposed by querying ClickHouse directly, we've utilized Supabase's Foreign Data Wrapper functionality to expose ClickHouse-powered analytics through a single familiar interface before touching on how users might update their analytics data using subsets of transactional rows.


