We're excited to announce the release of our new ClickHouse Cloud Prometheus/Grafana mix-in, designed to make monitoring your ClickHouse Cloud services as easy as possible. This mix-in leverages our existing Prometheus-compatible API endpoint to scrape ClickHouse metrics into your existing Prometheus and Grafana setup, providing real-time visibility into your services' health and performance with a pre-configured dashboard. This mix-in is nearly identical to our own internal dashboards used by our engineering teams to monitor every instance deployed in our cloud.
Why we’re releasing this #
Monitoring is crucial for maintaining the health and performance of your ClickHouse deployment. The monitoring pages in our Cloud Console provide a lot of useful information, but many of our customers maintain sophisticated stacks comprising dozens (or hundreds) of discrete services. Rather than using different tooling to monitor each component, solutions like Prometheus and Grafana provide an easy way to collect and view metrics from the entire stack in a single centralized location.
Scraping ClickHouse Cloud metrics into Prometheus has always been supported to varying extents. ClickHouse offers a Prometheus-friendly output format and the system tables containing metrics can be queried directly via HTTP. However, this method is—frankly speaking—not very ergonomic. Each ClickHouse instance must be scraped independently and specifically for ClickHouse Cloud, the scraper is agnostic of service state, meaning scrapes will fail when a service is stopped and can prevent it from idling. To solve for these problems, we introduced a Prometheus endpoint in our cloud API that (1) federates metrics emitted from all services in your ClickHouse Cloud organization; and (2) gracefully handles state-related corner cases.
The Prometheus API endpoint was an instant success—it is already used by our customers to monitor thousands of ClickHouse Cloud services in Production. Making these metrics more accessible very quickly uncovered another problem: ClickHouse emits more than a thousand metrics, and we witnessed many users struggling to figure out which ones are actually important to monitor. Scraping thousands of metrics from each replica in each ClickHouse Cloud service is (for most people) both silly and costly. For example, metrics like ClickHouseProfileEvents_RegexpWithMultipleNeedlesGlobalCacheHit are mostly irrelevant for day-to-day monitoring. We initially solved this by adding an optional filtered_metrics parameter to the Prometheus endpoint that pared down the 1000+ available metrics to a more manageable 125 ‘mission critical’ metrics. These metrics are what we primarily use internally, via Grafana, for monitoring and debugging internal and customer instances in ClickHouse Cloud.
All of this, then, begs the question: why not release our internal Grafana dashboard configuration as a publicly-available template? So here we are.
Getting Started: Setting Up the Mix-in #
(Note: this section assumes you are already running both Prometheus and Grafana)
Setting up Prometheus #
- Update your Prometheus config (
prometheus.yml)
Add the following scrape config. This configuration enables Prometheus to scrape metrics from all services in your organization. Remember to replace<Organization ID>,<API Key ID>, and<API Key Secret>with your actual credentials.honor_labels: trueensures that the labels provided by ClickHouse Cloud are retained, which is essential for our dashboards.
scrape_configs:
  - job_name: "My ClickHouse Org"
    static_configs:
      - targets: ["api.clickhouse.cloud"]
    scheme: https
    metrics_path: "/v1/organizations/<Organization ID>/prometheus"
    params:
      filtered_metrics: ["true"]
    basic_auth:
      username: <API Key ID>
      password: <API Key Secret>
    honor_labels: true
-
Restart your Prometheus instance
After updating the configuration, restart Prometheus to apply the changes. -
Verify Prometheus is working
If everything is configured correctly, you should start seeing ClickHouse Cloud metrics being scraped by Prometheus. You can check this by navigating to Prometheus's web interface and viewing the ‘targets’ page. You should see something like: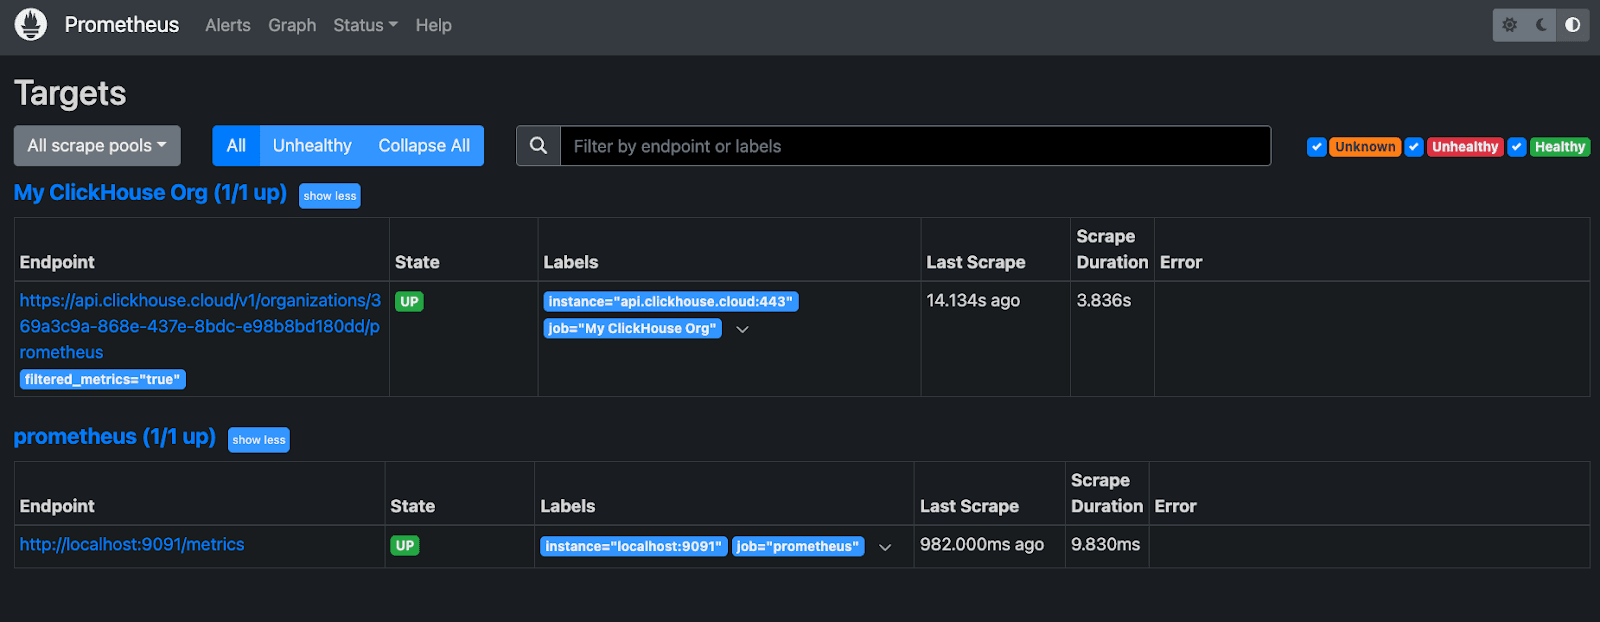
Setting up Grafana & Importing the Mix-in #
-
Add the Prometheus data source to Grafana (if you haven’t already)
Navigate to "Data sources" in the Grafana menu and add a new "Prometheus" data source. Input your Prometheus host and credentials: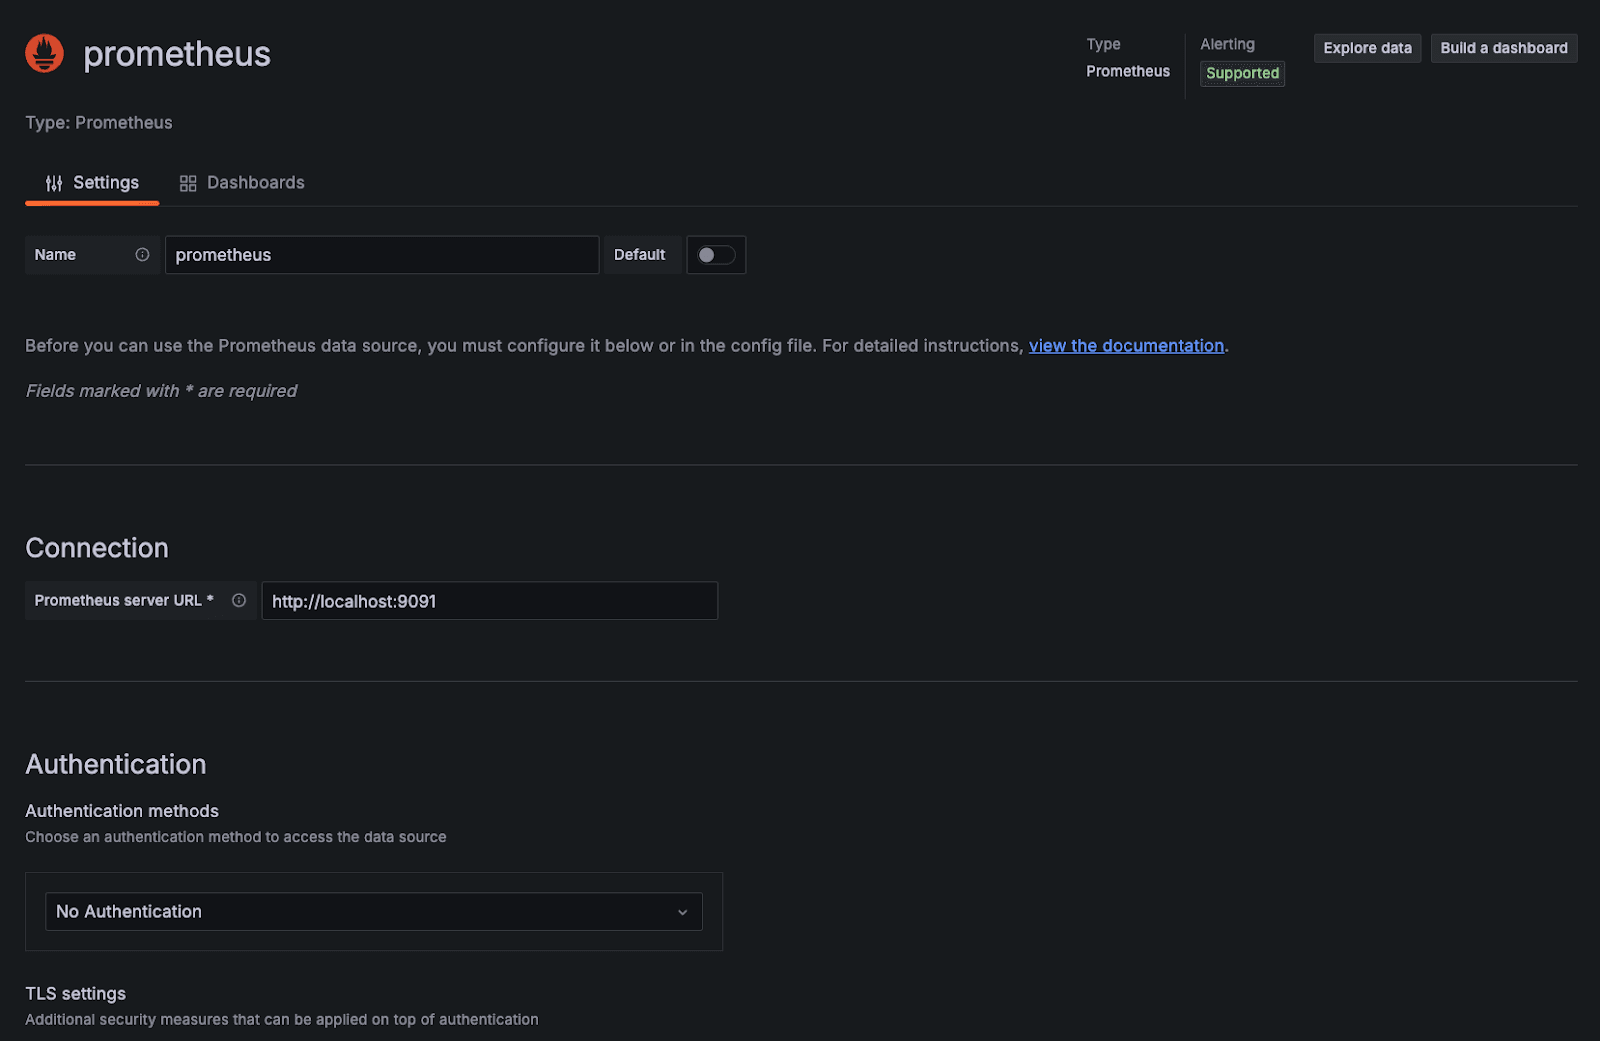
-
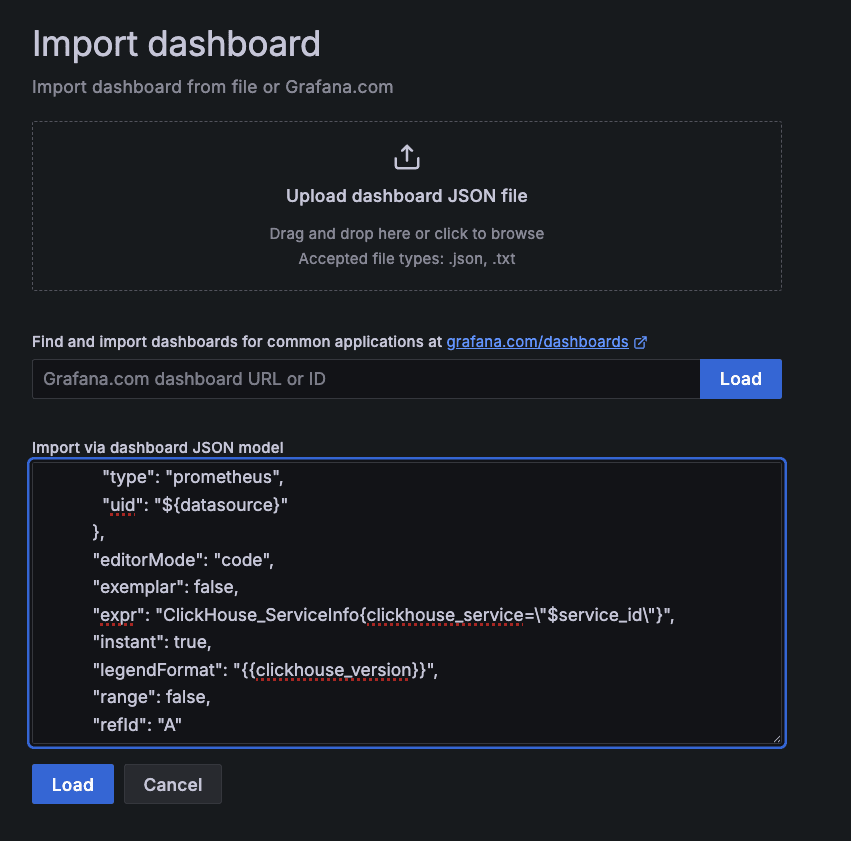
Import the dashboard
From the dashboard creation screen, select "Import a dashboard." Paste the following URL into the input: https://grafana.com/grafana/dashboards/23415-prom-exporter-instance-dashboard-v2/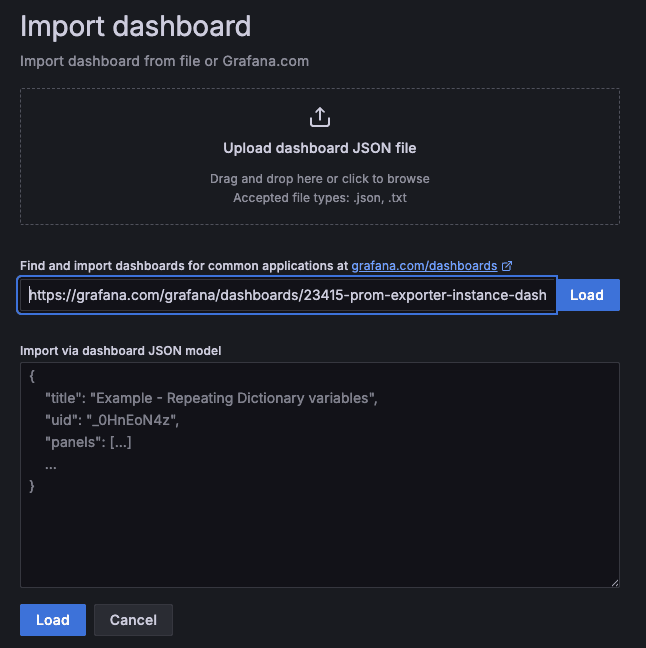
Alternatively, you can paste the JSON content directly from our mix-in repository:
https://github.com/ClickHouse/clickhouse-mixin/blob/main/dashboard.json
-
View your metrics
If everything works correctly, you should immediately see metrics for your ClickHouse Cloud services in the imported dashboard.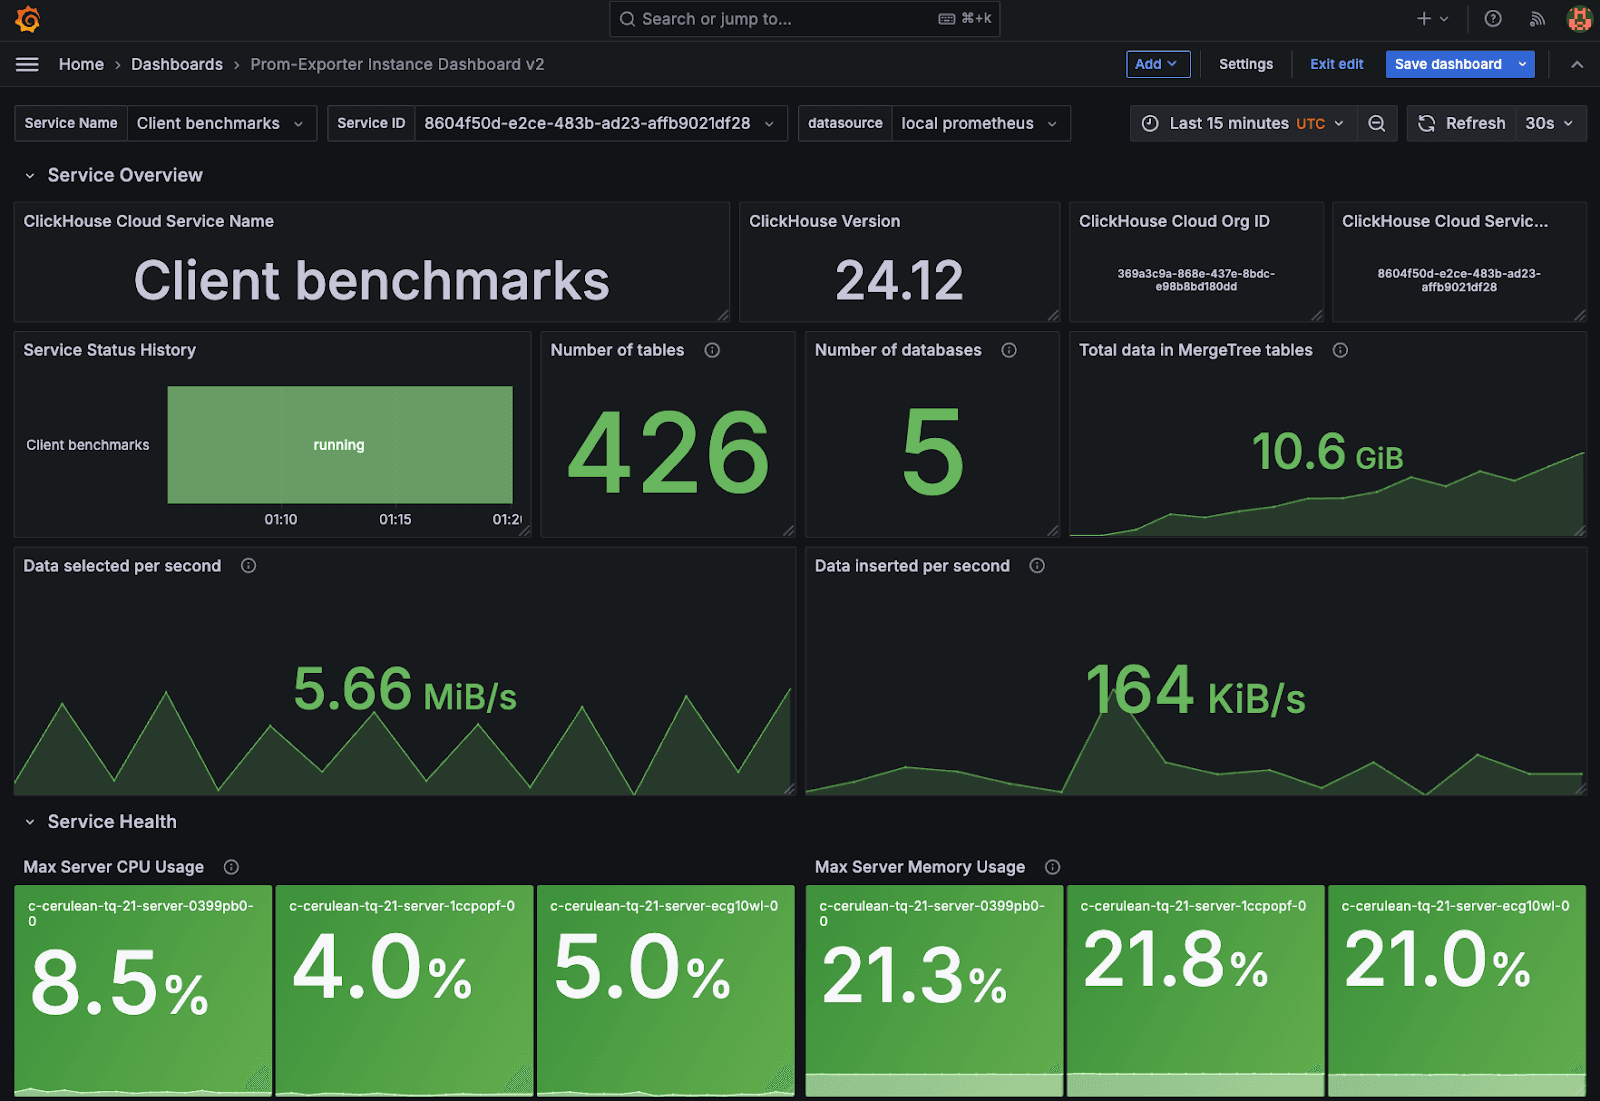
Conclusion #
This mix-in should help you monitor your ClickHouse Cloud services exactly like we do. As always, we appreciate your feedback—please drop us a line if you have any requests or suggestions around improving our observability experience!


