Get started with ClickHouse Cloud today and receive $300 in credits. To learn more about our volume-based discounts, contact us or visit our pricing page.
Introduction #
Have you ever wondered what it takes to build a serverless software as a service (SaaS) offering in under a year? In this blog post, we will describe how we built ClickHouse Cloud – a managed service on top of one of the most popular online analytical processing (OLAP) databases in the world – from the ground up. We delve into our planning process, design and architecture decisions, security and compliance considerations, how we achieved global scalability and reliability in the cloud, and some of the lessons we learned along the way.
An Update and Interview #
Given the popularity of this post, we decided to take the chance to answer a few of the questions that have come up on video.
Timeline and Milestones #
Our timeline and planning process may come across as a bit unconventional. ClickHouse has been a very popular open source project since 2016, so when we started the company in 2021, there was significant pent up demand for what we were building. So we set an aggressive goal of building this cloud offering in a series of aggressive sprints over the course of a year.
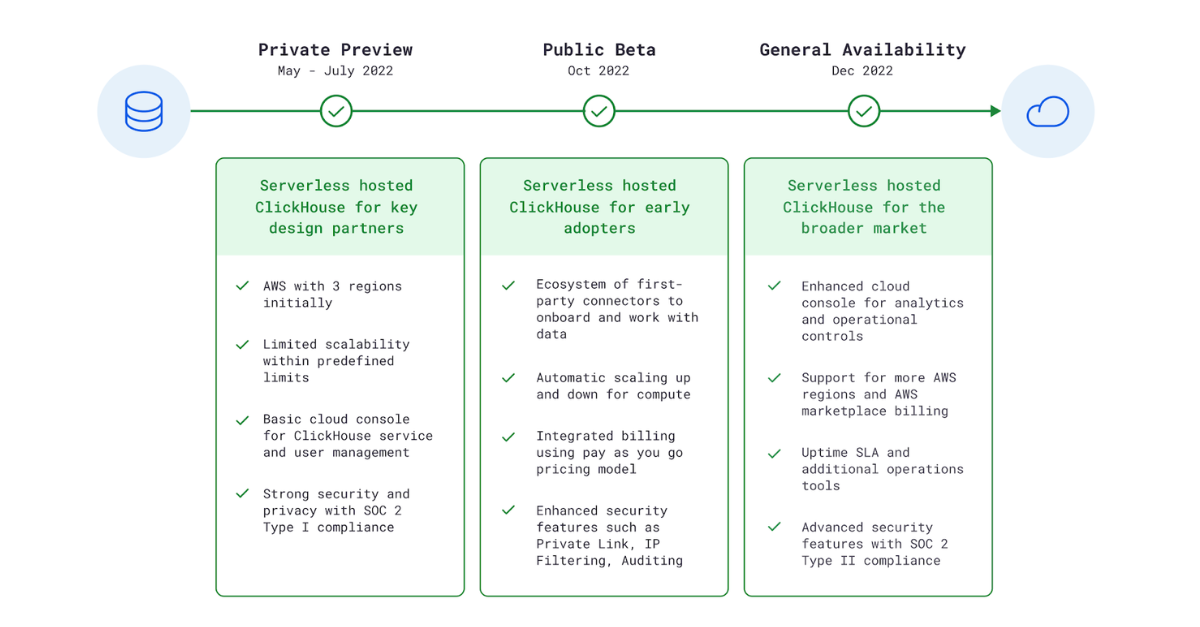
We decided on milestones in advance – Private Preview in May, Public Beta in October, General Availability in December – and then asked ourselves what was feasible by each of these dates and what resources we would need to get there. We had to be very judicious about what to prioritize for each milestone, and what types of projects to start in parallel. Our prioritization was driven by our collective experience of building cloud offerings, analysis of the market, and conversations with early cloud prospects about their pain points.
We invariably planned to do too much in each milestone, and then iteratively re-assessed where we got to and adjusted targets and scope as needed. Sometimes we were surprised by how quickly we were able to make progress (e.g. a fully-functioning Control Plane MVP was built in just a few weeks), and other times, things that seemed simple on paper took a lot longer (e.g. backups are tricky at huge data volumes). We had a strict stack rank of features for each release, and clearly marked blockers vs highly desired and nice-to-have features. When we had to cut features, we were able to drop what was at the bottom without regrets.
We did not want to build in a silo, so we invited ClickHouse users interested in our offering to join us early to try out the platform. We ran an extensive Private Preview program from May to July, where we invited over 50 prospective customers and partners to use our service. We did not charge for this use, as our goal was to learn from seeing real-world workloads, get feedback, and grow with our users.
However, from the start, we put simplicity of use first. We focused on making the onboarding process as frictionless as possible - system-generated invites, self-service onboarding, and automated support workflows. At the same time, we made sure we had a direct Slack channel available for each private preview user, so we could hear the voice of the customer directly and address any concerns efficiently.
Architecture of ClickHouse Cloud #
Our goal was to build a cloud offering that any developer or engineer could start using without deep knowledge of analytical databases and without the need to explicitly size and manage infrastructure.
We settled on a “shared everything” architecture with “separated storage and compute”. Essentially this means that storage and compute are de-coupled and can be scaled separately. We use object storage (such as Amazon S3) as the primary store for the analytical data, and local disks only for caching, metadata, and temporary storage.
The diagram below represents the logical “shared everything” architecture of ClickHouse Cloud.
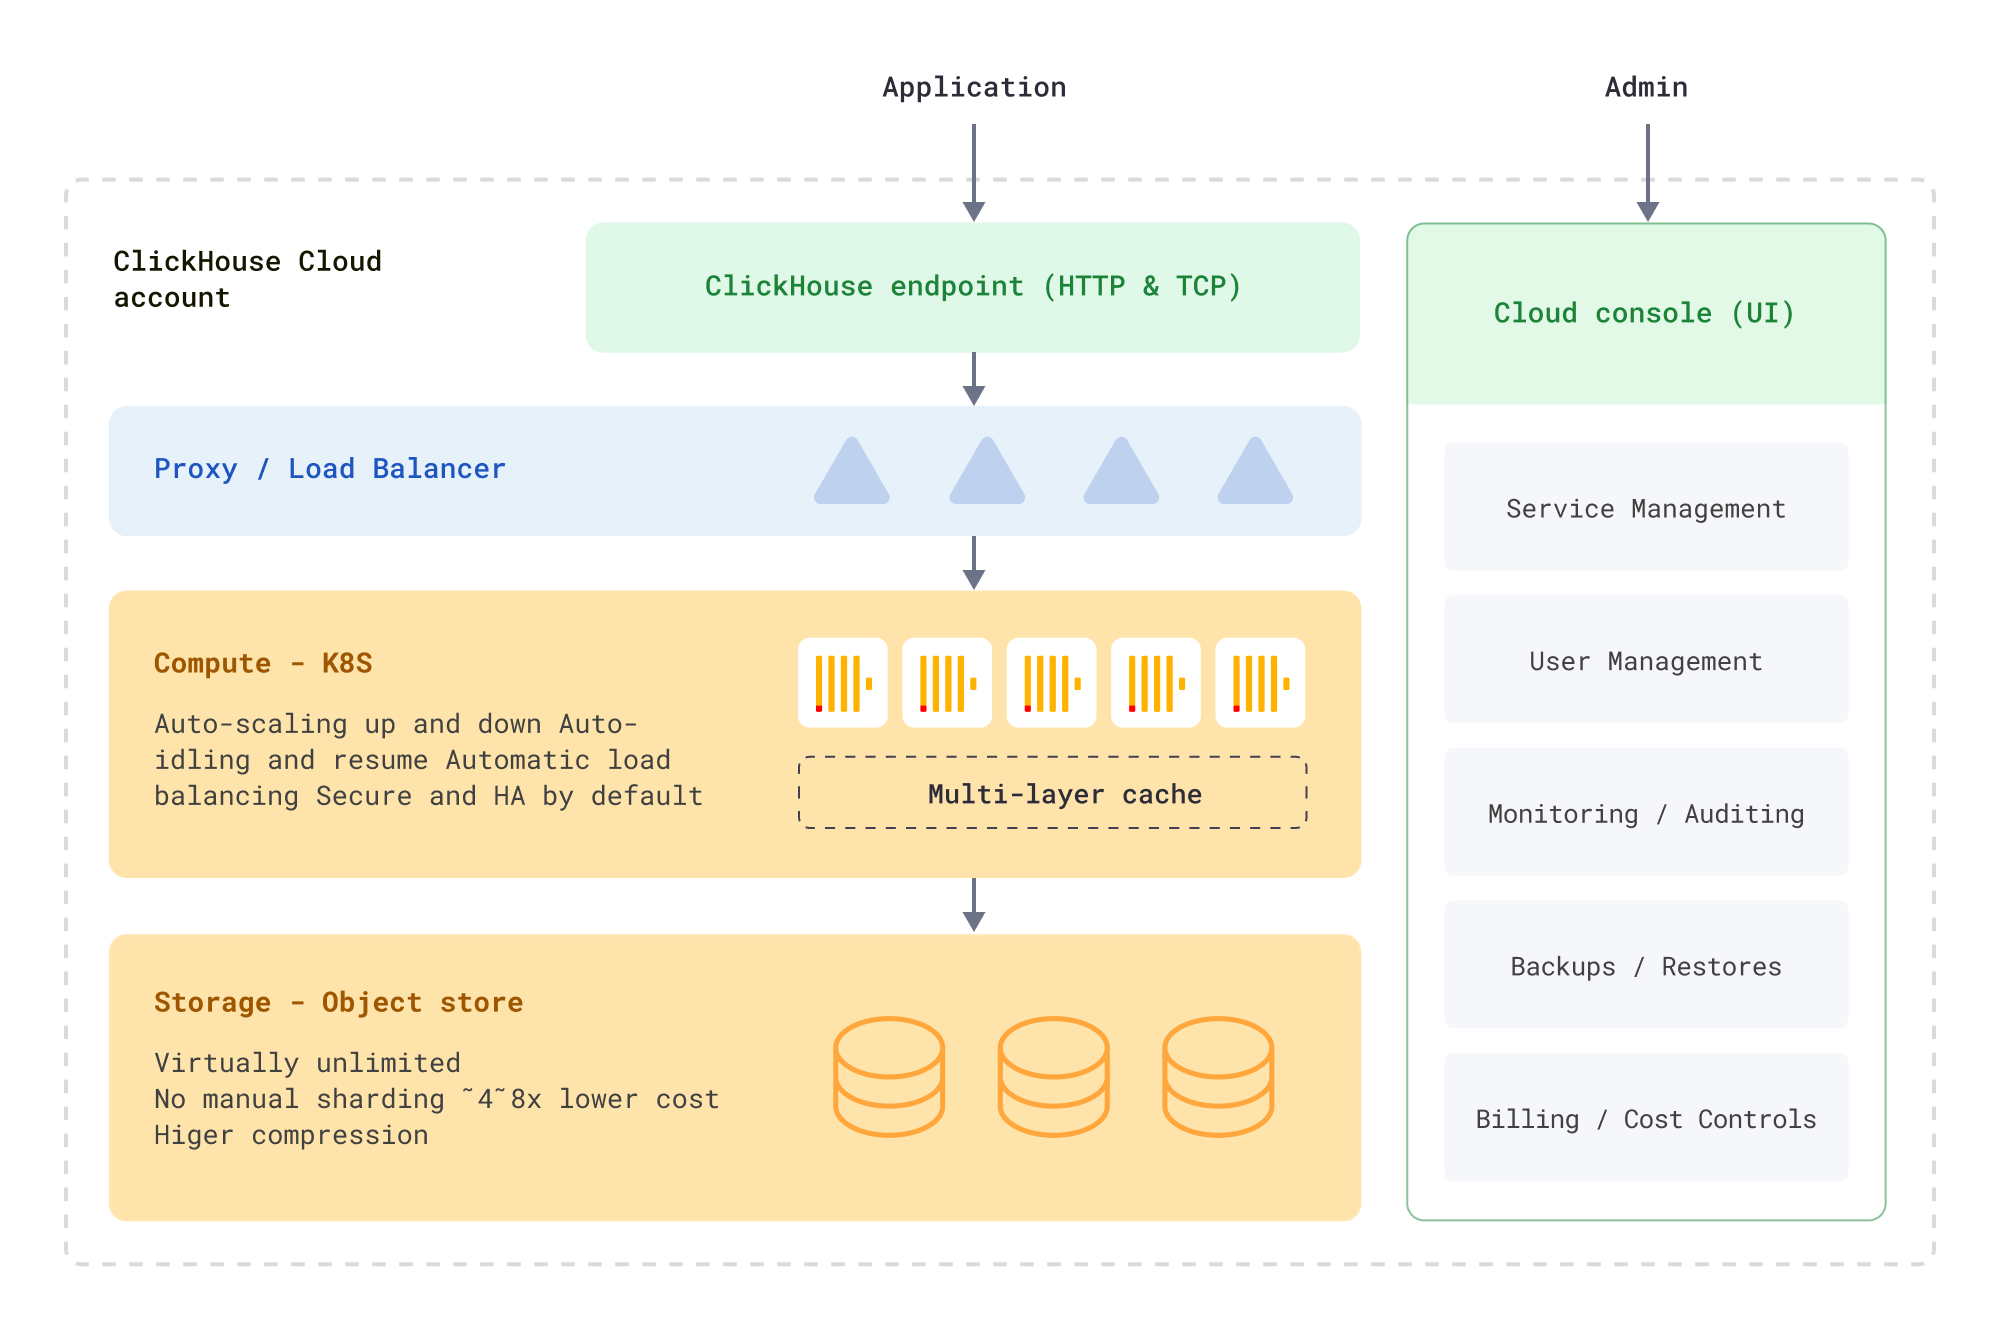
Our reasons for picking this architecture were:
- It greatly simplified data management: no need to size your cluster / storage upfront, no need to physically shard data, no need to rebalance data across nodes as our deployment scales up or down, no compute resources sit idle due to fixed compute / storage ratios present in “shared nothing” architectures.
- We also found based on our benchmarking and experience running real-world workloads that this architecture delivers the most competitive price/performance for the types of analytical workloads we see.
Additional work resulting from taking this path included:
- Object storage latency is slower than local disks, so we had to invest in smart caching, parallel access, and prefetching on top of object store to ensure analytical queries remain fast.
- Object storage access (especially for writes) is pricey, so we had to look closely at how many files we write, how often, and how to optimize that cost. Turns out these efforts have also helped us improve overall reliability and performance.
ClickHouse Cloud Components #
ClickHouse Cloud can be seen as two different independent logical units:
- Control Plane - The “user-facing” layer: The UI and API that enables users to run their operations on the cloud, grants access to their ClickHouse services, and enables them to interact with the data.
- Data Plane - The “infrastructure-facing” part: The functionality for managing and orchestrating physical ClickHouse clusters, including resource allocation, provisioning, updates, scaling, load balancing, isolating services from different tenants, backup and recovery, observability, metering (collecting usage data).
The following diagram shows ClickHouse cloud components and their interactions.
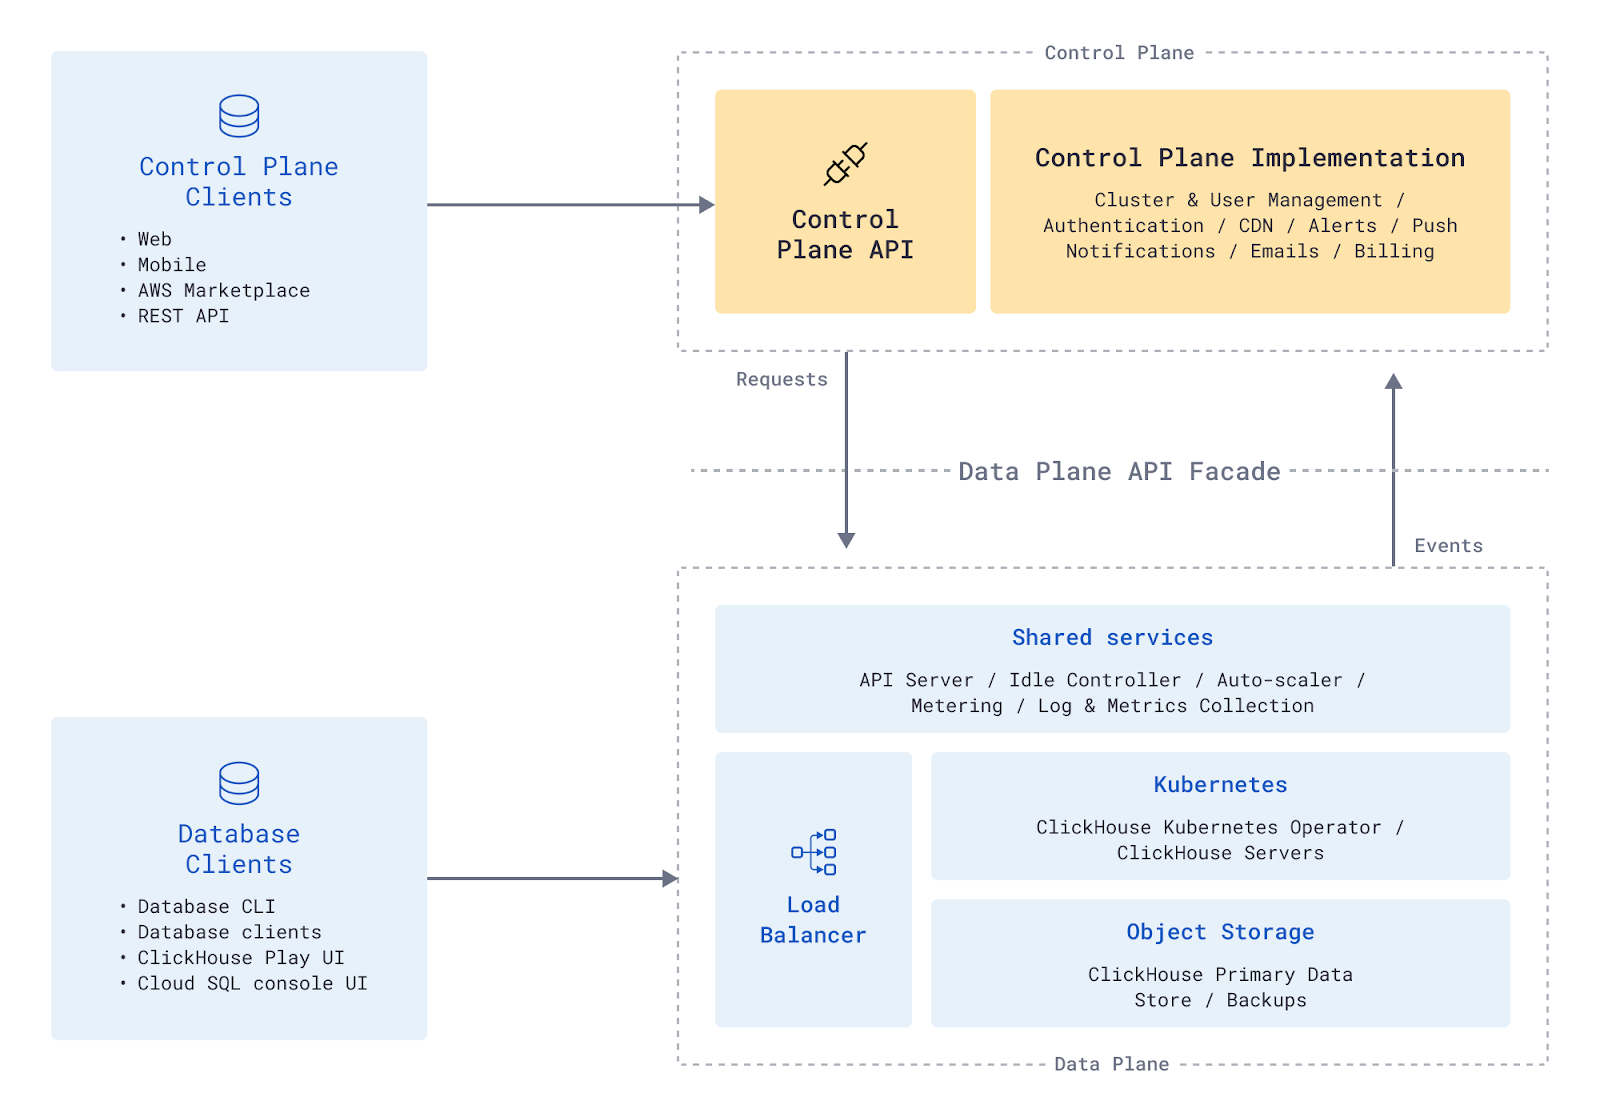
A bi-directional API layer between the Control Plane and the Data Plane defines the only integration point between the two planes. We decided to go with a REST API for the following reasons:
- REST APIs are independent of technology used, which helps avoid any dependency between Control Plane and Data Plane. We were able to change the language from Python to Golang in the Data Plane without any changes or impact to the Control Plane.
- They offer a lot of flexibility, decoupling various server components which can evolve independently.
- They can scale efficiently due to the stateless nature of the requests - the server completes every client request independently of previous requests.
When a client performs an action that requires an interaction with the Data Plane (such as creating a new cluster or getting the current cluster status), a call from the Control Plane is made to the Data Plane API. Events that need to be communicated from the Data Plane to the Control Plane (e.g. cluster provisioned, monitoring data events, system alerts) are transmitted using a message broker (e.g. SQS queue in AWS and Google Pub/Sub in GCP).
The concrete implementation of this API resides in different components inside the Data Plane. This is transparent to the consumer, and therefore we have a “Data Plane API Façade”. Some of the tasks done by the Data Plane API are:
- Start / Stop / Pause ClickHouse service
- Change ClickHouse service configuration
- Exposed endpoints (e.g. HTTP, GRPC)
- Endpoint configuration (e.g. FQDN)
- Endpoint security (e.g. private endpoints, IP filtering)
- Set up main customer database account and reset the password
- Get information about ClickHouse service
- Information about endpoints (e.g. FQDNs, ports)
- Information about VPC pairing
- Get status information about the ClickHouse service
- Provisioning, Ready, Running, Paused, Degraded
- Subscribe to events for status updates
- Backups & restores
Multi-Cloud #
Our Control Plane runs in AWS, but the goal is to have the Data Plane deployed across all major cloud providers, including Google Cloud and Microsoft Azure. Data Plane encapsulates and abstracts cloud service provider (CSP) specific logic, so that Control Plane does not need to worry about these details.
We started our production buildout and went to GA initially on AWS, but commenced proof-of-concept work on the Google Cloud Platform (GCP) in parallel, to make sure that major CSP-specific challenges are flagged early. As expected, we needed to find alternatives to AWS-specific components, but generally that work has been incremental. Our main concern was how much work separation of compute and storage on top of S3 would take to port to another cloud provider. To our relief, in GCP, we greatly benefited from S3 API compatibility on top of Google Cloud Storage (GCS). Our object store support on S3 mostly “just worked”, aside from a few differences with authentication.
Design Decisions #
In this section, we will review some of the design decisions and the reasons for our choices.
Kubernetes vs Direct VMs #
We decided to choose Kubernetes for compute infrastructure early on due to built-in functionality for scaling, re-scheduling (e.g., in case of crashes), monitoring (liveness/readiness probes), built-in service discovery, and easy integration with load balancers. An Operator pattern allows building automation for any events happening in the cluster. Upgrades are easier (both application and node/OS upgrades) and 100% cloud agnostic.
kOps vs Managed Kubernetes #
We use managed Kubernetes services – EKS in AWS (and similar services in other cloud providers), because it takes away the management burden for the cluster itself. We considered kOps, a popular open source alternative for production-ready Kubernetes clusters, but determined that with a small team a fully-managed Kubernetes service would help us get to market faster.
Network Isolation #
We use Cilium because it uses eBPF and provides high throughput, lower latency, and less resource consumption, especially when the number of services is large. It also works well across all three major cloud providers, including Google GKE and Azure AKS, which was a critical factor in our choice. We considered Calico, but it is based on iptables instead of eBPF, and did not meet our performance requirements. There is a detailed blog post from Cilium that goes into some technical details and benchmarks that helped us understand the nuances and trade-offs.
Data Plane API Server on Lambdas vs Kubernetes #
When we started off ClickHouse Cloud, we built a Data Plane API layer using AWS Lambda since it offered fast development time. We used the serverless.com framework for those components. As we started preparing for the Beta and GA launch, it became clear that migrating to Golang apps running in Kubernetes would help reduce our code deployment time and streamline our deployment infrastructure using ArgoCD and Kubernetes.
Load Balancer - AWS NLB vs Istio #
For Private Preview, we were using one AWS Network Load Balancer (NLB) per service. Due to the limitation of the number of NLBs per AWS account, we decided to use Istio and Envoy for the shared ingress proxy. Envoy is a general-purpose L4/L7 proxy and can be easily extended to provide rich features for specialized protocols, such as MySQL and Postgres. Istio is the most popular Envoy Control Plane implementation. Both projects have been open-source for more than five years. They have become pretty mature and well-adopted in the industry over time.
Istio Proxy uses a server name indicator (SNI) to route traffic to different services. Public certificates are provisioned via cert-manager and Let’s Encrypt, and using separate Kubernetes clusters to run Proxy ensures that we can scale the cluster to accommodate increased traffic and reduce security concerns.
Message Broker for Async Communication #
We use SQS for both communications inside the Data Plane and for communication between Control Plane and Data Plane. Though it is not cloud-agnostic, it's simple to set up, simple to configure, and inexpensive. Going with SQS reduced our time to market and lowered administrative overhead for this part of our architecture. The effort of migrating to another alternative, like Google Pub/Sub, for alternative cloud buildouts is minimal.
Object Store as a Primary Store #
As mentioned previously, we are using object store (e.g. S3 in AWS or GCS in GCP) as a primary data store, and local SSDs for caching and metadata. Object storage is infinitely scalable, durable, and significantly more cost efficient in storing large amounts of data. When organizing the data on object store, we initially went with separate S3 buckets per logical ClickHouse service, but soon started running into AWS limits. Therefore we switched to shared buckets, where services are separated based on a subpath in the bucket and data security is guaranteed by maintaining separate roles/service accounts.
Authentication and Credentials #
We made the decision early on not to store Control Plane or database credentials in our service. We use Amazon Cognito for customer identity and access management (CIAM), and when you set up your Control Plane account, that is where the credentials are persisted. When you spin up a new ClickHouse service, we ask you to download credentials during onboarding, and do not store it beyond the session.
Scalability and Reliability #
Scalability #
We wanted our product to scale seamlessly to handle the increase in user traffic without impacting the performance of the services. Kubernetes allows us to scale up compute resources easily, ensures high availability of applications with automatic failover and self-healing, enables portability, and provides easy integration with other cloud services like storage and network.
Auto-Scaling #
It was an important goal for us to support varying workload patterns via auto-scaling. Since storage and compute are separated, we can add and remove CPU and memory resources based on the utilization of each workload.
Auto-scaling is built using two components: the idler and the scaler. The responsibility of the idler is to suspend pods for services that are not currently serving queries. The scaler is responsible for making sure that the service has enough resources (within bounds) to work efficiently in response to the current mix and rate of queries.
The design of ClickHouse idling is a custom implementation that closely follows the activator pattern from Knative. We are able to do away with some of the components required in Knative because our proxy (Envoy) is tightly integrated with our Kubernetes operators.
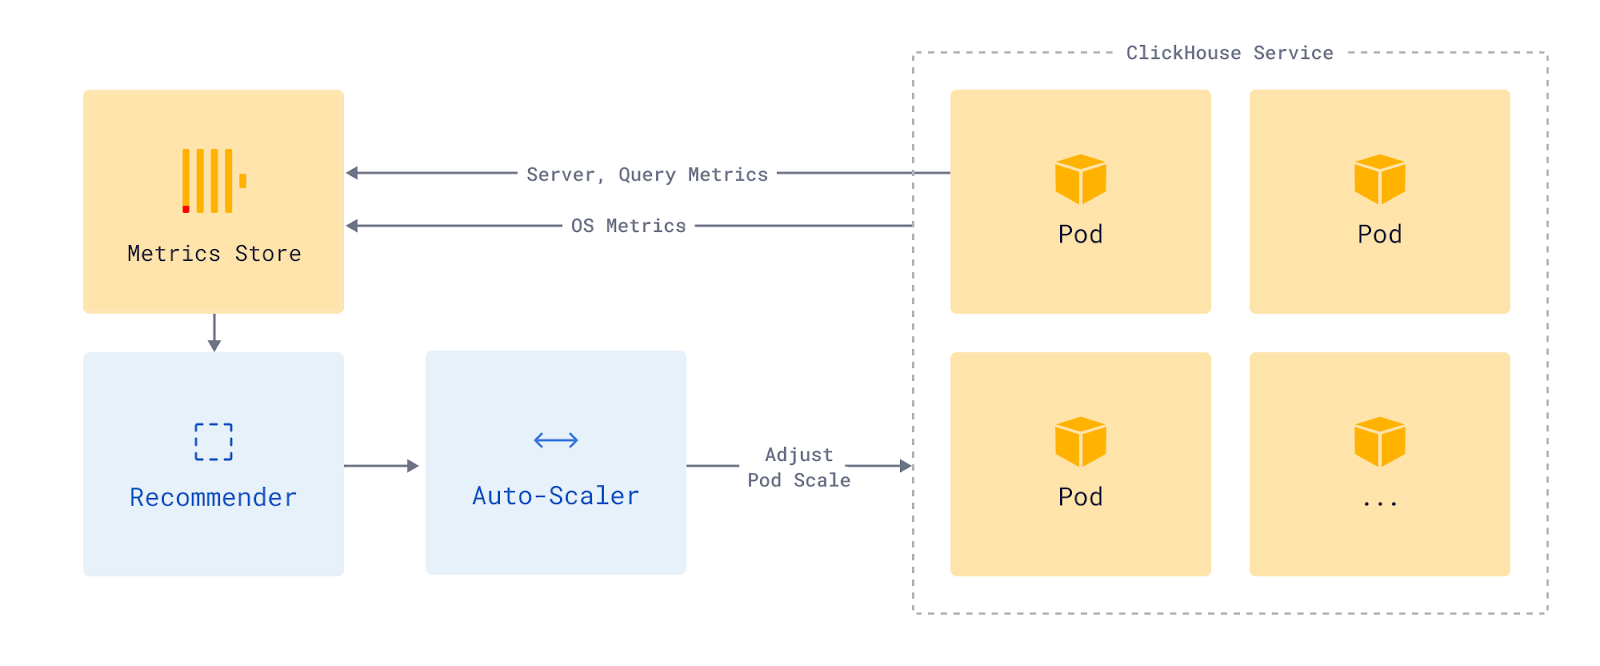
The idler monitors various service parameters to determine the approximate startup time for pods. Based on these parameters, it computes an idling period and de-allocates the compute pods allocated to a service when it is not taking requests for this computed period.
ClickHouse auto scaler is very similar in operation to auto-scaling components in the Kubernetes ecosystem, like vertical and horizontal auto scalers. It differs from these off-the-shelf systems in two main dimensions. First, it is tightly integrated into our cloud ecosystem. So, it is able to use metrics from the operating system, the ClickHouse server, and also some signals from the query usage to determine how much compute should be allocated to a service. Second, it has stronger controls on disruption budgets, required to run a stateful service.
Every 30 minutes, it computes the amount of resources that a service should be allocated based on the historical and current values of these signals. It uses this data to determine whether it should add or shrink resources for the service. The auto scaler determines the optimal time to make changes based on factors like startup time and usage pattern. We are continuing to iterate on making these recommendations faster and better, by incorporating more inputs and making more sophisticated predictions.
Reliability #
Data is crucial to businesses, and in this day and age, no one can tolerate downtime when it comes to infrastructure services. We knew early on that ClickHouse Cloud needed to be highly available with a built-in ability to recover quickly from internal component failures and ensure they do not affect overall availability of the system. The cluster topology is configured such that the pods are distributed on 3 availability zones (AZs) for production services and 2 AZs for development services so that the cluster can recover from zone failures. We also support multiple regions so that outages in one region do not impact the services in other regions.
To avoid running into resource limitations in one cloud account, we embraced cellular architecture for our Data Plane. “Cells” are independent, autonomous units that function independently of each other, providing a high degree of fault tolerance and resiliency for the overall service. This helps us spin up additional Data Plane cells as needed to cater to increased traffic and demand, providing isolation of different services if necessary.
Performance Benchmarking #
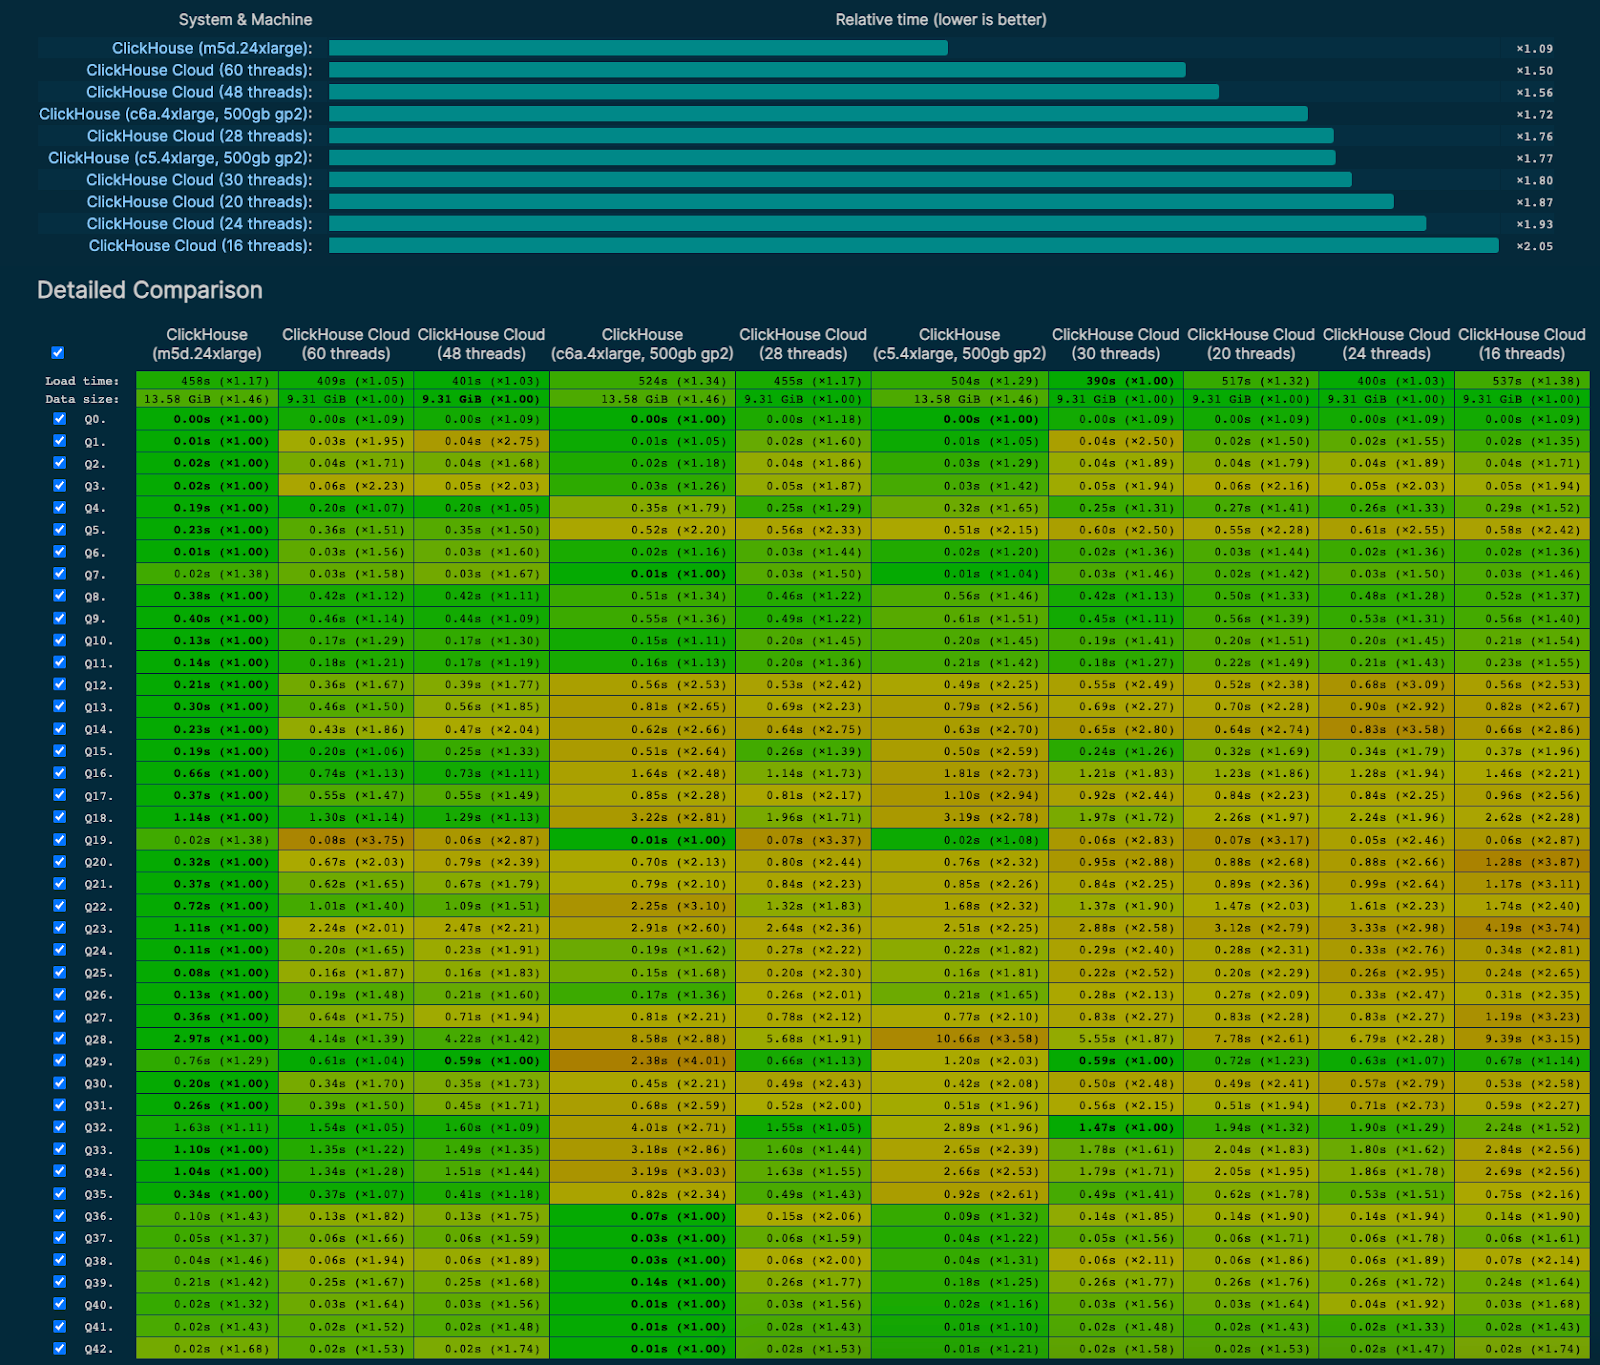
As we were building our cloud offering, the core team open-sourced the analytical benchmark we were using internally. We embraced this benchmark as one of the key performance tests to run across our cloud environments and versions to better understand how the database performs in various configurations, cloud provider environments, and across versions. It was expected that compared to bare metal and local SSD, access to object storage would be slower, but we still expected interactive performance and tuned performance via parallelization, prefetching, and other optimizations (see how you can read from object storage 100 times faster with ClickHouse in our meetup talk).
We update our results at every major update and publish them publicly on benchmarks.clickhouse.com. The screenshot below shows ClickHouse cloud service performance versus a few self-managed setups of various sizes in a shared-nothing configuration. The fastest baseline here is ClickHouse server running on an AWS m5d.24xlarge instance that uses 48 threads for query execution. As you can see, an equivalent cloud service with 48 threads performs very well in comparison for a variety of simple and complex queries represented in the benchmark.
Security and Compliance #
It was very important to us to build trust into the product from the start. We take a three-tier approach to protecting the data so entrusted to us.
Built Secure #
We leveraged compliance frameworks such as GDPR, SOC 2, and ISO 27001 and secure configuration standards such as CIS to build each tier of our product. Internet-facing services are protected by web application firewalls. Strong authentication is not only in place for our Control Plane and databases, but also for all of our internal services and systems. When a new service is created, it is deployed with infrastructure as code that ensures configuration standards are consistently applied. This includes several items, from AWS Identity & Access Management (IAM) roles, traffic routing rules, and virtual private network (VPN) configurations, to encryption in transit and at rest and other security configurations. Our internal security experts review each component to ensure the service can operate efficiently and effectively, while being secure and compliant.
Constantly Monitored #
Security and compliance are more than just one-time implementation exercises. We constantly monitor our environments through vulnerability scans, penetration tests, configured security logging, and alerts, and we encourage industry researchers to report any potential issues through our bug bounty program. Additionally, we have continuous compliance monitoring with over 200 separate checks that include our production environments, corporate systems, and vendors as a second line of defense to ensure we are diligent in both our technical and process-oriented programs.
Improved Over Time #
We continuously add new security features based on industry trends or customer requests. ClickHouse database already has many advanced security features built-in, including strong authentication and encryption, flexible user management RBAC policies, and ability to set quotas and resource usage limits. We released our cloud Private Preview with strong authentication on the Control Plane, auto-generated strong passwords for default database accounts, and in-transit and at rest data encryption. In Public Beta, we added IP access lists, AWS Private Link support, federated authentication via Google, and Control Plane activity logging. In GA, we introduced multi-factor authentication for the Control Plane. More security capabilities are coming to support more specialized use cases and industries.
Overall we are using standard security best practices for each cloud provider. We follow the principle of least privilege for all components running in our cloud environments. Production, staging, and development environments are fully isolated from each other. Each region is also fully isolated from all other regions. Access to cloud services like AWS S3, RDS, Route53, and SQS all use IAM roles and IAM policies with strict restrictions.
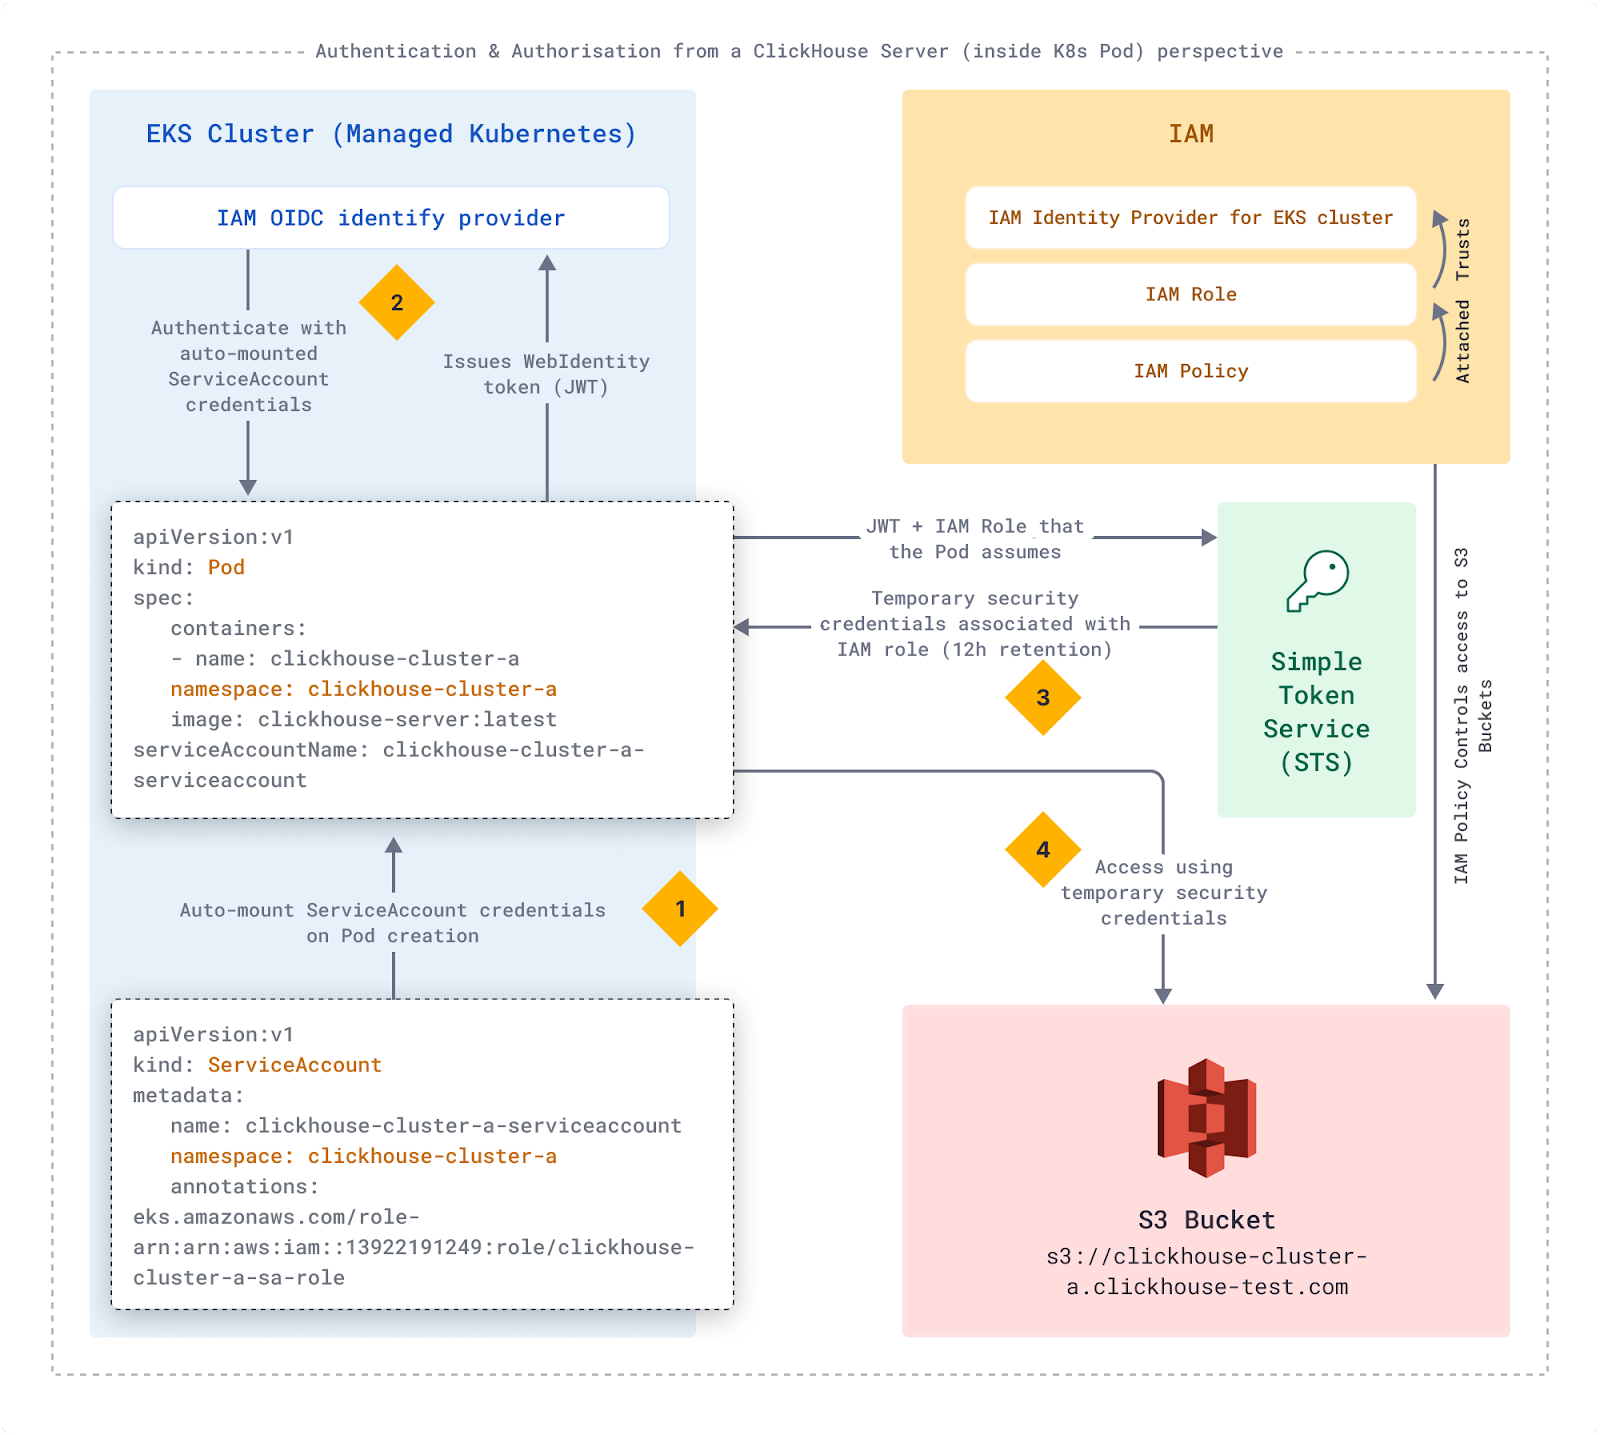
The following diagram shows how we use EKS IAM OIDC identity provider and IAM roles/policies to access S3 buckets that store customer data. Each customer has an isolated Kubernetes namespace with a service account that maps to dedicated IAM roles.
- EKS automatically mounts ServiceAccount credentials on Pod creation
- The pod uses the ServiceAccount credentials against the IAM OIDC provider
- Using the provided JWT and IAM Role, the pod calls Simple Token Service (STS)
- STS provides the pod with temporary security credentials associated with the IAM role
We use this pattern for all components that need access to other services.
Components that process customer data are fully isolated on a network layer from each other. Our cloud management components are fully isolated from customer workloads to reduce security risks.
Pricing and Billing #
It took us approximately six months to settle on our pricing model and subsequently implement our metering and billing pipeline, which we then iterated upon following Beta and GA based on customer feedback.
Usage-Based Pricing Model #
We knew that our users desired a usage-based pricing model to match how they would use a serverless offering. We considered a number of models and ultimately settled on a simple resource-based pricing model based on consumed storage and compute.
We considered pricing on other dimensions, but each model came with caveats that did not work well for our users. For example, pricing on read/write operations is easy to understand, but not practical for an analytical system, where a single query can be very simple (simple aggregation on one column) or very complex (multi-level select with multiple aggregations and joins). Pricing on the amount of data scanned is more appropriate, but we learned from users of other analytical systems that this type of pricing is very punitive and deterred them from using the system - the opposite of what we want! Finally, pricing based on opaque “workload units” was considered, but eventually discarded as too difficult to understand and trust.
Metering and Billing Engine #
We charge based on their compute usage (per minute) and storage (per 15 minutes), so we need to track live usage of these dimensions in order to display real-time usage metrics and monitor them to make sure it doesn’t exceed certain limits.
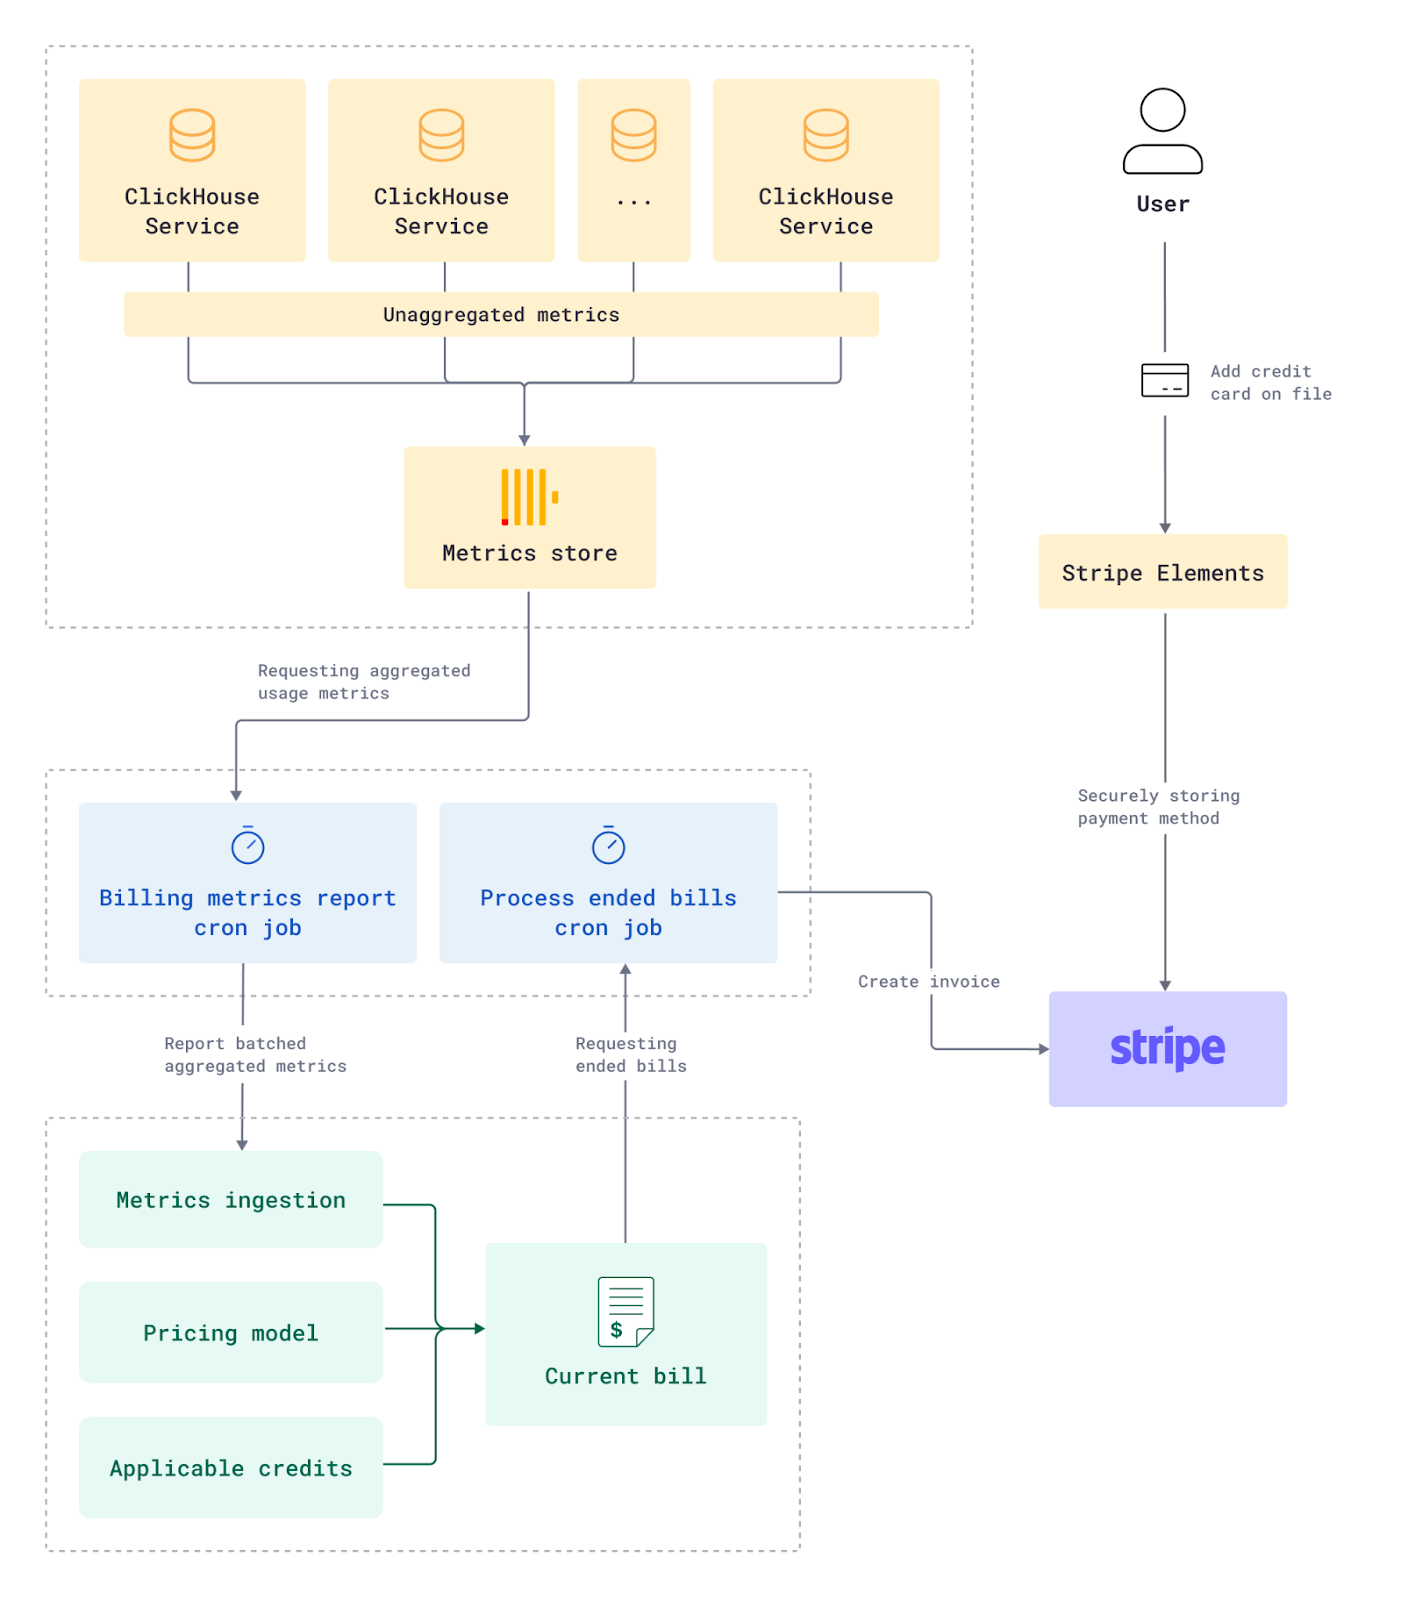
ClickHouse already exposes usage metrics internally within system tables. This data is queried regularly from each customer’s ClickHouse service and published to an internal and central ClickHouse metrics cluster. This cluster is responsible for storing granular usage data for all of our customer’s services, which powers the charts customers see on their service usage page and feeds into the billing system.
The usage data is collected and aggregated periodically from the metrics cluster and transmitted to our metering and billing platform m3ter, where it is converted into billing dimensions. We use a rolling monthly billing period which starts on the creation of the organization. m3ter also has a built-in capability to manage commitments and prepayments for different use cases.
This is how the bill is generated:
- Aggregated usage metrics are added to the current bill and are translated into cost using the pricing model.
- Any credits (trial, prepaid credits, etc.) available to the organization are applied toward the bill amount (depending on the credit’s start/end dates, the amount remaining, etc.).
- The bill’s total is repeatedly calculated to detect important changes such as the depletion of credits and triggering notifications (“Your ClickHouse Cloud trial credits have exceeded 75%”).
- After the end of the billing period, we recalculate once more to make sure we include any remaining usage metrics that were sent after the close date but pertain to the period
- The bill is then closed, and any amount not covered by credit is added to a new invoice on Stripe, where it will be charged to the credit card.
- A new bill is opened to start aggregating the new billing period’s usage and cost.
Administrators can put a credit card on file for pay-as-you-go charging. We use Stripe’s elements UI components to ensure the sensitive card information is securely sent directly to Stripe and tokenized.
AWS Marketplace #
In December 2022, ClickHouse started offering integrated billing through AWS Marketplace. The pricing model in AWS is the same as pay-as-you-go, but Marketplace users are charged for their ClickHouse usage via their AWS account. In order to facilitate the integration with AWS, we use Tackle, which provides a unified API layer for integrating with all major cloud providers, significantly reducing the overall development efforts and time to market when building a multi-cloud infrastructure offering. When a new subscriber registers through AWS, Tackle completes the handshake and redirects them to ClickHouse Cloud. Tackle also provides an API for reporting billings from m3ter to AWS.
UI and Product Analytics #
It is very important for us at ClickHouse to provide the best user interface for our customers. In order to achieve this, we need to understand how our clients use our UI and identify what works well, what is confusing, and what should be improved. One way to get more observability of the client's behavior is using an event logging system. Luckily, we have the best OLAP DB in-house! All web UI clicks and other product usage events are stored in a ClickHouse service running in ClickHouse Cloud, and both engineering and product teams rely on this granular data to assess product quality and analyze usage and adoption. We report a small subset of these events to Segment, which helps our marketing team observe the user journey and conversions across all of our touchpoints.
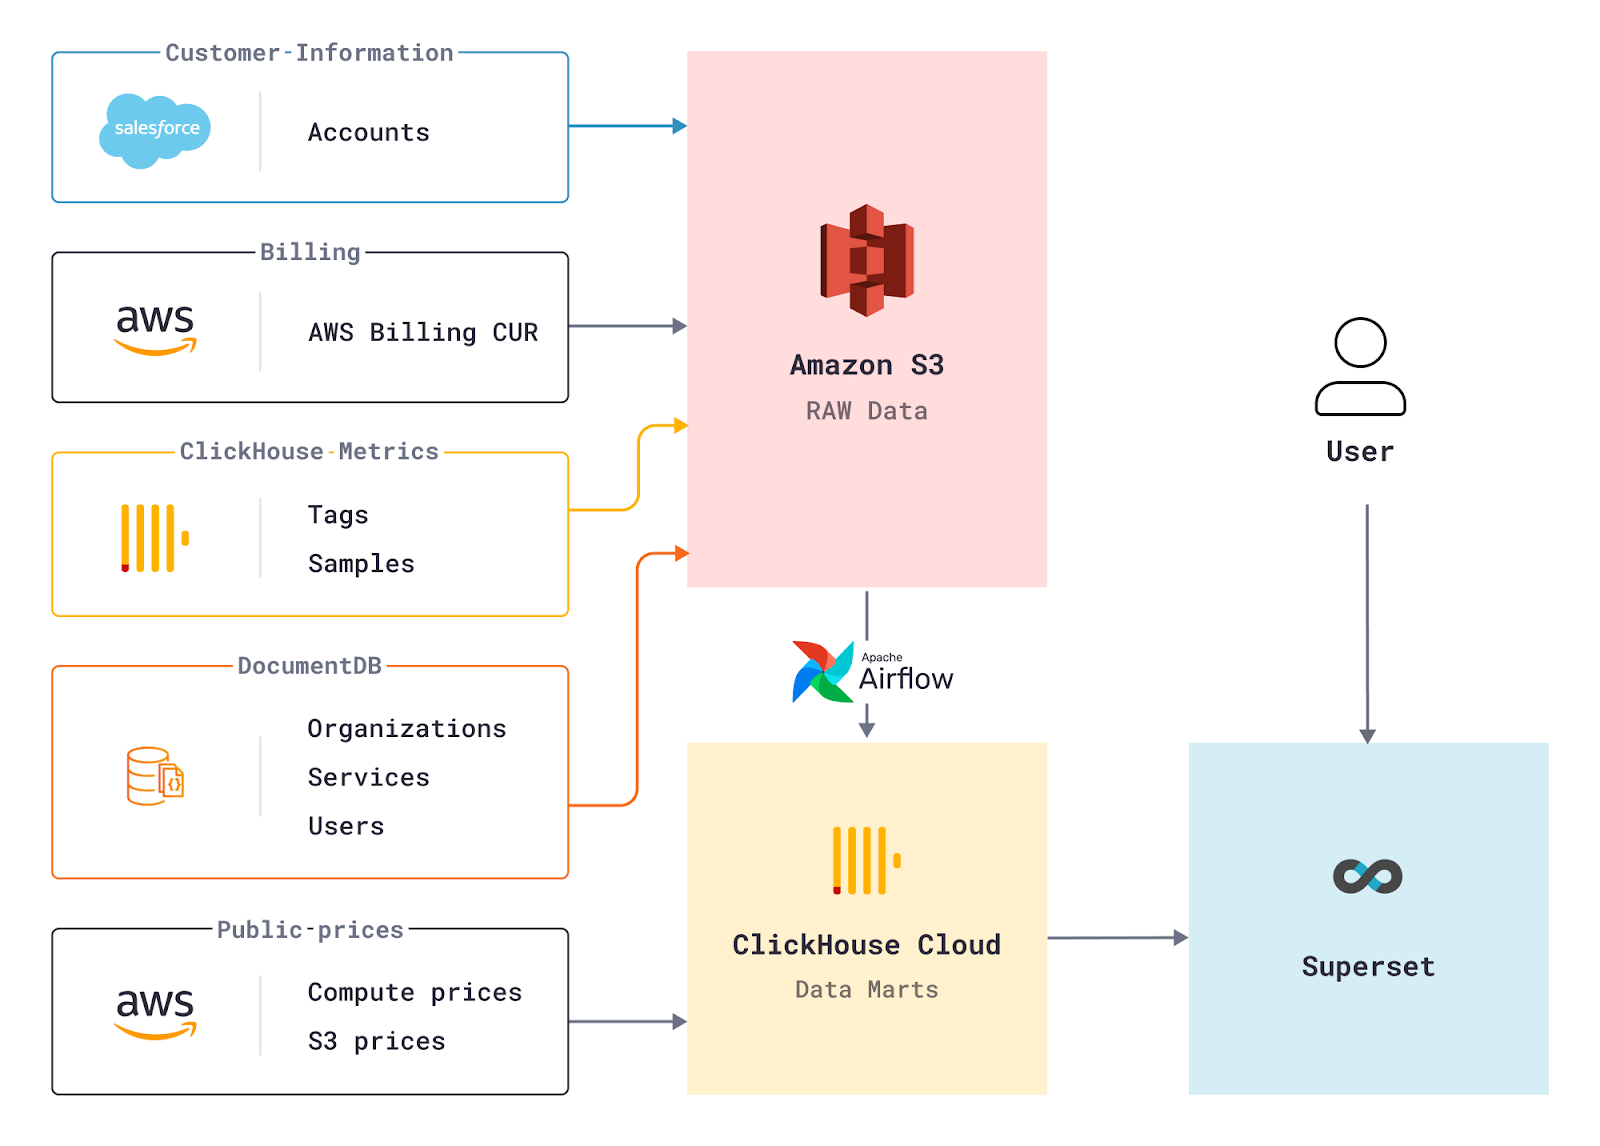
We use Apache Superset as a visualization layer on top of ClickHouse to see all of our data in one place. It is a powerful and easy-to-use open source BI tool that is perfect for our needs. Because of how this setup aggregates data from otherwise disparate systems, it is critical for operating ClickHouse Cloud. For example, we use this setup to track our conversion rates, fine-tune our autoscaling, control our AWS infrastructure costs, and serve as a reporting tool at our weekly internal meetings. Because it’s powered by ClickHouse, we never have to worry about overloading the system with “too much data”!
Takeaways #
Over the course of building ClickHouse Cloud we’ve learned a lot. If we had to net it out, the most important takeaways for us were these.
- Cloud is not truly elastic. Even though we think of the public cloud as elastic and limitless, at high scale, it is not. It's important to design with scale in mind, read the fine print on all the limitations, and ensure you are doing scale tests to figure out the bottlenecks in your infrastructure. For example, we ran into instance availability issues, and IAM role limits, and other gotchas using scale testing before we went to public beta, which prompted us to embrace cellular architecture.
- Reliability and security are features too. It is important to find a balance between new feature development and not compromising on reliability, security, and availability in the process. It’s tempting to just keep building/adding new features, especially when the product is in its early stages of development, but architectural decisions made early in the process have a huge impact down the line.
- Automate everything. Testing (user, functional, performance testing), implementing CI/CD pipelines to deploy all changes quickly and safely. Use Terraform for provisioning static infrastructure like EKS clusters, but use ArgoCD for dynamic infrastructure, as it allows you to have a single place where you see what is running in your infrastructure.
- Set aggressive goals. We set out to build our cloud in under a year. We decided on milestones in advance (May, October, December), and then planned out what was feasible by that time. We had to make hard decisions about what was most important for each milestone, and de-scoped as needed. Because we had a strict stack rank of features for each release, when we had to cut, we were able to drop what was at the bottom without regrets.
- Focus on time to market. To fast-track product development, it's crucial to decide which components of your architecture you need to build in-house vs buy existing solutions. For example, instead of building our own metering and marketplace integration, we leveraged m3ter and Tackle to help us get to market faster with usage-based pricing and marketplace billing. We would not have been able to build our cloud offering in a year, if we did not focus our engineering efforts on the most core innovation and partnered for the rest.
- Listen to your users. We brought our users as design partners onto our platform early on. Our private preview had 50 users that we invited to use our service for free to provide feedback. It was a hugely successful program that allowed us to very quickly learn what was working and what we had to adjust on the way to public beta. During public beta, again, we put down our pencils and went on a listening tour. On the way to GA, we quickly adjusted our pricing model and introduced dedicated services for developers to remove friction and align with the needs of our users.
- Track and analyze your cloud costs. It’s easy to use cloud infrastructure inefficiently from the start and get used to paying those big bills every month. Focus on cost efficiency not as an afterthought, but as a critical component when building and designing the product. Look for best practices of using cloud services, be it EC2, EKS, network, or block store like S3. We found 1PB of junk data in S3 due to failed multipart uploads, and turned on TTL to make sure it never happens again.
Conclusion #
We set out to build ClickHouse Cloud in a year, and we did, but it didn't happen without some hiccups and detours. In the end we were grateful, as always, for the many open-source tools we were able to leverage, making us all the more proud to be part of the open-source community. Since our launch, we have seen an overwhelming response from users, and we are grateful to everyone that participated in our private preview, beta, and has joined us on our journey since GA.
If you are curious to try ClickHouse Cloud, we offer $300 of credits during a 30-day trial to help you get started with your use case. If you have any questions about ClickHouse or ClickHouse Cloud, please join our community Slack channel or engage with our open source community on GitHub. We would love to hear feedback about your experience using ClickHouse Cloud and how we can make it better for you!
Get started with ClickHouse Cloud today and receive $300 in credits. At the end of your 30-day trial, continue with a pay-as-you-go plan, or contact us to learn more about our volume-based discounts. Visit our pricing page for details.


