I had never heard about birdwatching until the last day when I stumbled upon the Cornell Lab of Ornithology's eBird project. It provides a dataset of bird observations worldwide, with 1.5 billion records updated monthly.
I immediately loaded this dataset into my visualization tool. The adsb.exposed website already contains a dataset of air traffic with over 130 billion records and a dataset of Foursquare places. There is certainly a larger number of birds than airplanes, but the dataset of bird observations is a hundred times smaller, so it is easy to load and analyze it.
Dataset #
The dataset is located here in a zip file of 58 GB. It contains a CSV file of 440 GB in size.
Download the dataset #
1wget 'https://hosted-datasets.gbif.org/eBird/2023-eBird-dwca-1.0.zip'
Analyzing local and external datasets is very convenient with clickhouse-local, a small command-line tool that provides a full ClickHouse engine.
Download clickhouse-local #
1curl https://clickhouse.com/ | sh
2sudo ./clickhouse install # or run it as ./clickhouse without installation
Let's preview the dataset structure #
ClickHouse allows the processing of files inside archives without decompressing.
1DESCRIBE file('2023-eBird-dwca-1.0.zip :: *.csv');
    ┌─name──────────────┬─type──────────────┐
 1. │ basisofrecord     │ Nullable(String)  │
 2. │ institutioncode   │ Nullable(String)  │
 3. │ collectioncode    │ Nullable(String)  │
 4. │ catalognumber     │ Nullable(String)  │
 5. │ occurrenceid      │ Nullable(String)  │
 6. │ recordedby        │ Nullable(String)  │
 7. │ year              │ Nullable(Int64)   │
 8. │ month             │ Nullable(Int64)   │
 9. │ day               │ Nullable(Int64)   │
10. │ publishingcountry │ Nullable(String)  │
11. │ country           │ Nullable(String)  │
12. │ stateprovince     │ Nullable(String)  │
13. │ county            │ Nullable(String)  │
14. │ decimallatitude   │ Nullable(Float64) │
15. │ decimallongitude  │ Nullable(Float64) │
16. │ locality          │ Nullable(String)  │
17. │ kingdom           │ Nullable(String)  │
18. │ phylum            │ Nullable(String)  │
19. │ class             │ Nullable(String)  │
20. │ order             │ Nullable(String)  │
21. │ family            │ Nullable(String)  │
22. │ genus             │ Nullable(String)  │
23. │ specificepithet   │ Nullable(String)  │
24. │ scientificname    │ Nullable(String)  │
25. │ vernacularname    │ Nullable(String)  │
26. │ taxonremarks      │ Nullable(String)  │
27. │ taxonconceptid    │ Nullable(String)  │
28. │ individualcount   │ Nullable(Int64)   │
    └───────────────────┴───────────────────┘
The DESCRIBE query gives an automatically inferred schema for the data. The file table function allows the processing of files on the local filesystem and the :: notation allows the processing of files inside archives. All filenames support glob-expansions with *, ?, **, {0..9}, {abc,def}. For CSV files, ClickHouse automatically detects if there is a header and uses the header if it is present. It also automatically detects data types of columns. With all these conveniences, ClickHouse makes data processing seamless.
Preview the data #
1SELECT * FROM file('2023-eBird-dwca-1.0.zip :: *.csv') LIMIT 1;
Row 1:
──────
basisofrecord:     HumanObservation
institutioncode:   CLO
collectioncode:    EBIRD_ARG
catalognumber:     OBS602415301
occurrenceid:      URN:catalog:CLO:EBIRD_ARG:OBS602415301
recordedby:        obsr904254
year:              1989
month:             4
day:               23
publishingcountry: AR
country:           Argentina
stateprovince:     Salta
county:            Anta
decimallatitude:   -24.7
decimallongitude:  -64.63333
locality:          PN El Rey
kingdom:           Animalia
phylum:            Chordata
class:             Aves
order:             Pelecaniformes
family:            Threskiornithidae
genus:             Theristicus
specificepithet:   caudatus
scientificname:    Theristicus caudatus
vernacularname:    Buff-necked Ibis
taxonremarks:      ᴺᵁᴸᴸ
taxonconceptid:    avibase-5E393799
individualcount:   ᴺᵁᴸᴸ

1 row in set. Elapsed: 0.008 sec.
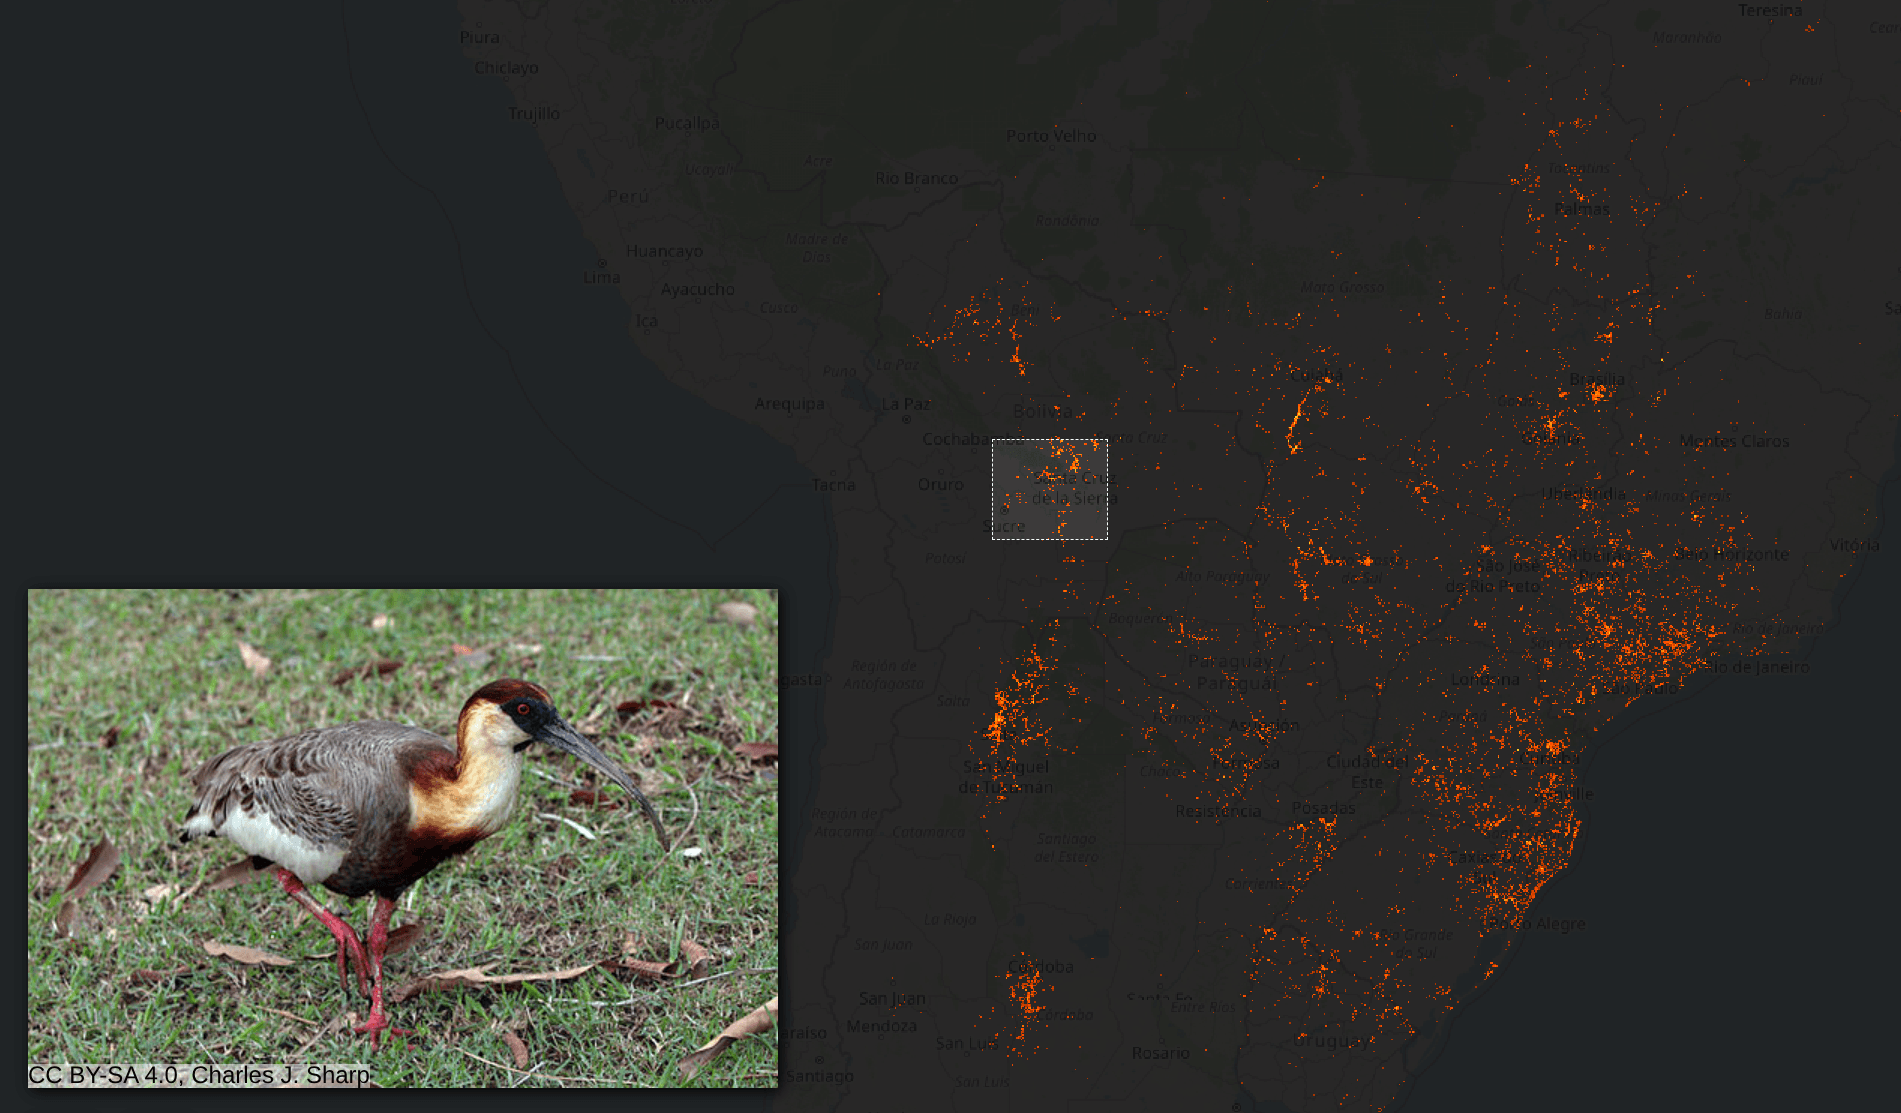
And this is an ibis in Argentina!
Loading into ClickHouse #
You can analyze the data with clickhouse-local, but to create an interactive website, we will load it to clickhouse-server. By the way, there is almost no difference between clickhouse-local and clickhouse-server - it is the same binary executable. The main difference is that clickhouse-server listens to connections.
Table structure #
I created the following table:
1CREATE TABLE birds_mercator
2(
3    basisofrecord LowCardinality(String),
4    institutioncode LowCardinality(String),
5    collectioncode LowCardinality(String),
6    catalognumber String,
7    occurrenceid String,
8    recordedby String,
9    year UInt16 EPHEMERAL,
10    month UInt8 EPHEMERAL,
11    day UInt8 EPHEMERAL,
12    publishingcountry LowCardinality(String),
13    country LowCardinality(String),
14    stateprovince LowCardinality(String),
15    county LowCardinality(String),
16    decimallatitude Float32,
17    decimallongitude Float32,
18    locality LowCardinality(String),
19    kingdom LowCardinality(String),
20    phylum LowCardinality(String),
21    class LowCardinality(String),
22    order LowCardinality(String),
23    family LowCardinality(String),
24    genus LowCardinality(String),
25    specificepithet LowCardinality(String),
26    scientificname LowCardinality(String),
27    vernacularname LowCardinality(String),
28    taxonremarks LowCardinality(String),
29    taxonconceptid LowCardinality(String),
30    individualcount UInt32,
31
32    date Date32 MATERIALIZED makeDate32(year, month, day),
33    mercator_x UInt32 MATERIALIZED 0xFFFFFFFF * ((decimallongitude + 180) / 360),
34    mercator_y UInt32 MATERIALIZED 0xFFFFFFFF * ((1 / 2) - ((log(tan(((decimallatitude + 90) / 360) * pi())) / 2) / pi())),
35    INDEX idx_x mercator_x TYPE minmax,
36    INDEX idx_y mercator_y TYPE minmax
37)
38ORDER BY mortonEncode(mercator_x, mercator_y)
Most of the structure is the same as inferred from the CSV file.
I removed Nullable because it is unneeded - I'd better use empty strings instead of NULLs, and it is generally good practice.
I've replaced year, month, day with EPHEMERAL columns and added a date column, calculated from them: date Date MATERIALIZED makeDate(year, month, day). EPHEMERAL columns are used in INSERT queries but are not stored in a table - they can be used to calculate expressions for other columns to apply transformations on the insertion time. In contrast, MATERIALIZED columns are columns that cannot be used in the INSERT query but are always calculated from their expressions.
I've analyzed the number of distinct values in various columns and replaced many of the String data types with LowCardinality(String) to apply dictionary encoding. For example, the country column contains only 253 unique values.
Additionally, I've created two materialized columns, mercator_x and mercator_y that map the lat/lon coordinates to the Web Mercator projection. The coordinates on the Mercator projection are represented by two UInt32 numbers for easier segmentation of the map into tiles. Additionally, I set up the order of the table by a space-filling curve on top of these numbers, and I created two minmax indices for faster search. ClickHouse has everything we need for real-time mapping applications!
Data loading #
Then, I loaded the data with the following query:
1ch --progress --query "
2    SELECT * FROM file('2023-eBird-dwca-1.0.zip :: eod.csv')
3    WHERE decimallatitude BETWEEN -89 AND 89
4      AND decimallongitude BETWEEN -180 AND 180
5    FORMAT Native" \
6| clickhouse-client --host ... --query "INSERT INTO birds_mercator (basisofrecord, institutioncode, collectioncode, catalognumber, occurrenceid, recordedby, year, month, day, publishingcountry, country, stateprovince, county, decimallatitude, decimallongitude, locality, kingdom, phylum, class, order, family, genus, specificepithet, scientificname, vernacularname, taxonremarks, taxonconceptid, individualcount) FORMAT Native"
Here, I use clickhouse-local (which is available under the ch alias after installation) to filter out of bound values of latitude and longitude (required by the Mercator projection) and convert the result to the Native format, which is optimal for insertion. The result is piped into clickhouse-client and inserted into my ClickHouse server in ClickHouse Cloud.
The table took only 16.8 GB in ClickHouse, which is much less than the 58 GB zip file, thanks to ClickHouse compression! This is only 11 bytes on average per each of the 1.5 billion bird observations.
1SELECT name, total_rows, total_bytes FROM system.tables WHERE name = 'birds_mercator'
┌─name───────────┬─total_rows─┬─total_bytes─┐
│ birds_mercator │ 1512208407 │ 16847994349 │
└────────────────┴────────────┴─────────────┘
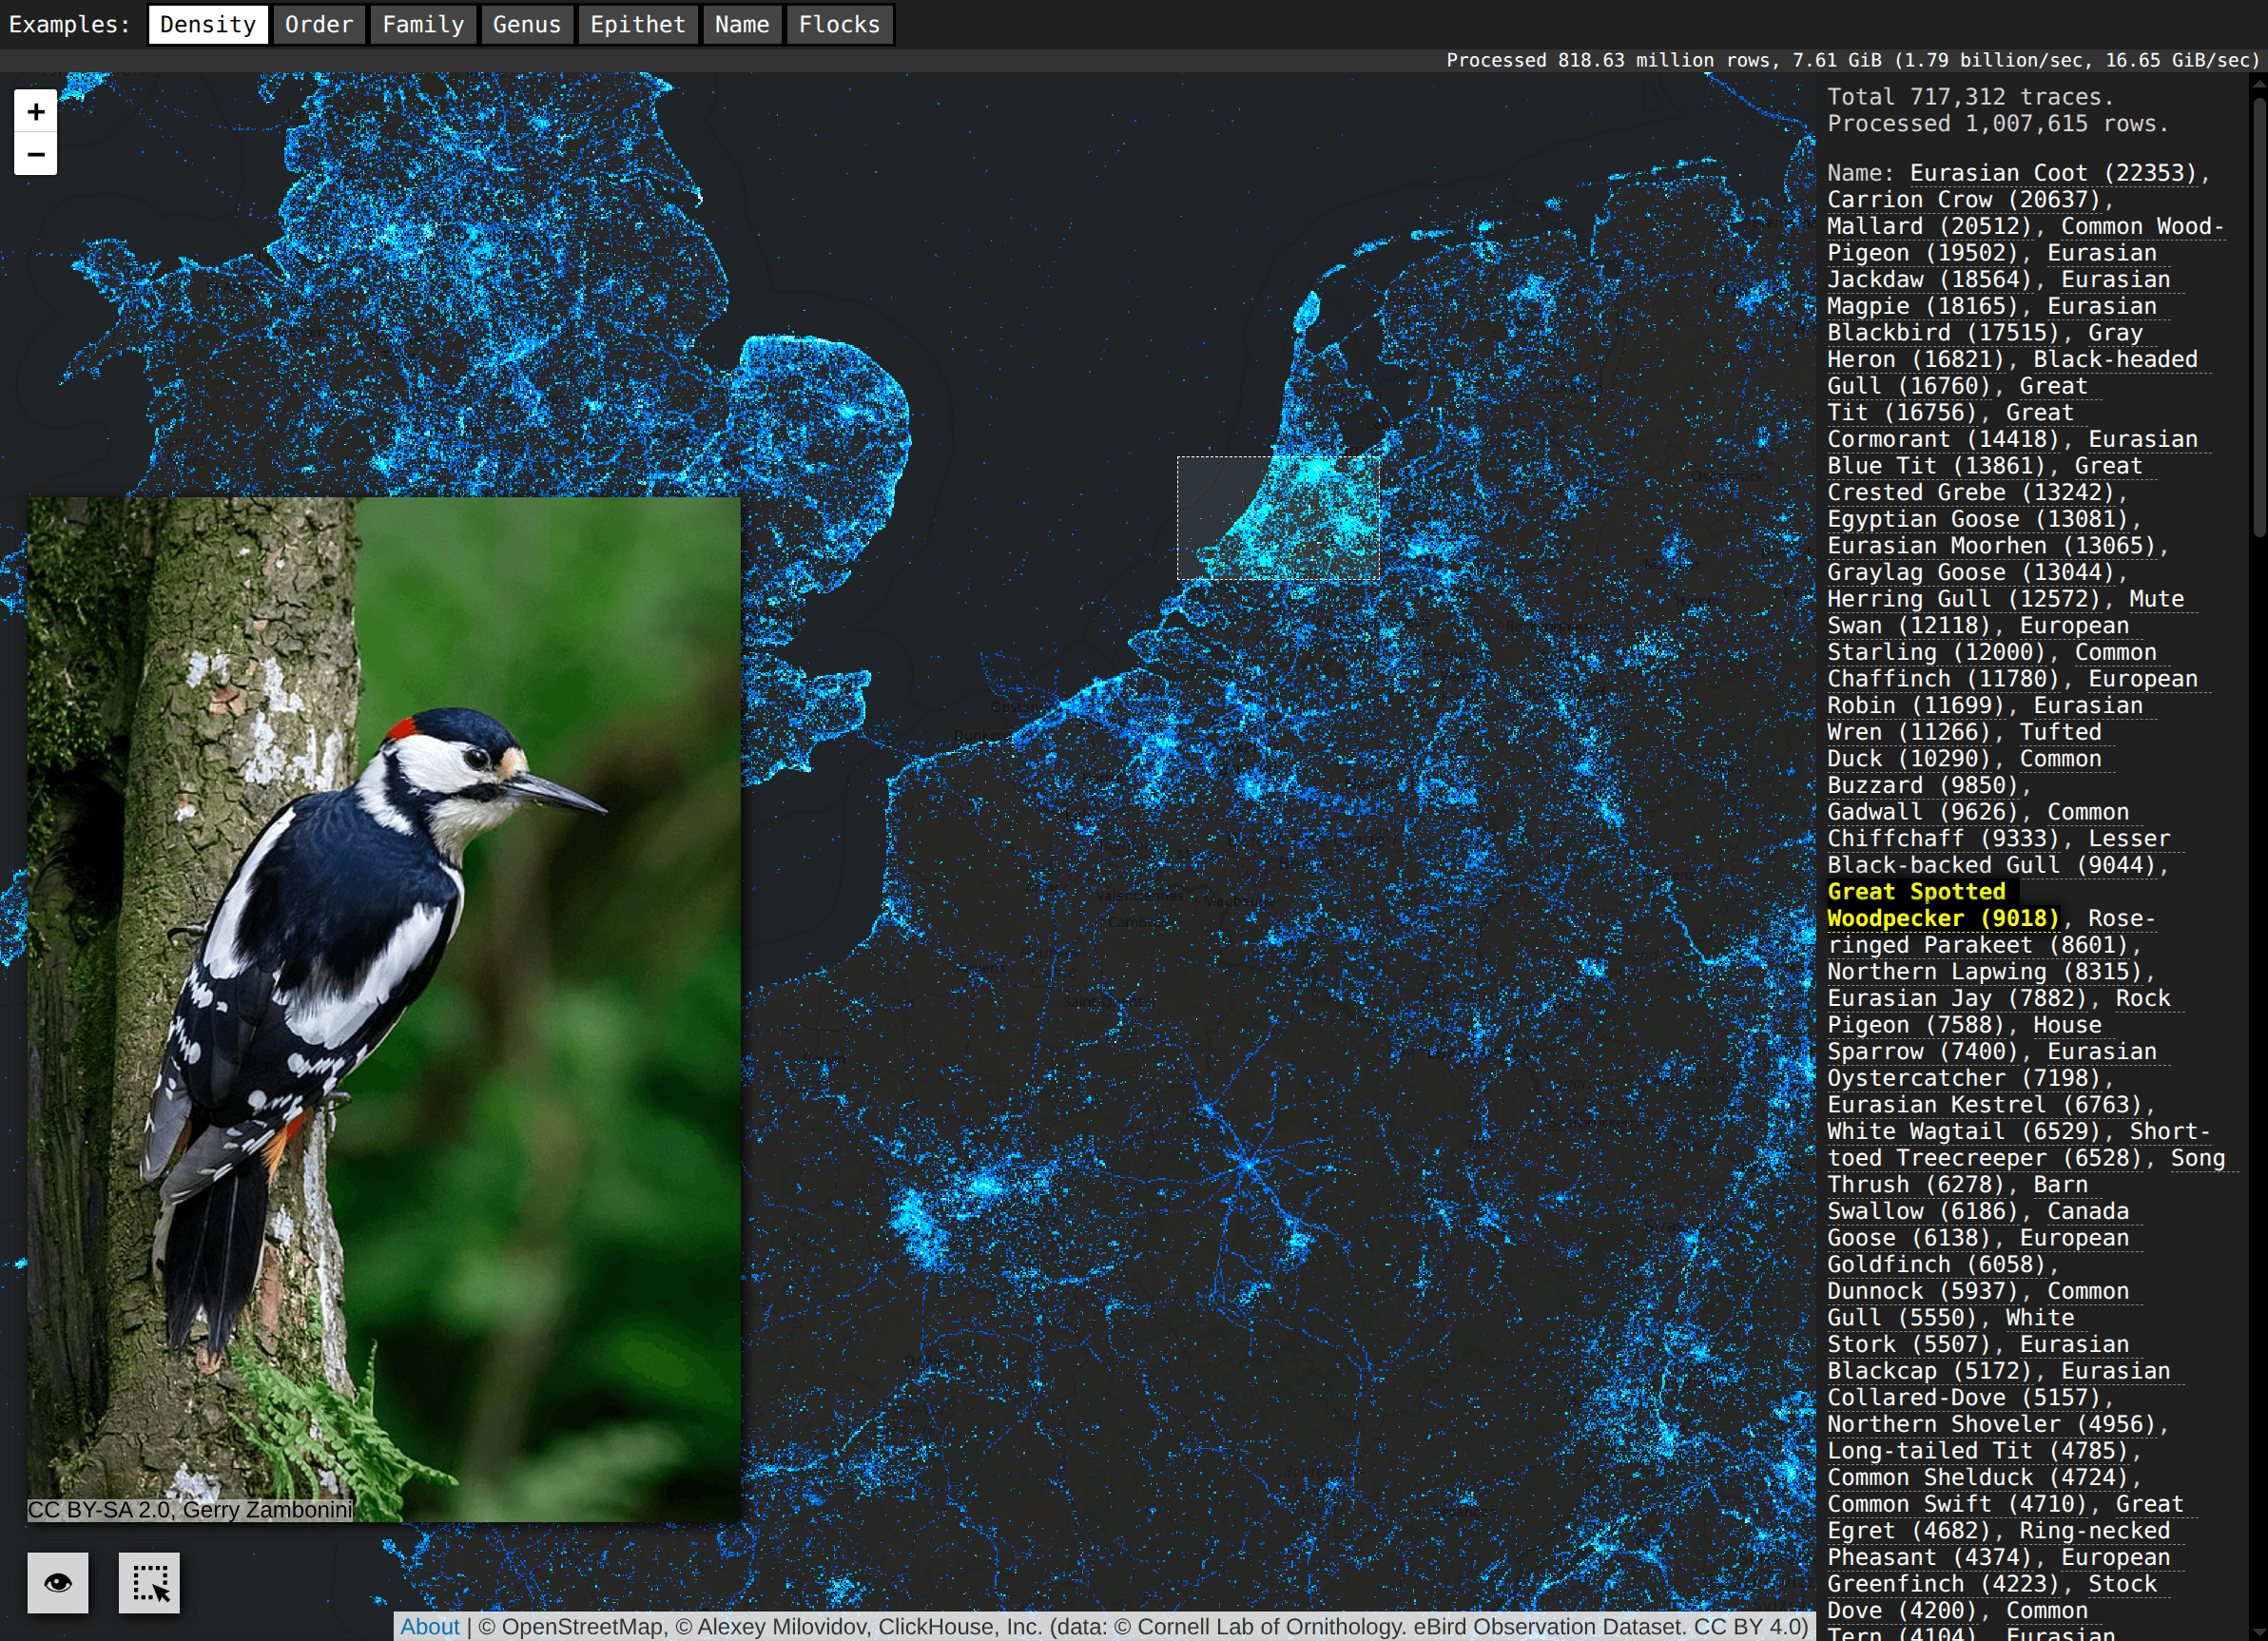
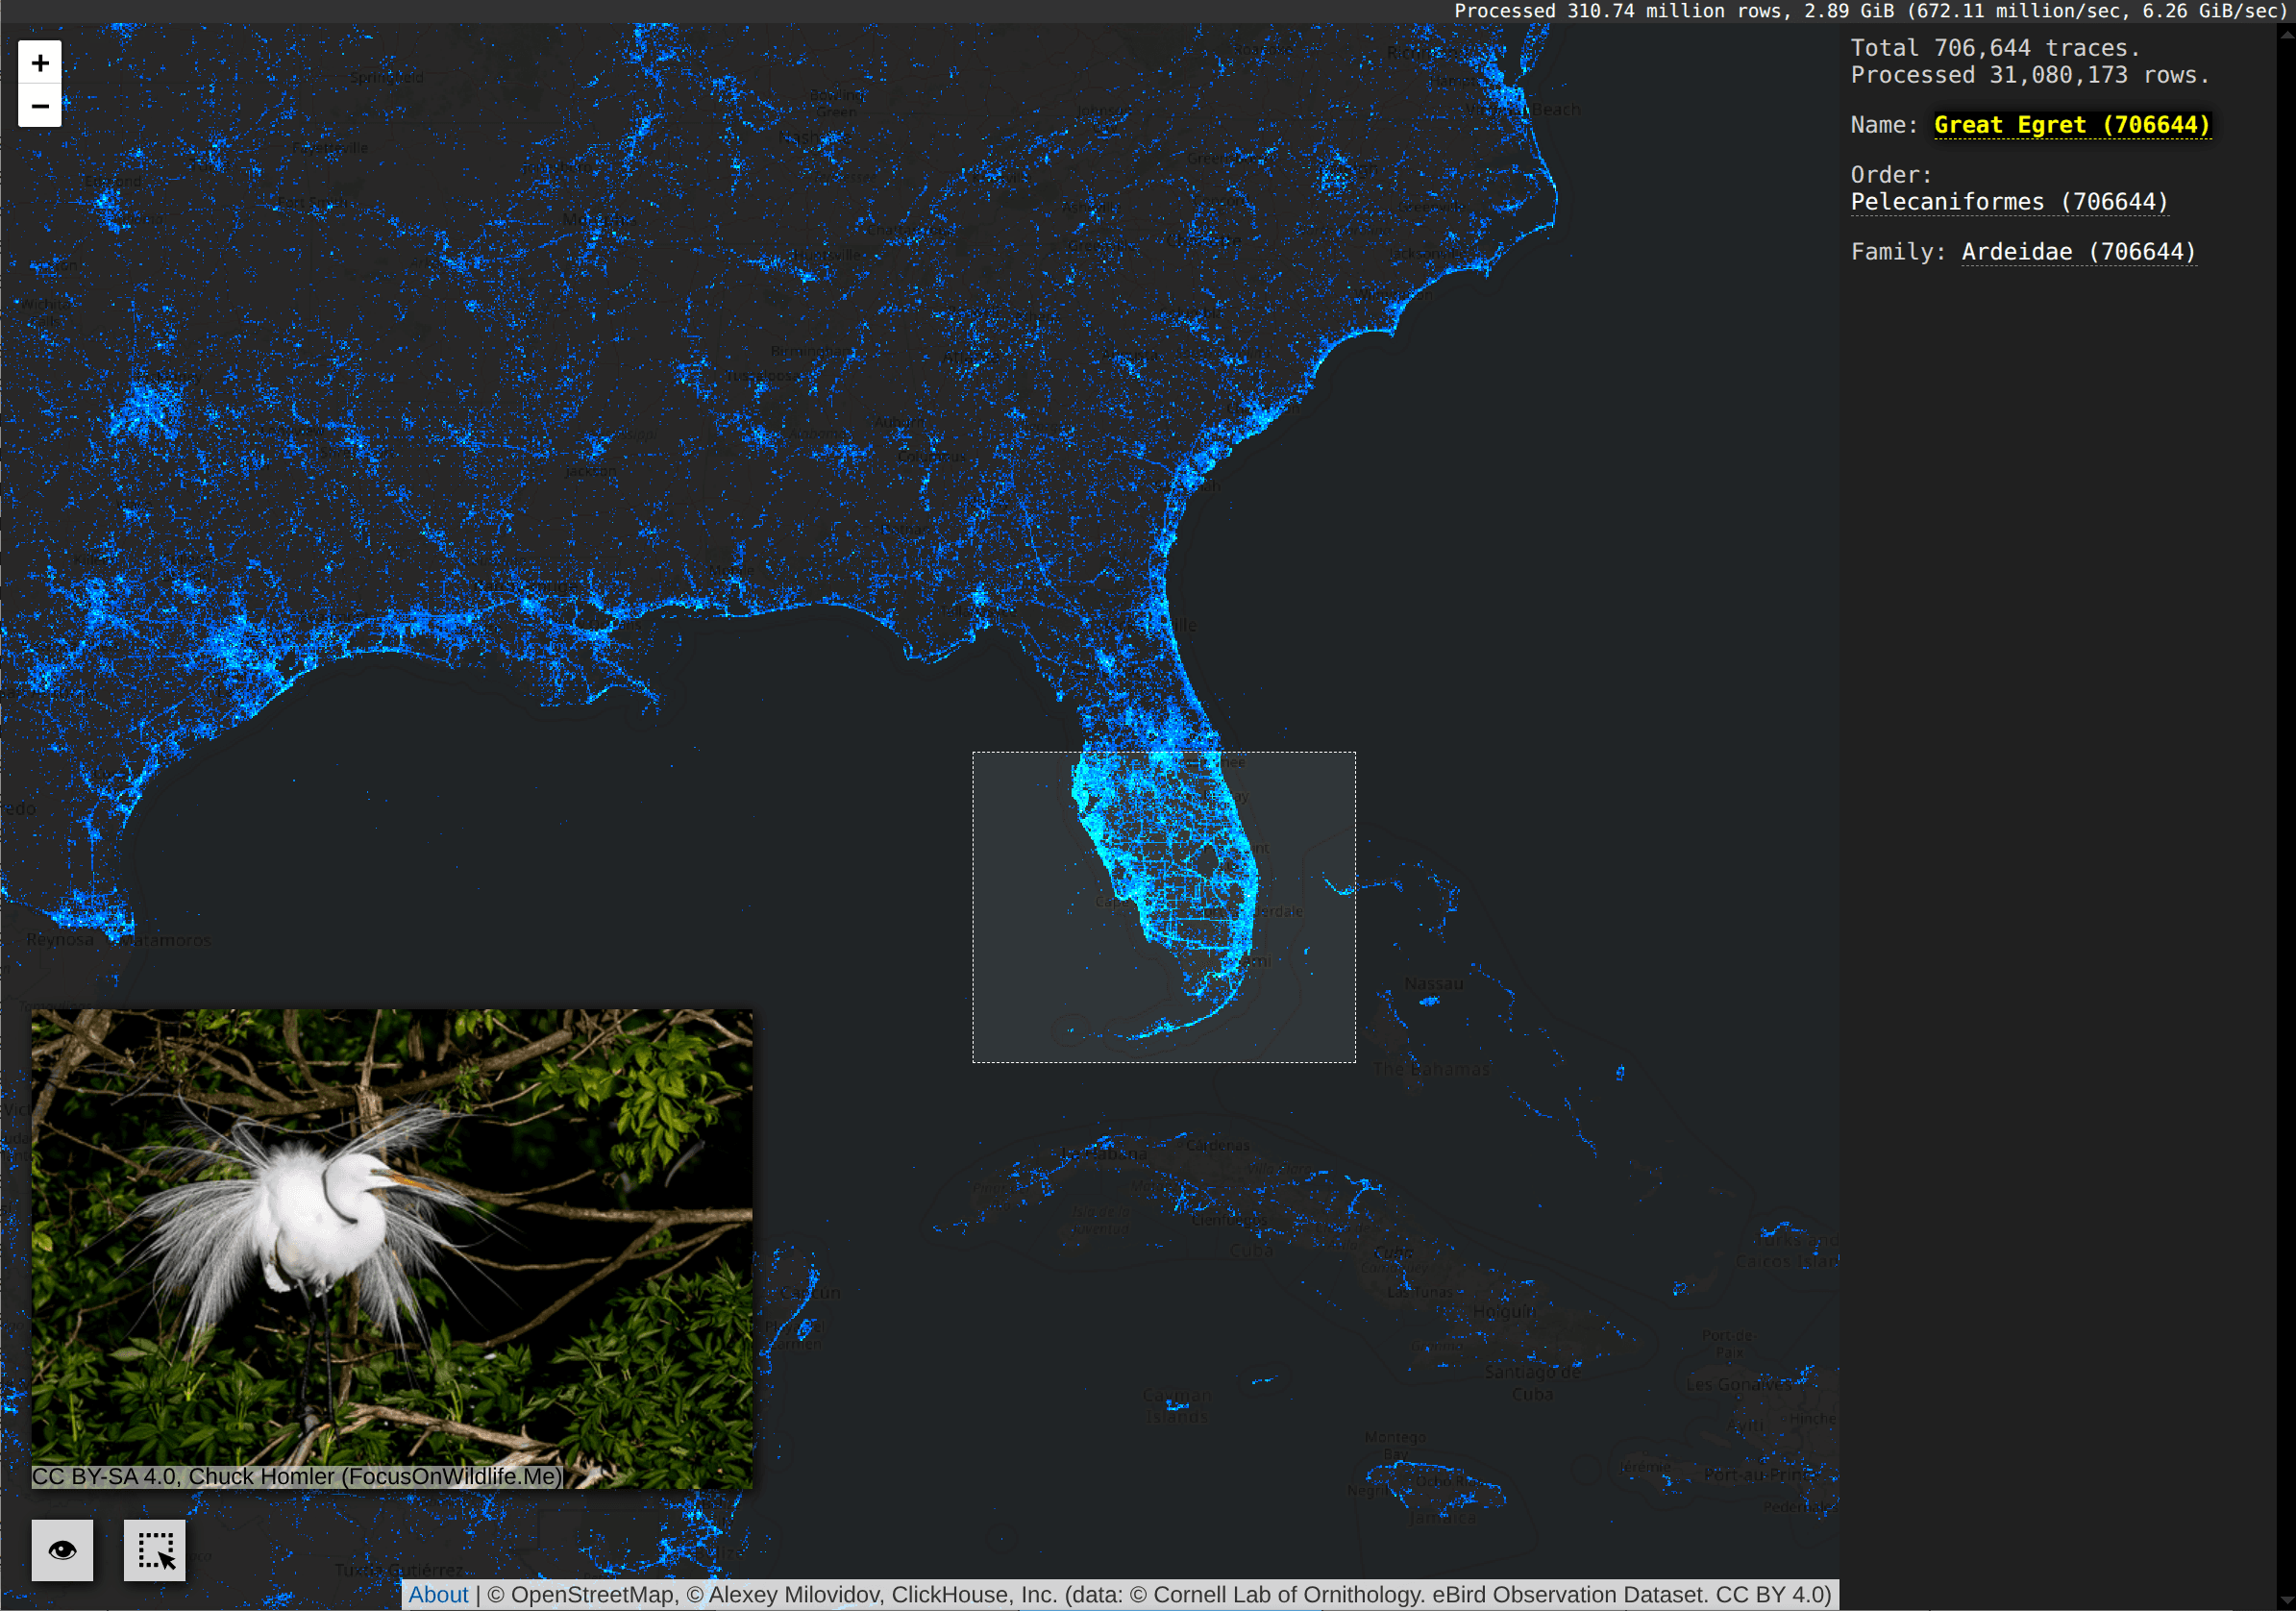
Visualization #
I've added the dataset with this configuration change, and we can instantly explore it!
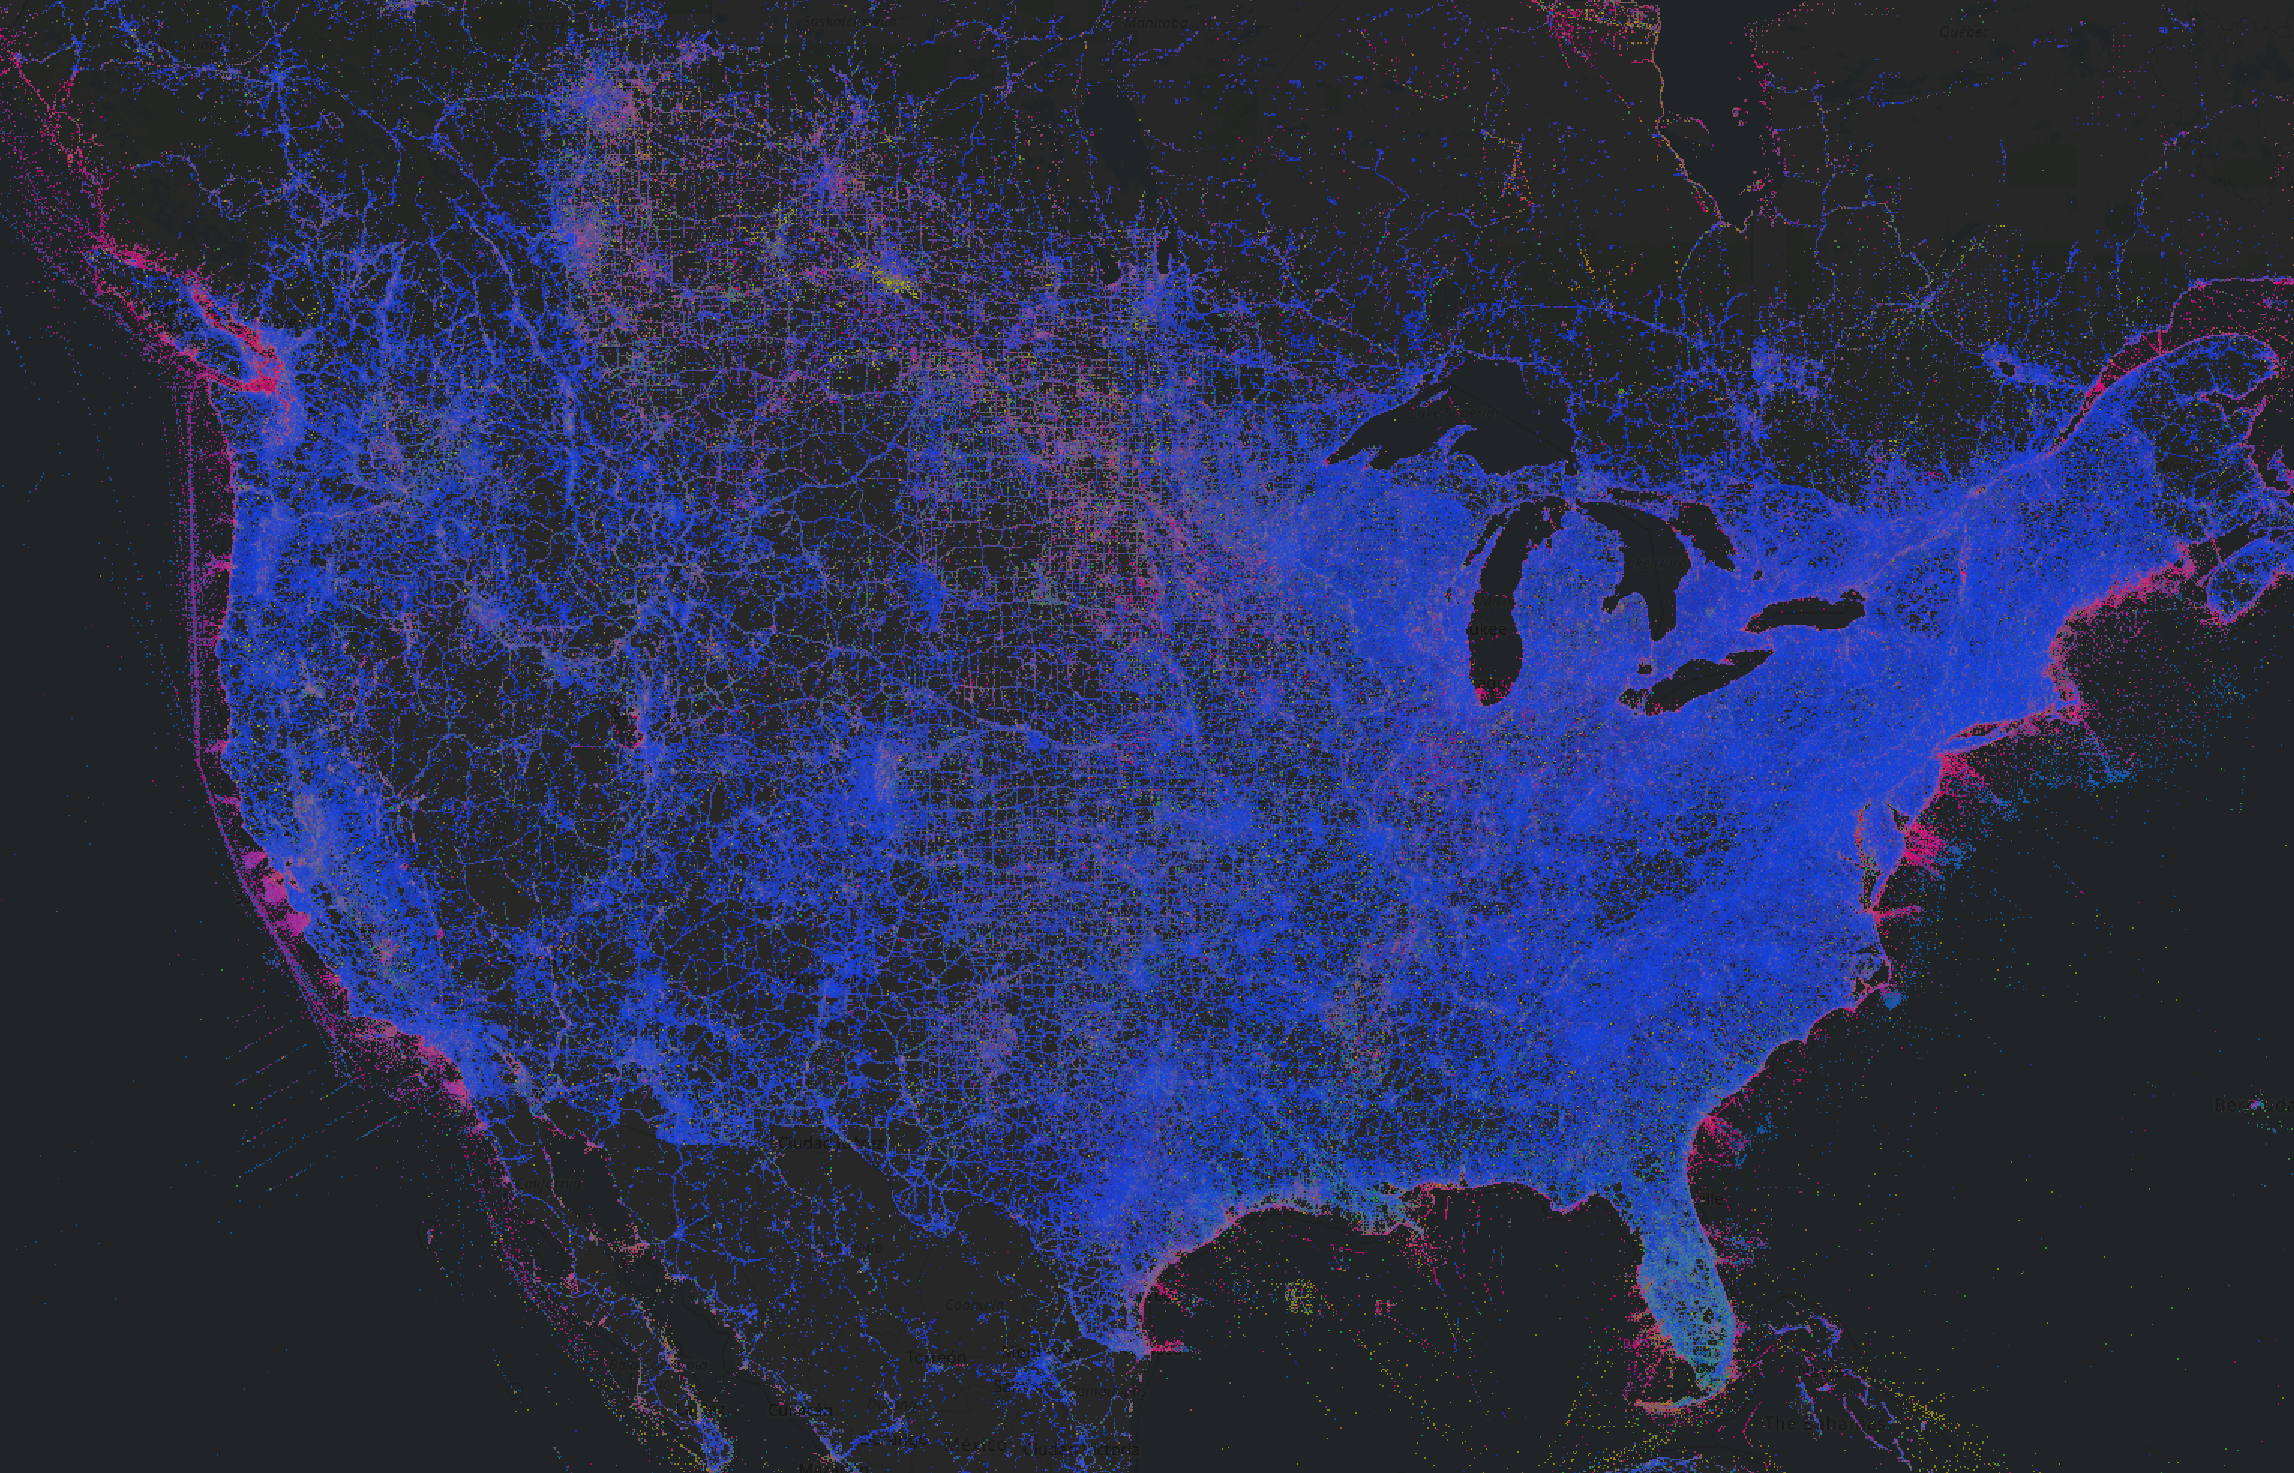
For example, you can color the map by different orders of birds:
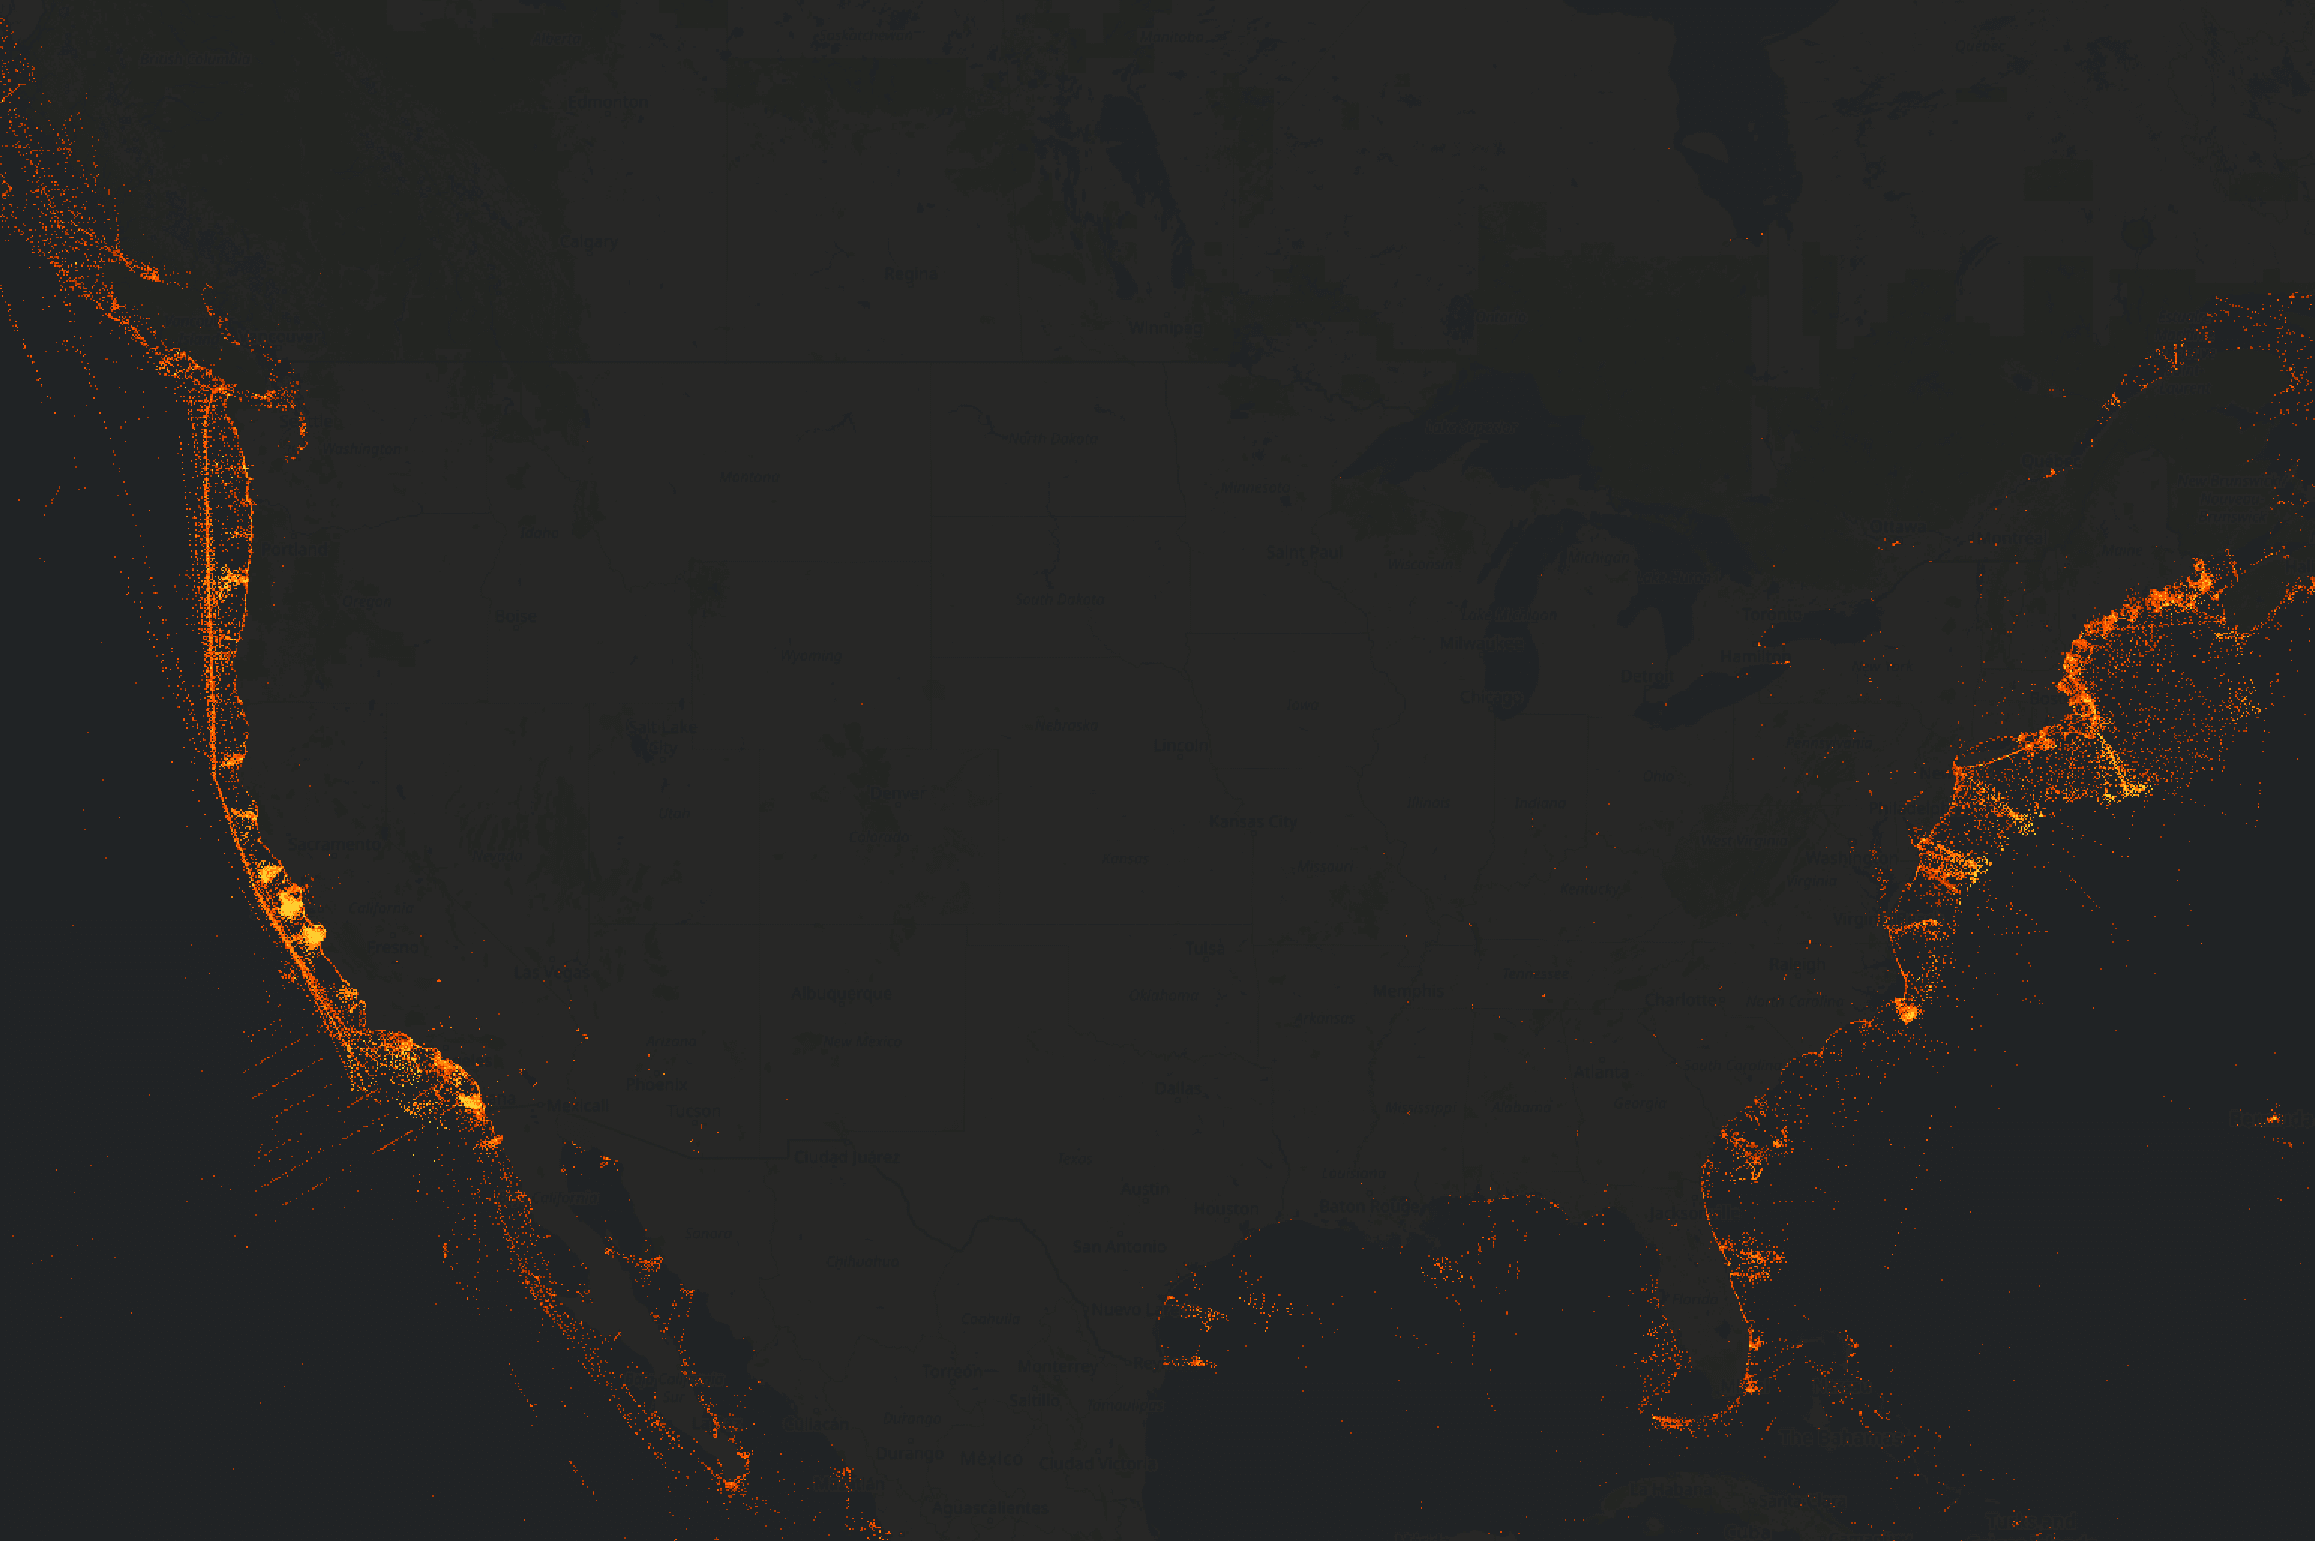
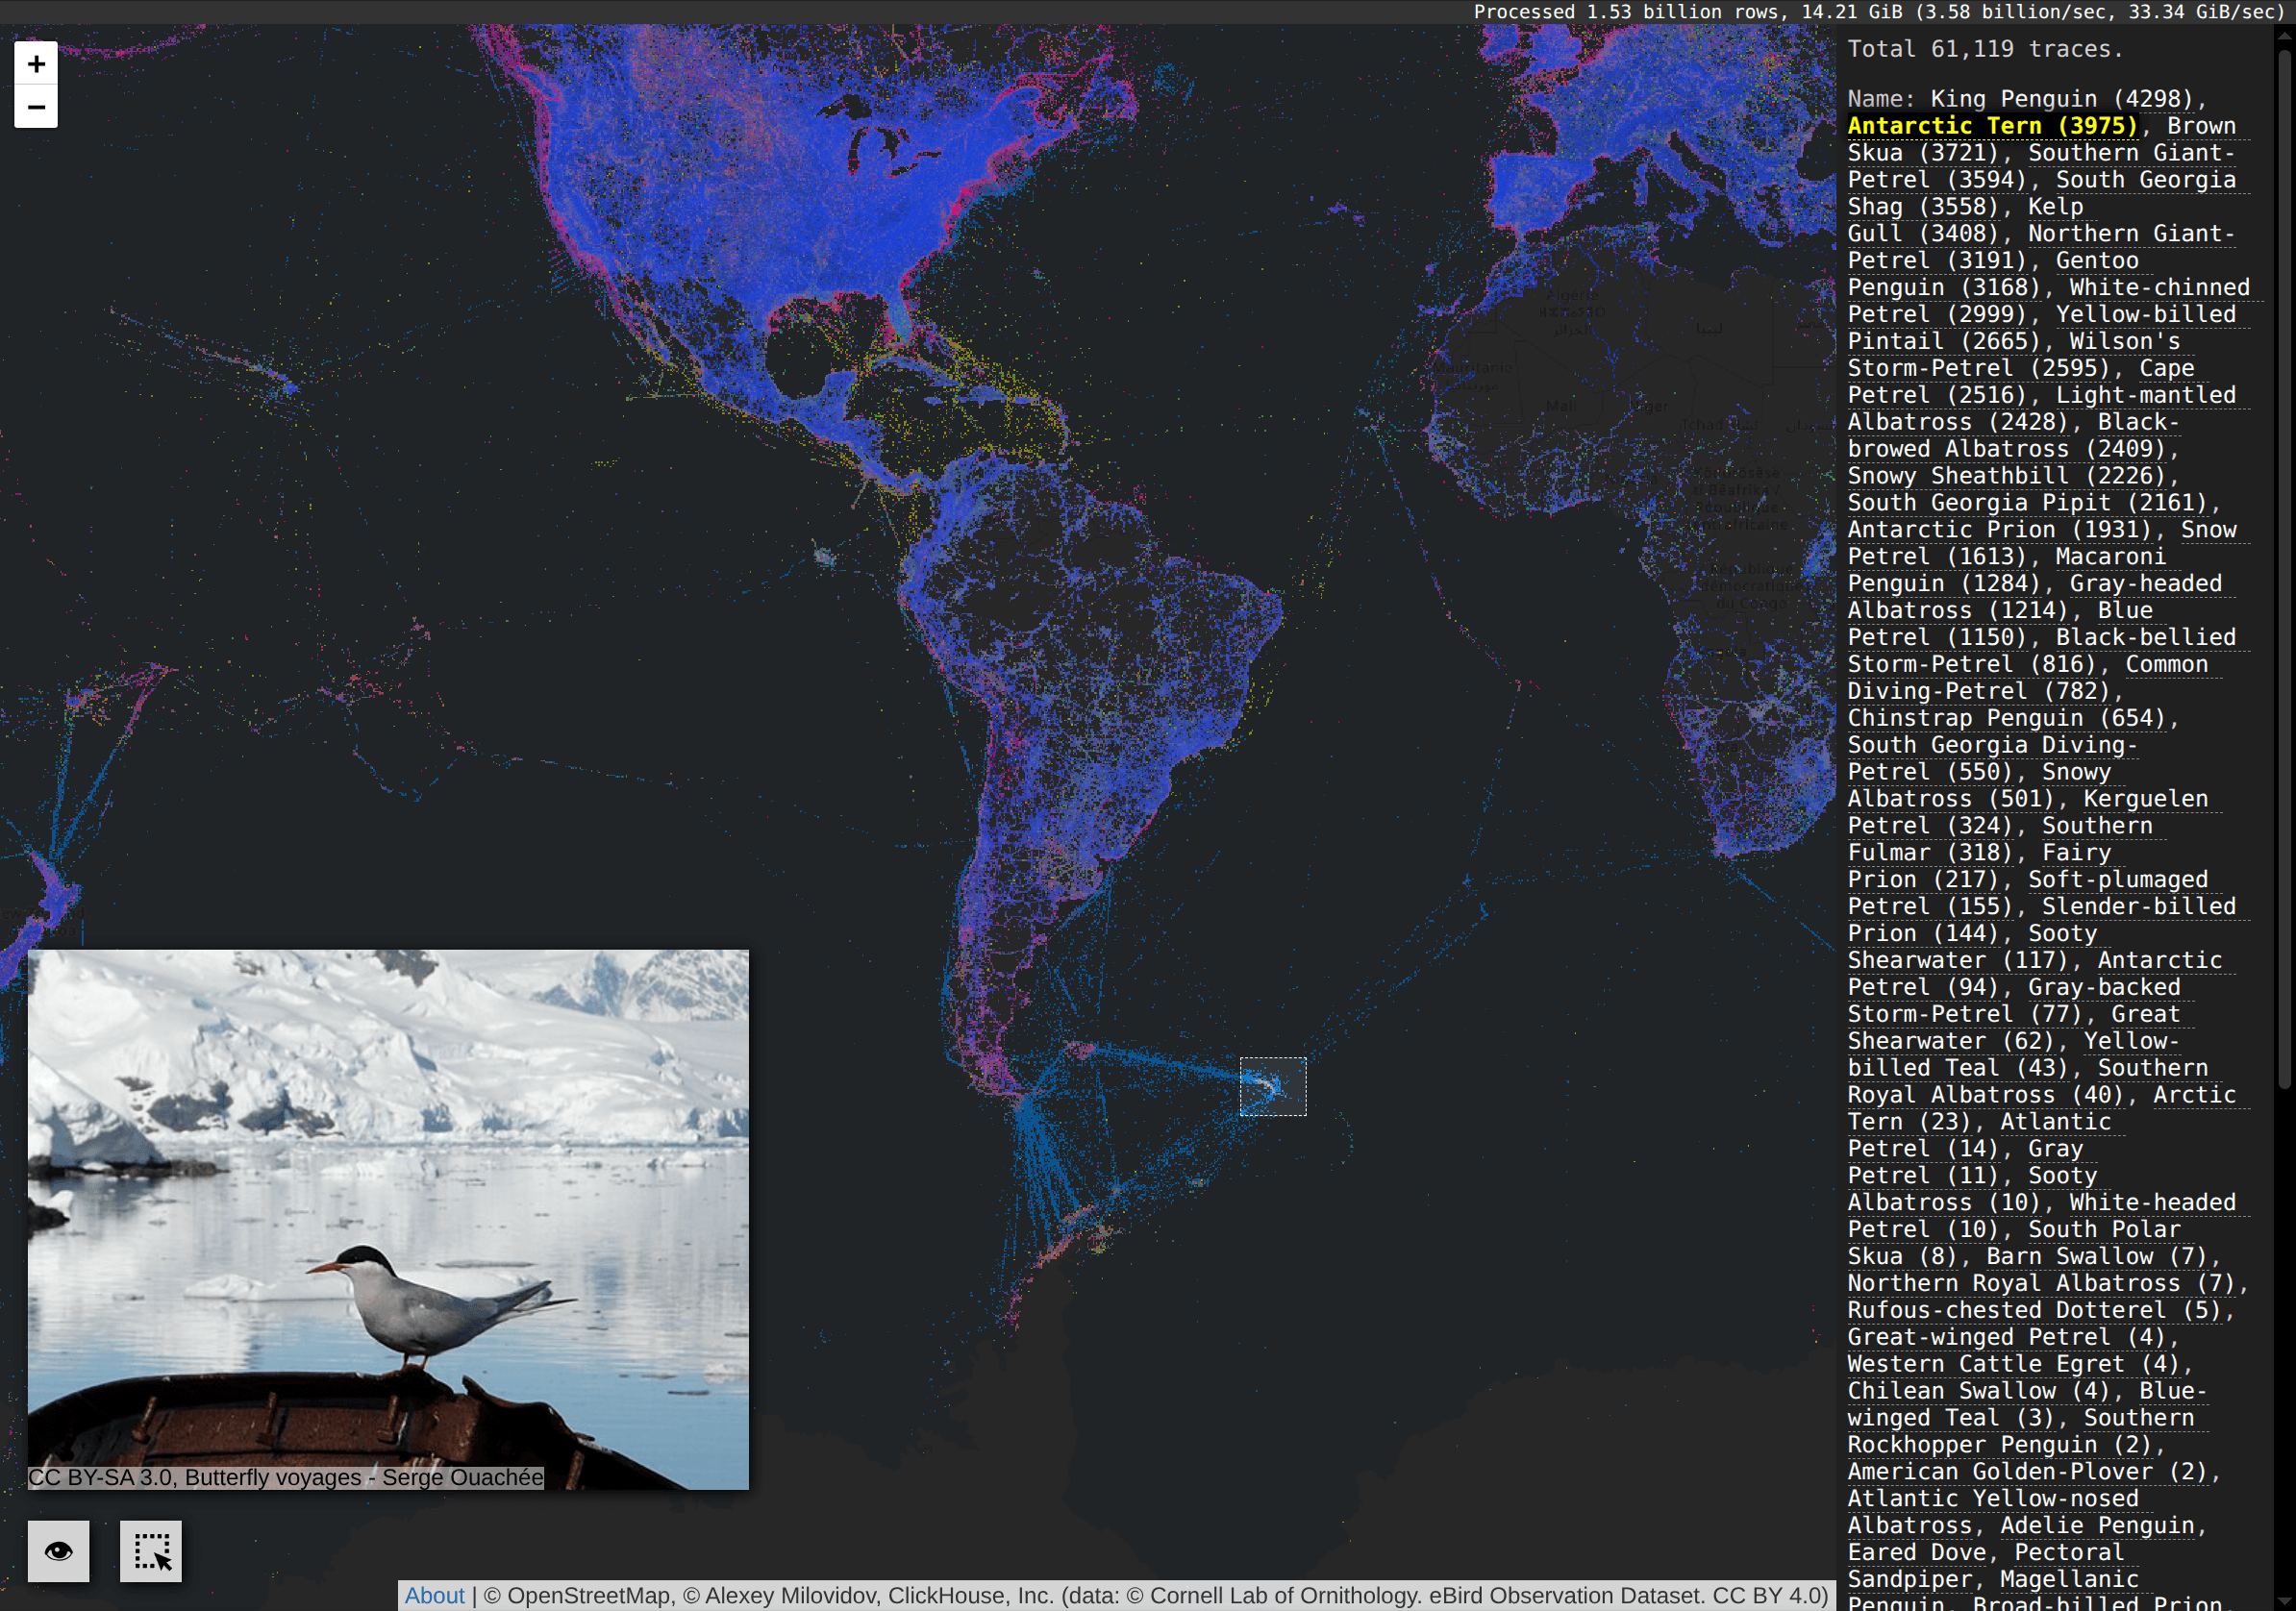
We can map only sea birds:
Interesting to look birds' paths in the south Atlantic near Patagonia:
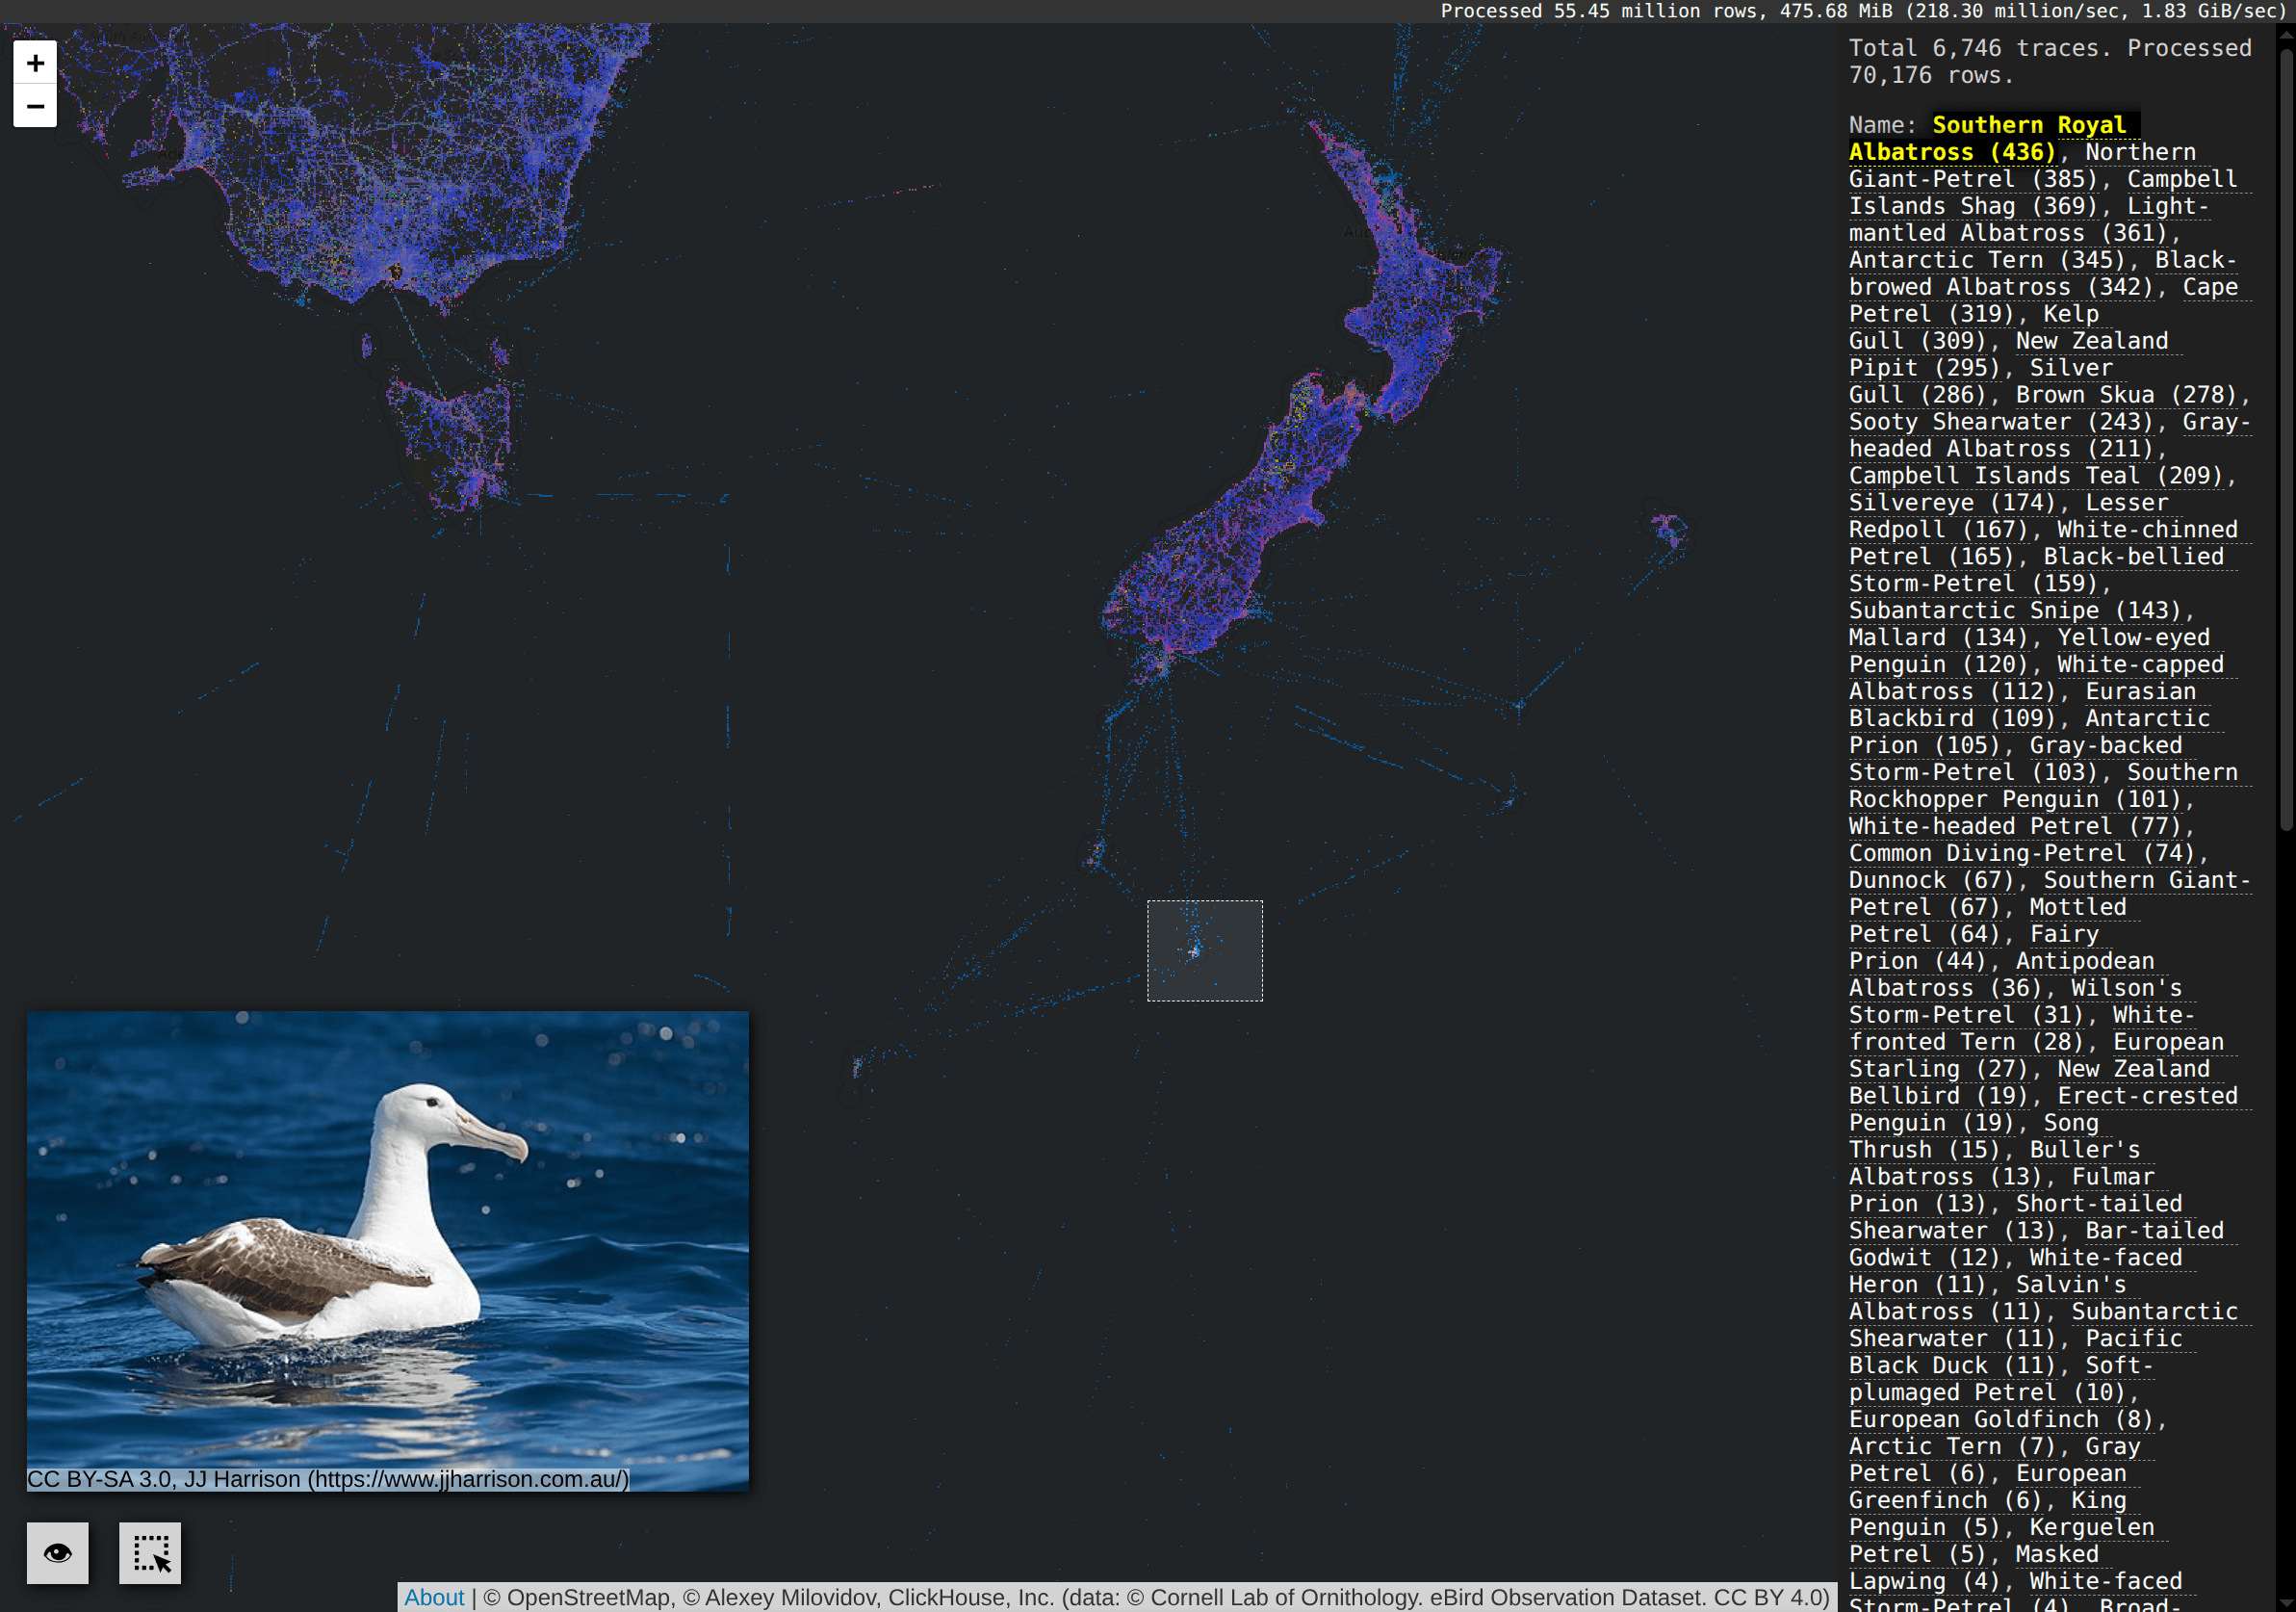
And New Zealand:
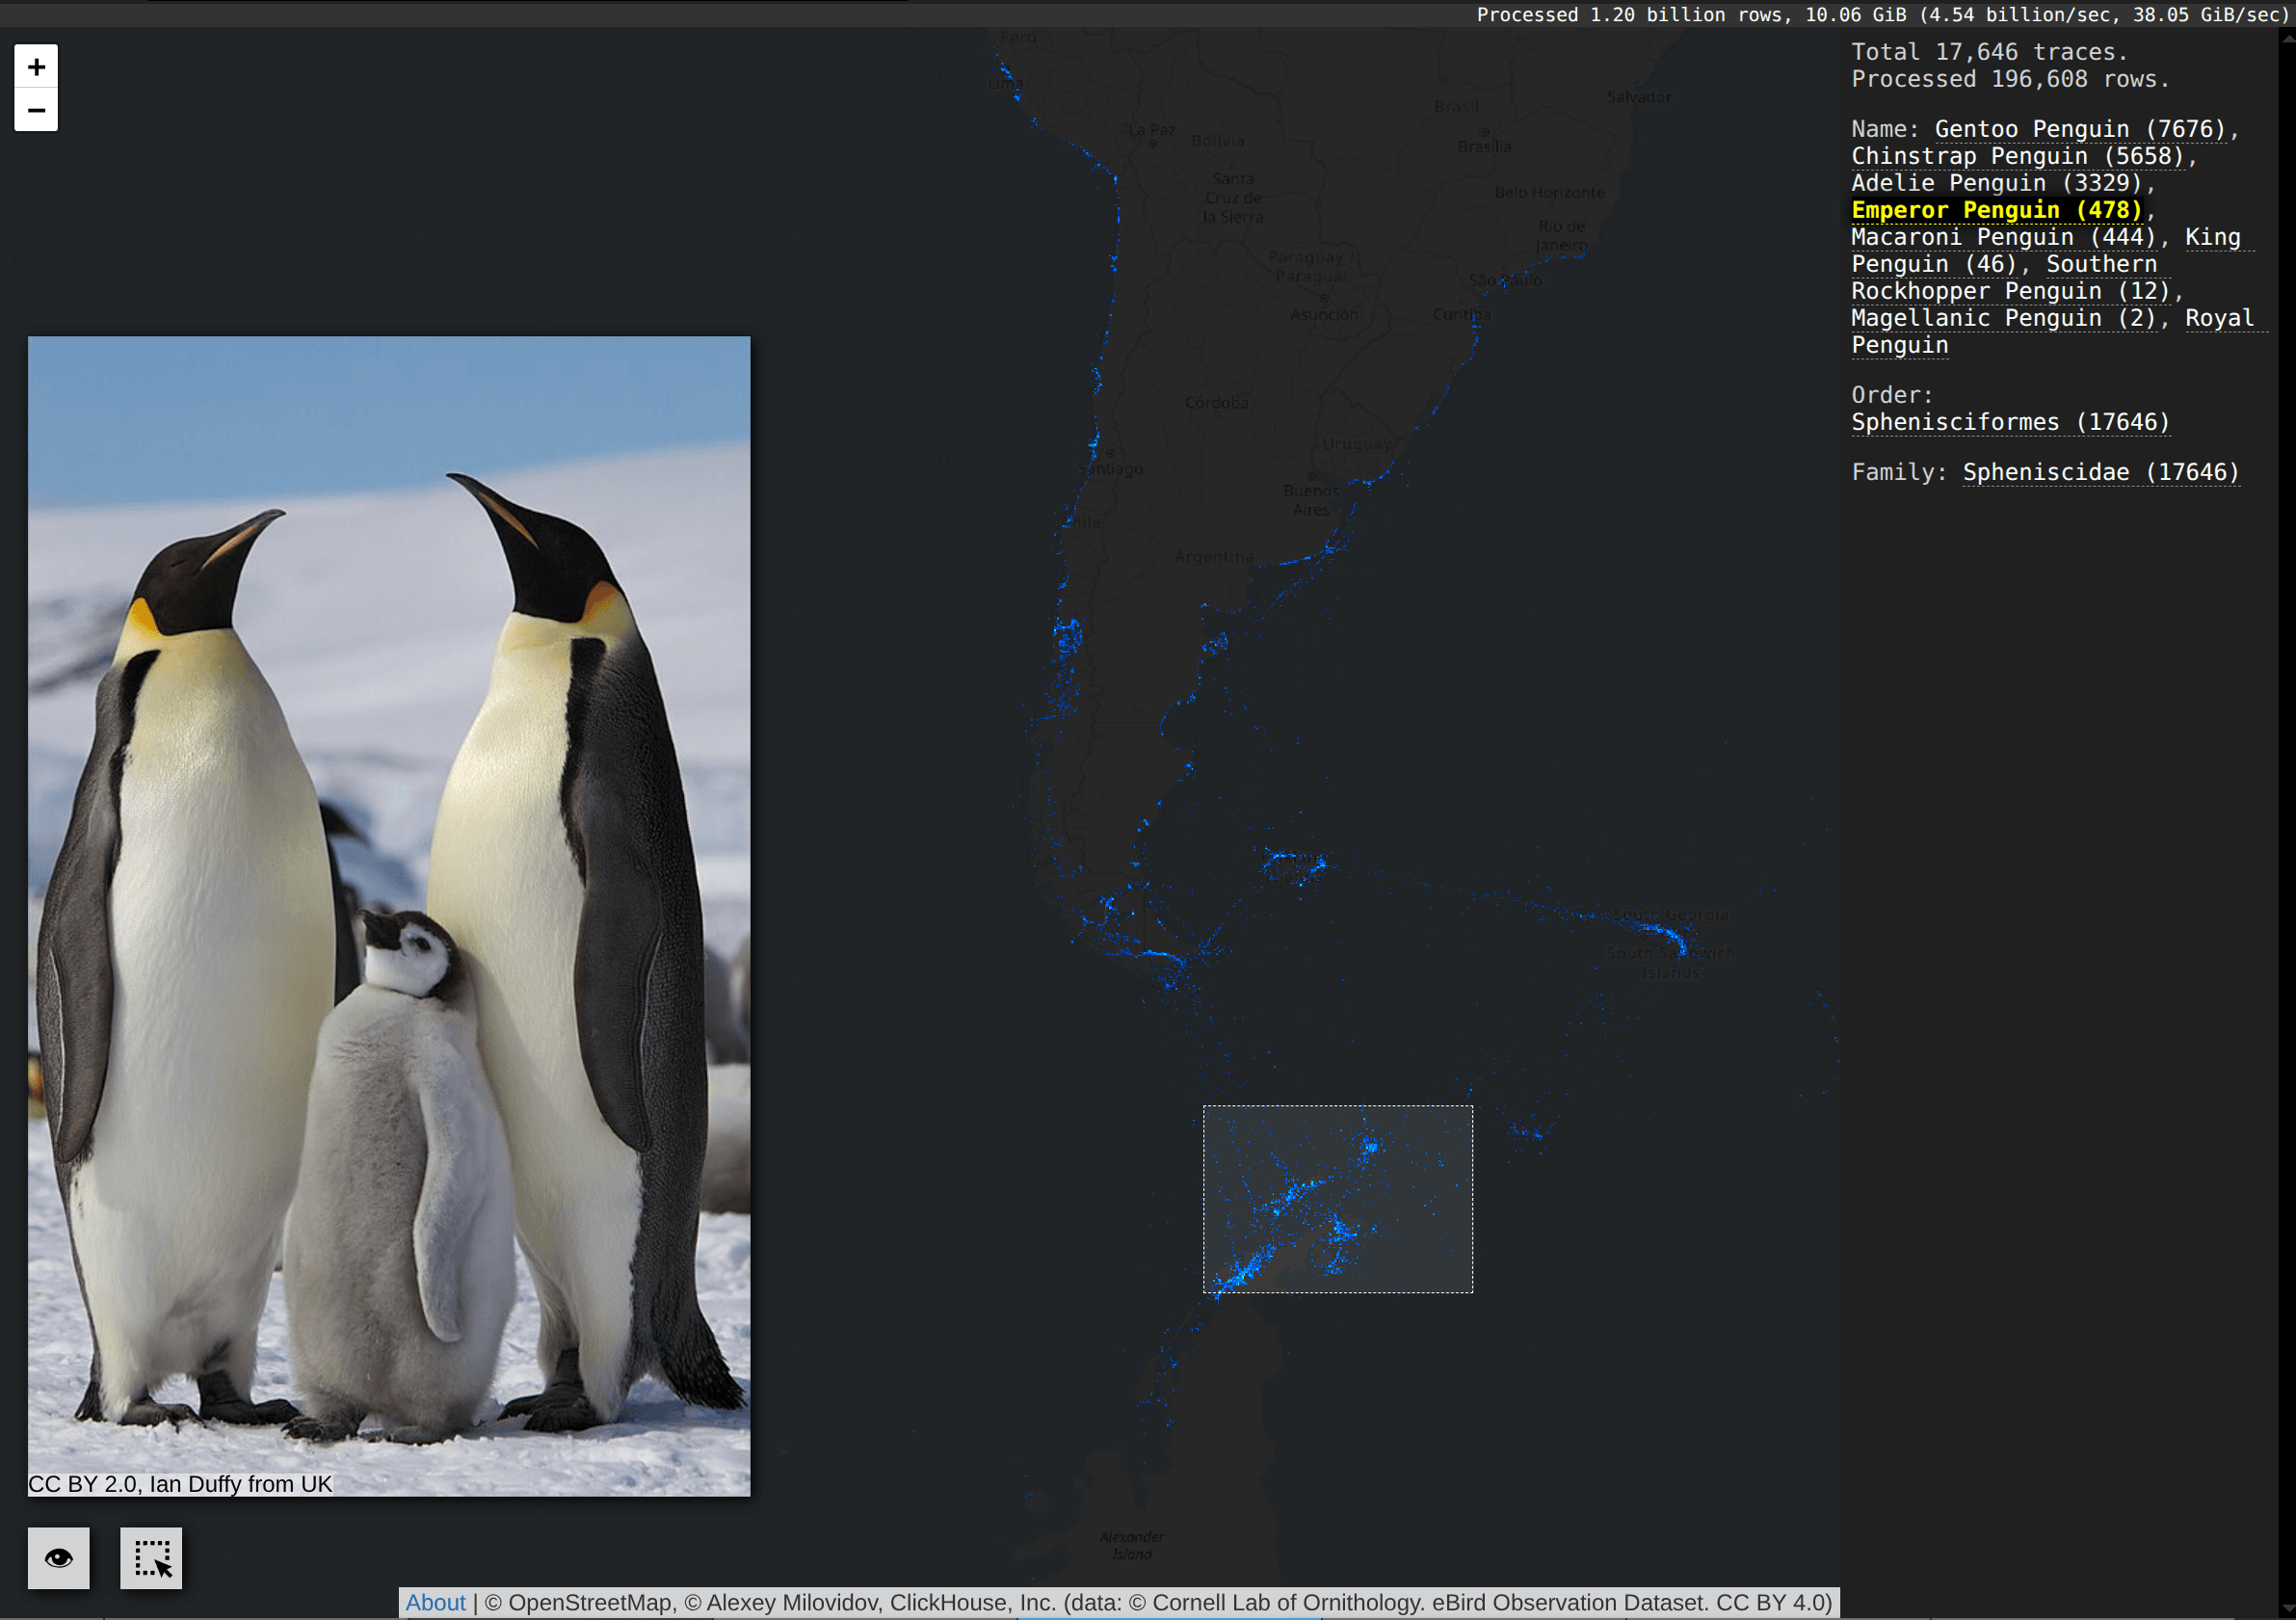
Let's filter only penguins:
Let's show different sorts of Kiwi by adding AND family = 'Apterygidae' to the filter:
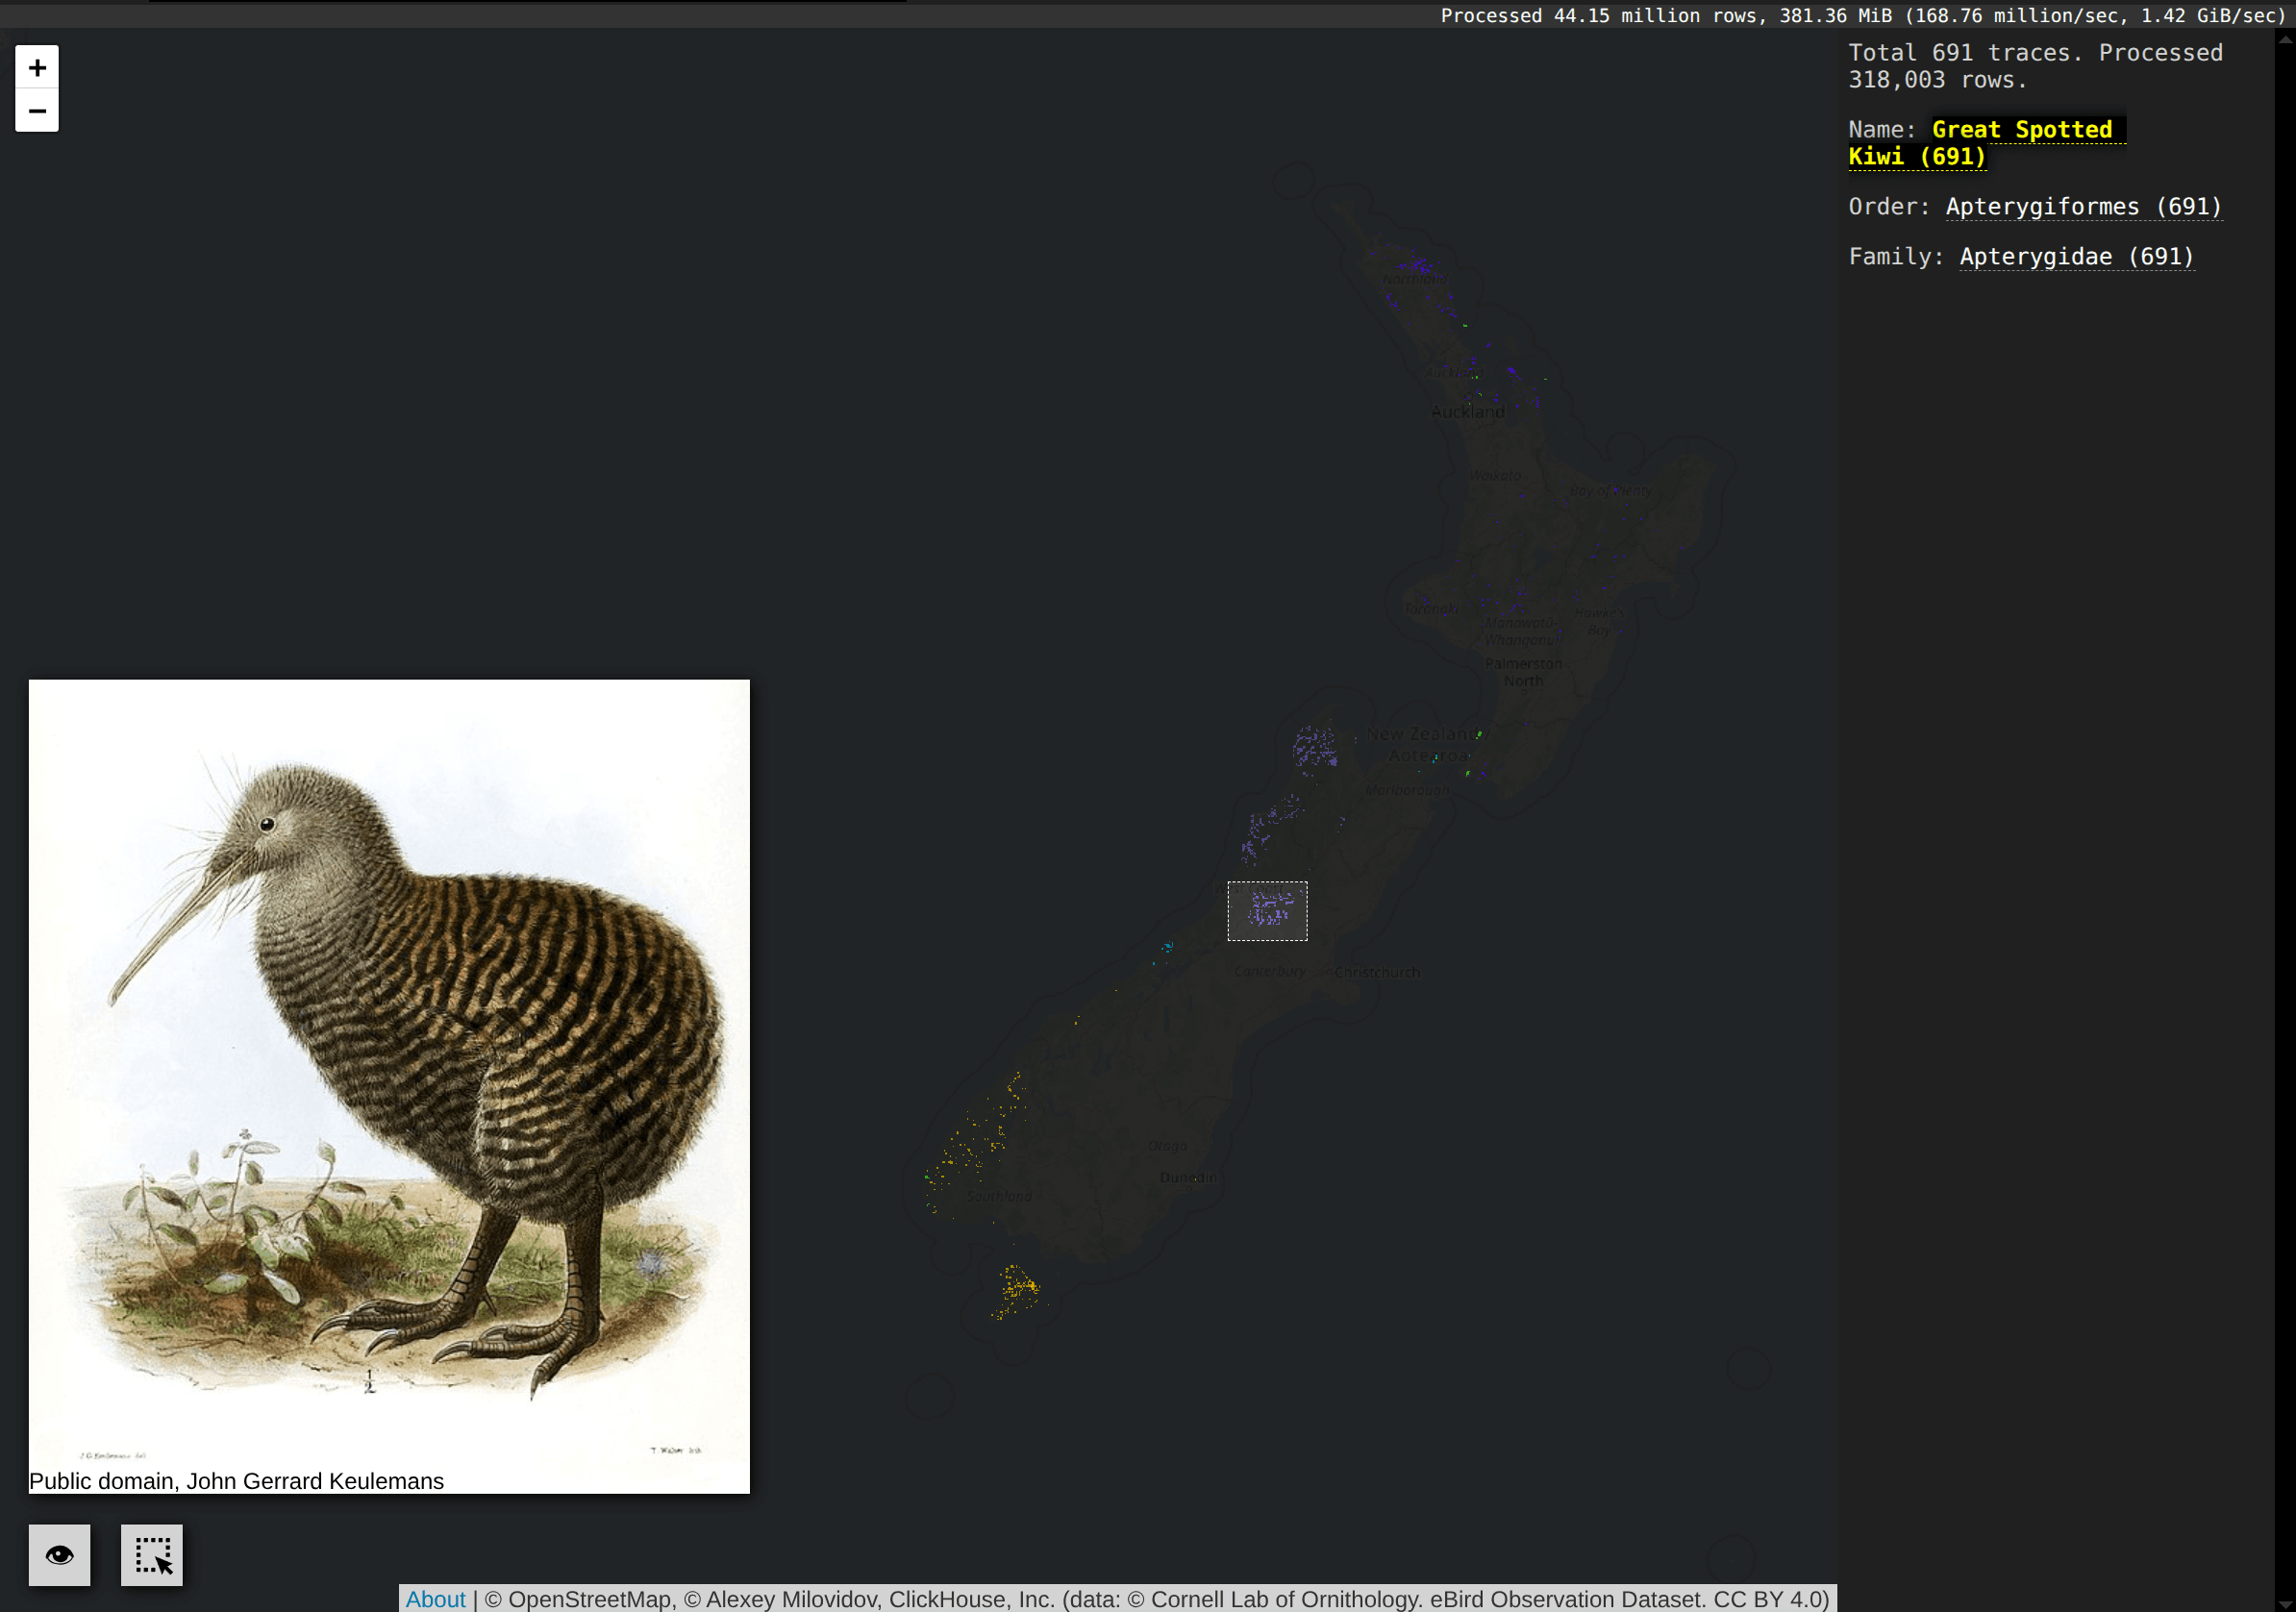
If you see this bird, you'll have no regrets!
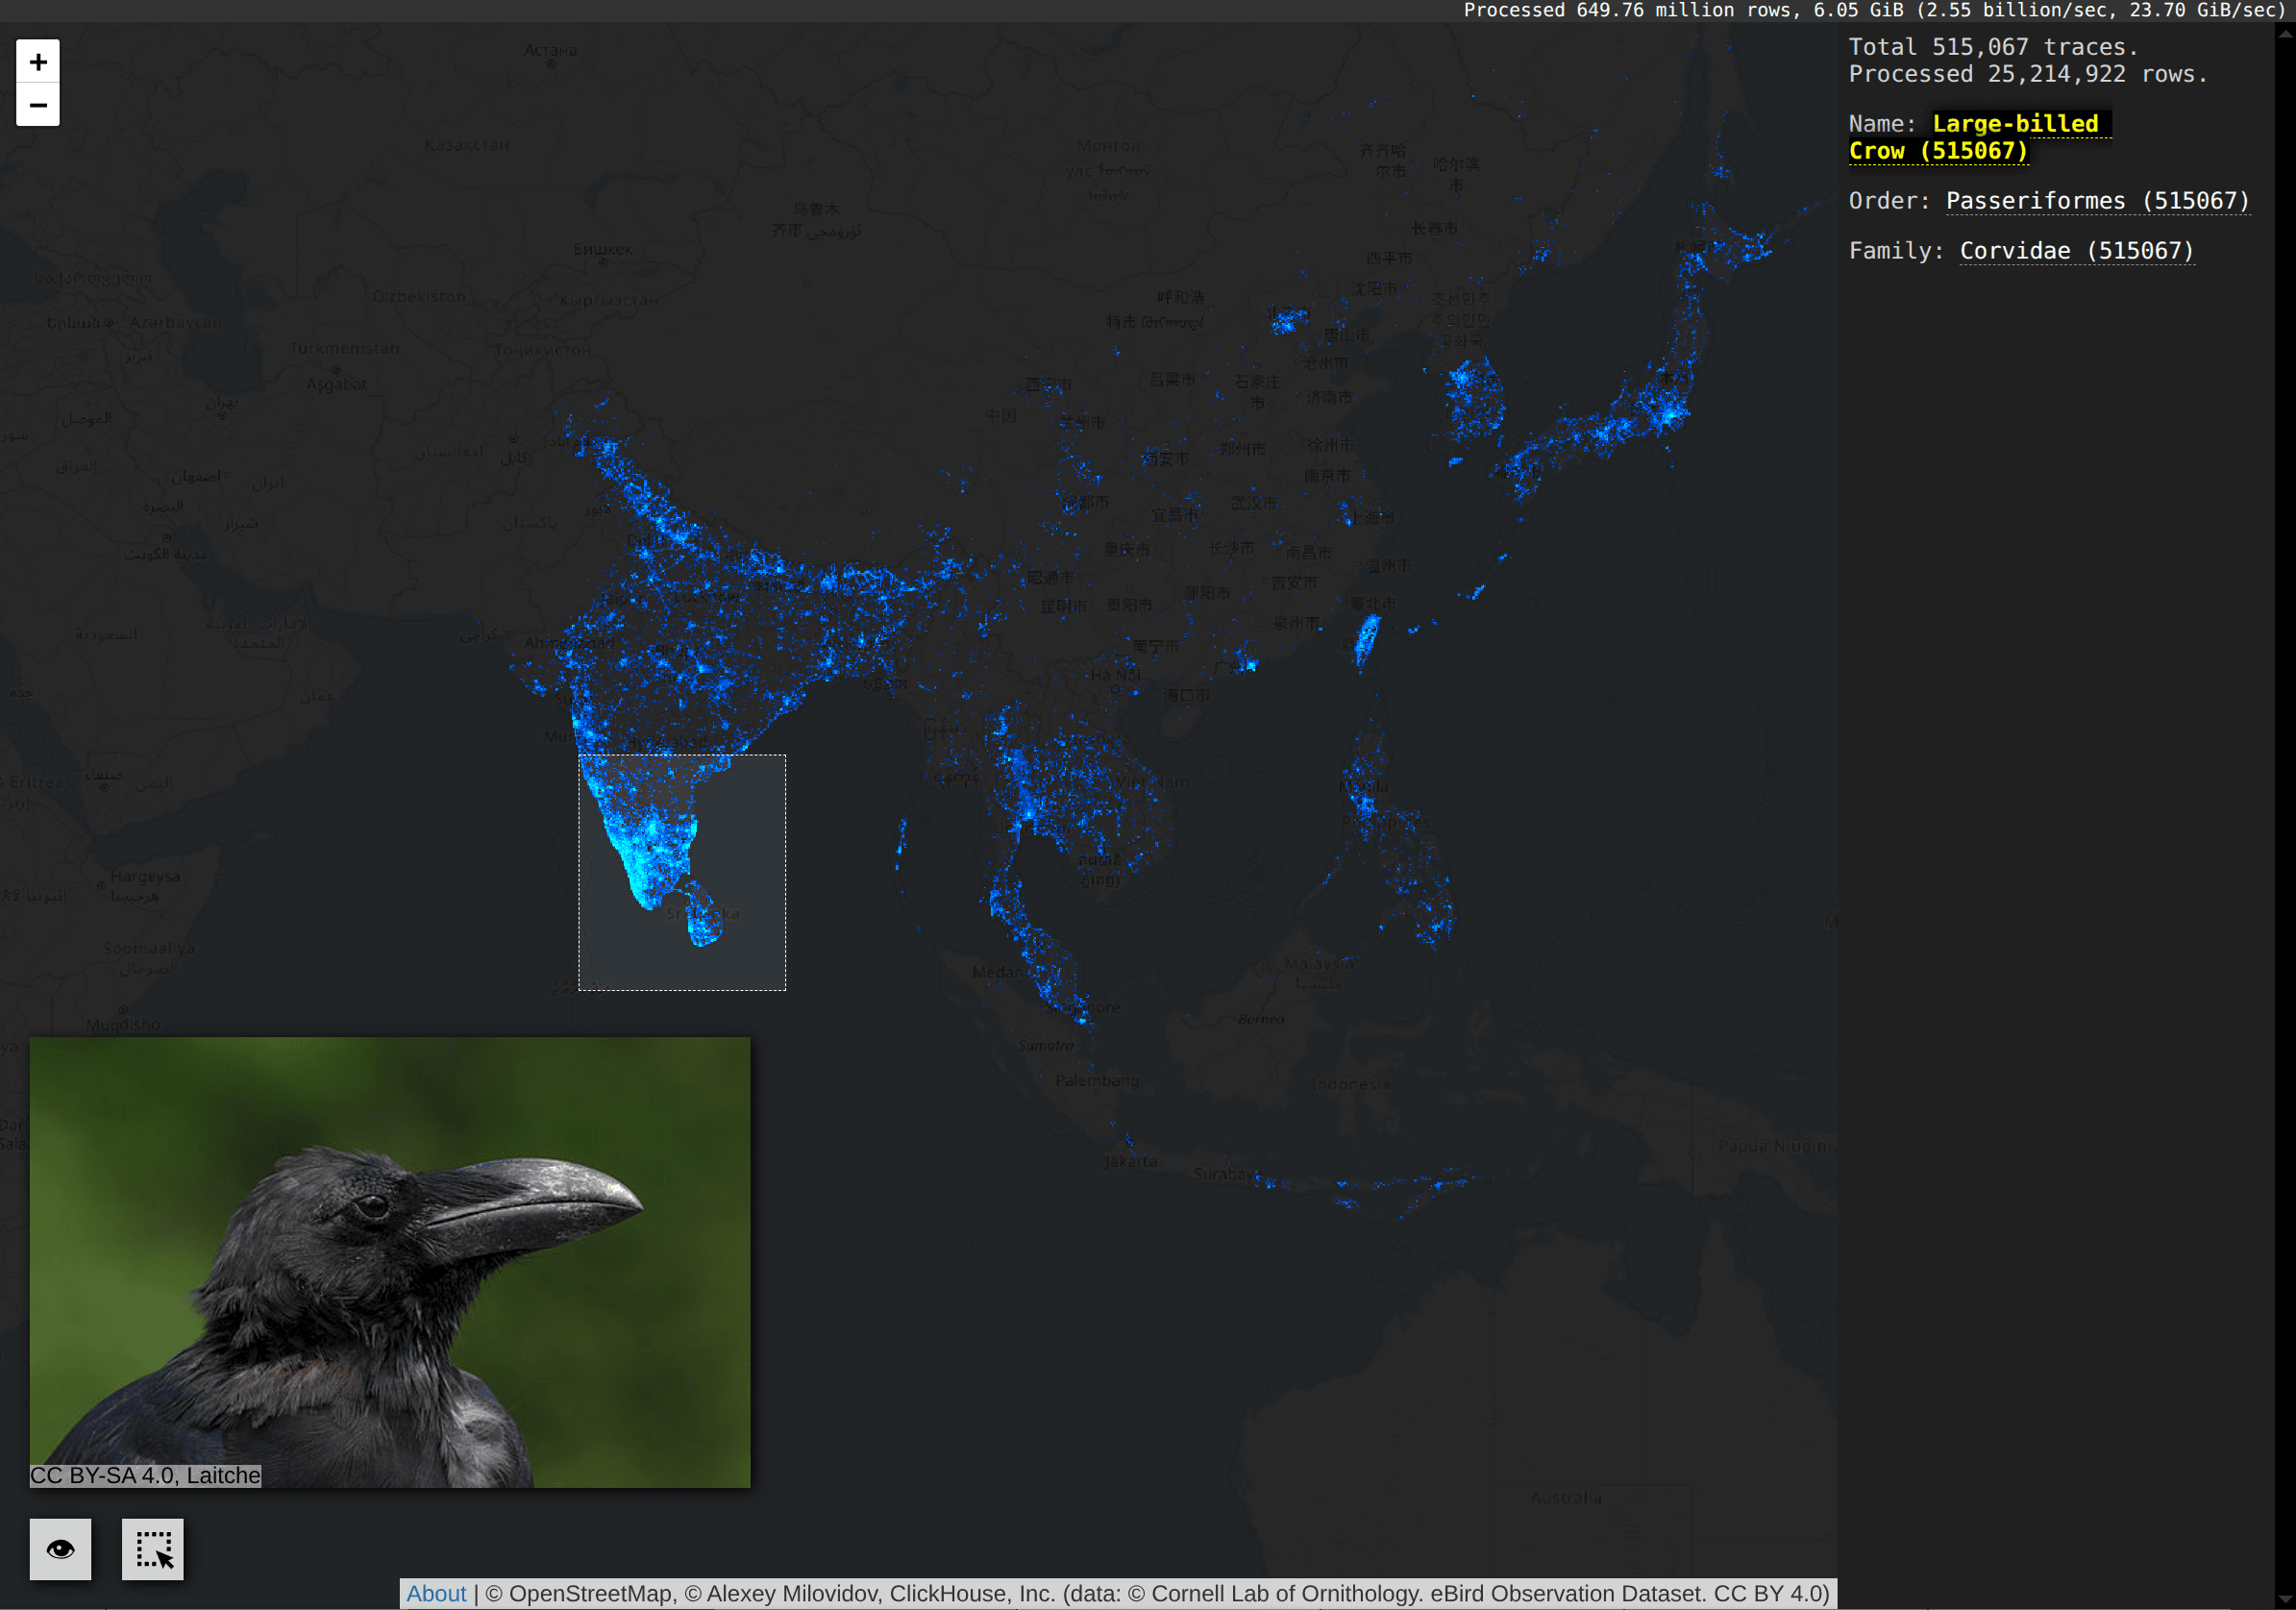
This crow lives only in Asia:
Comparison with other tools #
eBird provides its own basic visualization on a map, but it is not as interactive and provides no such detail into the data and no direct SQL queries.
Bottomline #
ClickHouse is a good option for analytics on large-scale geographical datasets. The eBird dataset has 1.5 billion records, while the ADS-B dataset has 130 billion records and counting. ClickHouse customers use the service with datasets over tens of trillions of records. ClickHouse makes large datasets fly!
Reference: eBird. 2021. eBird: An online database of bird distribution and abundance [web application]. eBird, Cornell Lab of Ornithology, Ithaca, New York. Available: https://www.ebird.org. (Accessed: June 1st, 2025).