The Story of SigNoz
When we started in early 2021, there was no tool that had a complete Application Performance Monitoring (APM) experience. We started with Application performance metrics, primarily focusing on out-of-the-box metrics like RED metrics and 99th percentile latency for applications.
Tools such as Prometheus existed, but these were primarily helpful for infrastructure metrics. While Prometheus itself was the default if you wanted to monitor Kubernetes metrics, significant effort was required to compute application metrics like p99 latency for your APIs.
Meanwhile, the Elasticsearch, Logstash, and Kibana stacks specialized in log collection, with limited support for metrics. This huge gap between what Prometheus and the ELK ecosystem provided and the experience that closed-source products such as Datadog provided was significant.
As developers, we preferred an open-source model where a community could support and contribute to the project and from which we could learn. This led us to develop and release Signoz, an open-source APM solution powered by ClickHouse.
Why we chose ClickHouse as the Observability backend
When we launched our initial version of Signoz in Feb 2021, we started with Druid as the data store. Understanding that Observability is just another analytics use case, we knew columnar OLAP data stores would be the most suitable data store.
We evaluated Druid, Pinot, and ClickHouse. At the time, Pinot was still new, Druid was used by many big companies like Lyft, and ClickHouse was somewhere in between.
Based on market adoption at the time, we started with Druid.
We got many comments in our HN post that Druid may be tough to run. We also started seeing users in the open-source community facing issues with running Druid, especially for single-machine or single-node deployments.
We realized that people want to try a new open-source product on their laptop or a single node machine, progressing to the pain of provisioning larger clusters once they were satisfied with the experience.
As a result, we started looking for data stores that can run even with low RAM and CPU but can also scale well for higher workloads. After checking out ClickHouse, we found that it is easy to get started but also performs well at scale.
Hence we started using ClickHouse as our main data store.
Why OpenTelemetry
When we started working on SigNoz in early 2021, OpenTelemetry was still a nascent project. Only the trace specification and SDK were stable, while logs and metrics were still in progress. 2 years later, all of the key signals for Observability - Metrics, Traces, and Logs have been declared as stable.
Despite the project being in its infancy, it was obvious to us that it represented the future of Observability data collection. It made intuitive sense to us to have a common instrumentation layer for SDKs, which other products can consume to visualize and show insights from. Also, it would allow companies that used OpenTelemetry not to be vendor locked-in. This was a big problem companies faced, as adopting closed-source telemetry tools often leads to vendor lock-in through proprietary query languages and opaque pricing.
Hence, we took an early bet on OpenTelemetry.
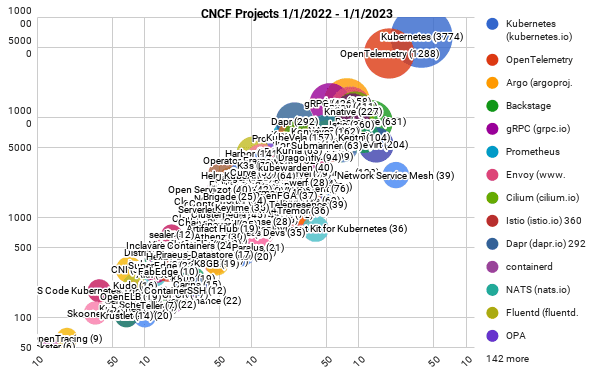
Today, OpenTelemetry is ubiquitous. It is now the second most active project in the CNCF ecosystem, right after Kubernetes. Many big companies like eBay have shifted their Observability stack to OpenTelemetry [2]
We think the standardization of telemetry data format, which OpenTelemetry has enabled, will create a much larger ecosystem of tooling. We expect new frameworks and languages supporting OpenTelemetry as the default format in which data is emitted to emerge, such as ClickHouse emitting data in OpenTelemetry format and Traefik adding Otel support. Given these increasing volumes of OpenTelemetry formatted data, we hope SigNoz, as an open-source backend, will be useful to the community to get started.
What makes SigNoz special
Till now, most open-source tools in the Observability ecosystem have been focused on a specific use case, e.g., Prometheus focuses on metrics, Jaeger focuses only on traces, and Elastic is primarily used for logging.
While these tools are great in themselves, we think there is a lot of value in having all three key signals for Observability - metrics, traces, and logs in a single pane. This enables much easier correlation between signals, and because the metrics, traces, and logs features are part of a single application, it is much easier to run and manage. The architecture is much simpler compared to a stack such as Grafana, where you have to run a different system for each data type and combine them together.
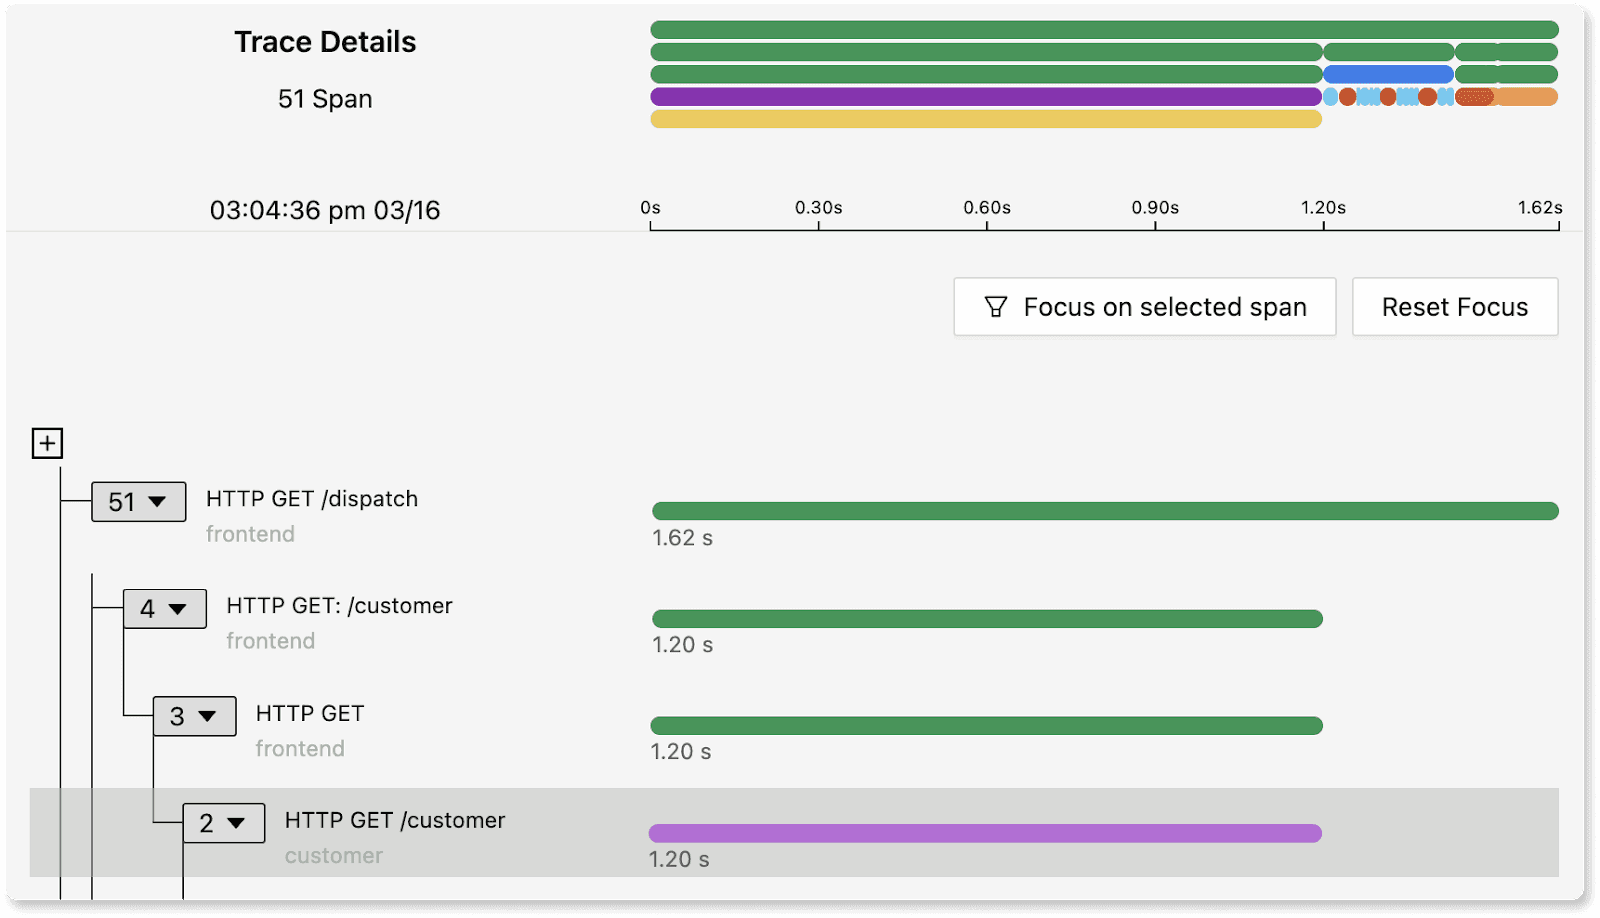
SigNoz also comes with a user interface and visualization layer, which is custom-built for Observability. The user interface enables click-through and deeper drill-downs much faster, allowing users to identify the root cause of an issue efficiently.
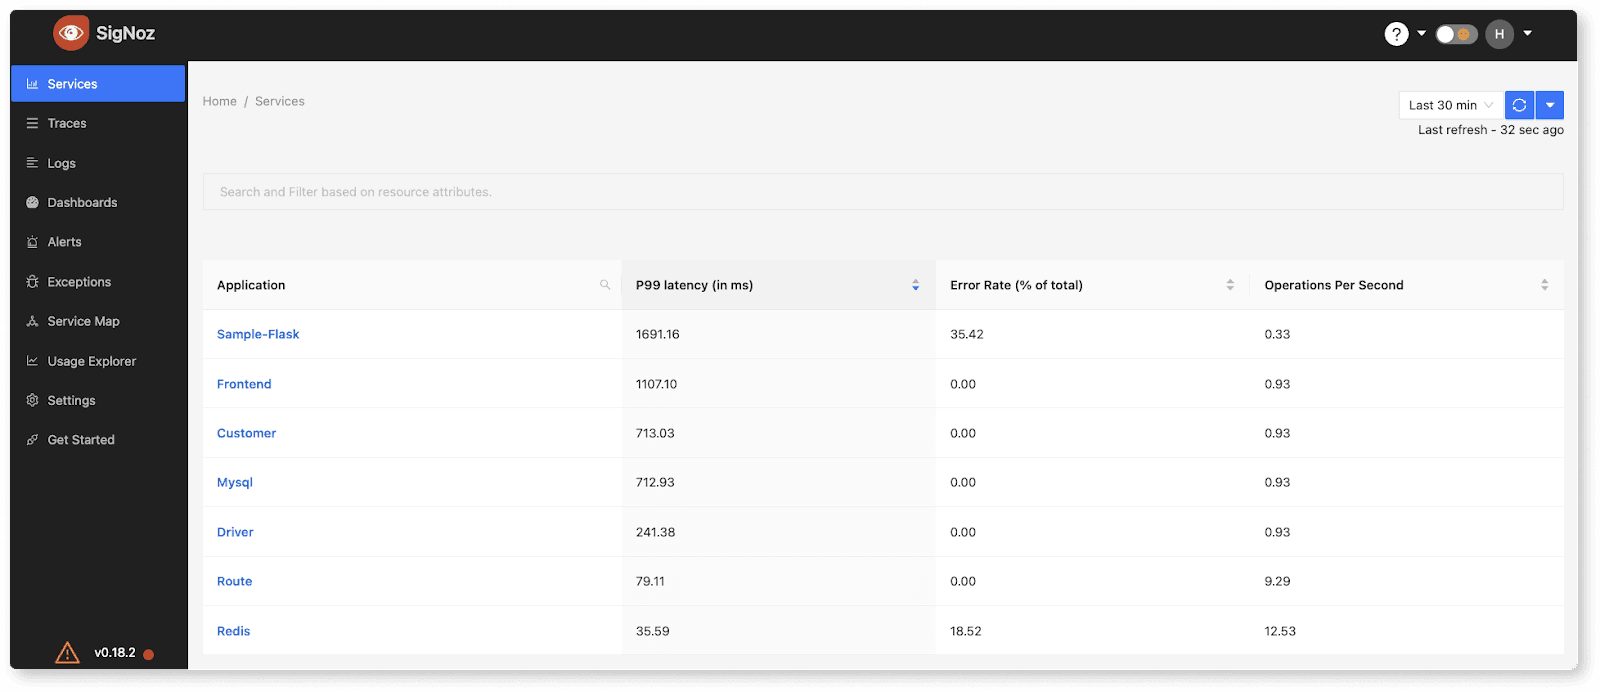
Out of the box services list page in SigNoz
Also, because SigNoz uses ClickHouse as the main data store, we can offer superior performance for high-cardinality data. We think that Observability is primarily an analytics use case where you want to ask a lot of questions from your telemetry data to obtain insights on potential causes of an issue. Limits on cardinality, or needing to consider it as a scaling dimension, felt unnecessary, complex, and restrictive.
Recently, folks such as Uber and Cloudflare have also moved to ClickHouse for their log analytics use cases, giving further support to ClickHouse being the optimal store for this data type.
Getting started today
Getting started with SigNoz is very simple. You can get started either on a single node or a Kubernetes cluster.
The default SigNoz installation automatically deploys a ClickHouse instance for a simple getting-started experience.
However, if you already have ClickHouse running, you can follow the instructions here to set up SigNoz and reuse your cluster.
If you are running SigNoz in a Kubernetes cluster, you can use the following steps:
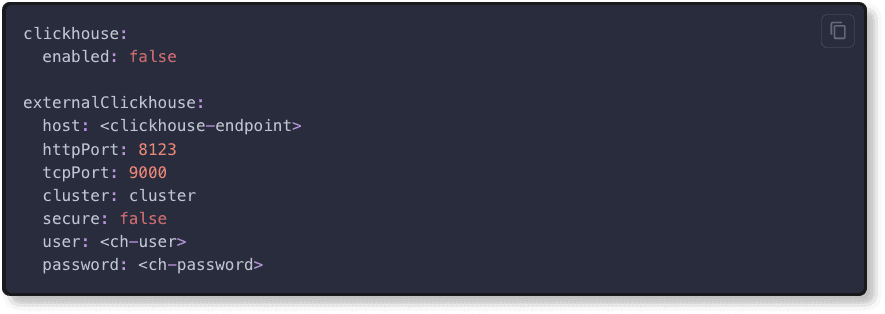
In Kubernetes, we will update override-values.yaml file to use an external ClickHouse.
At first, we will disable the default ClickHouse instance by setting clickhouse.enabled to false. Then, we will include the external ClickHouse information in the externalClickhouse section.
override-values.yaml
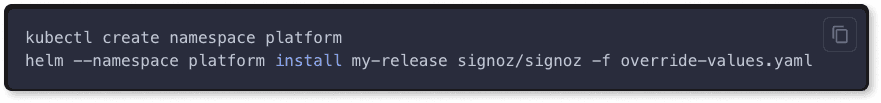
To install SigNoz using the above configuration, run the following command:
References
[1] A look at the 2022 velocity of CNCF, Linux Foundation, and top 30 open source projects


