This post is translated from Didi Tech, the author is Yuankai Zhong.
Didi is a globally distributed mobile transportation platform, providing comprehensive travel services such as taxis, ride-hailing, and designated driving to more than 450 million users. At Didi, we use ClickHouse for the storage of logs. In this post, we discuss our successful migration from Elasticsearch.
Since 2020, ClickHouse has been widely used within Didi, serving core platforms and businesses such as ride-hailing and log retrieval. This article explores the technical exploration of migrating Didi's log retrieval from Elasticsearch to ClickHouse, reducing the cost of our Observability hardware costs by over 30%.
Background
Previously, Didi's logs were primarily stored in Elasticsearch (ES). In order to provide full-text search, Elasticsearch relies on functionality such as tokenization and inverted indexing. These unfortunately lead to significant bottlenecks in write throughput. Additionally, ES requires storage for raw text and inverted indexes, which increase storage costs and result in high memory requirements. With the continuous growth of Didi's data volume, ES's performance could no longer meet our requirements.
In pursuit of reducing costs and improving efficiency, we began to seek new storage solutions. After research, we decided to adopt ClickHouse as the storage support for Didi's internal logs. We understood that several companies in the industry, such as JD.com, Ctrip, and Bilibili, were also successful with using ClickHouse to build log storage systems, giving us confidence in undertaking a migration.
Challenge
The main challenges we faced were as follows:
- Large Data Volume: We generate petabyte-level log data every day, requiring the storage system to stably support real-time writing and storage of petabyte-scale data.
- Diverse Query Scenarios: Various query scenarios, including range queries, fuzzy queries, and sorting, require scanning large amounts of data within a given time period, with query results needing to be returned within seconds.
- High QPS (Queries Per Second): With petabyte-scale data, trace queries need to meet high QPS requirements.
Why ClickHouse
ClickHouse meets these requirements through the following features:
- Support for Large Data Volumes: ClickHouse's distributed architecture supports dynamic scaling, allowing it to handle massive data storage needs.
- Write Performance: ClickHouse's MergeTree tables have a high write speed, offering maximum throughput with minimal bottlenecks.
- Query Performance: ClickHouse supports partitioned and sorted indexes, resulting in highly efficient retrieval. It can scan millions of rows of data per second on a single machine.
- Storage Cost: ClickHouse uses columnar storage, which offers high data compression ratios. Additionally, it can leverage HDFS for hot and cold data separation, it further reduces storage costs.
Results
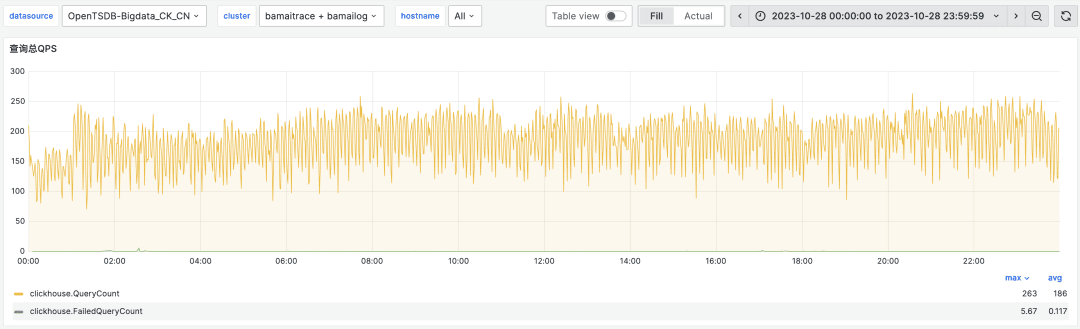
After a successful migration from Elasticsearch to ClickHouse, our ClickHouse logging cluster has now exceeded 400 physical nodes, with a peak writing traffic of over 40 GB/s. This supports approximately 15 million queries per day, with a peak QPS of about 200. Compared to Elasticsearch, the machine cost of ClickHouse has decreased by 30%.
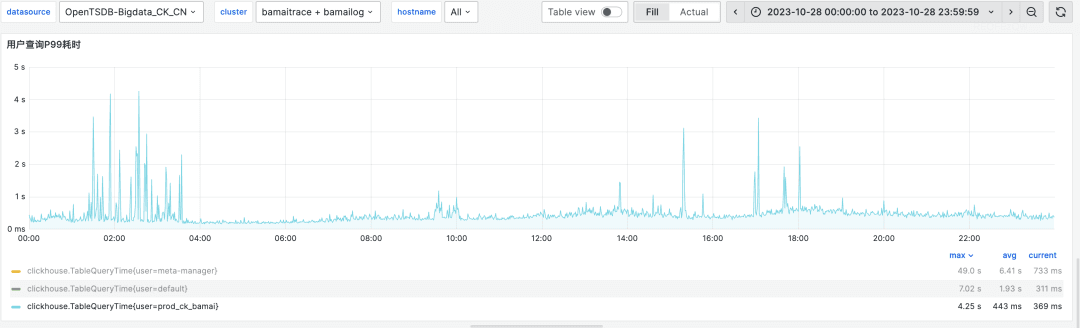
The query speed has improved by about 4 times compared to Elasticsearch. The following graph shows the P99 query latency for our bamailog and bamaitrace clusters, with most queries completing within 1 second.
Architectural upgrade

Under the old storage architecture, log data needed to be written to both Elasticsearch and HDFS, with ES providing real-time queries and Spark analyzing data on the latter. This design required users to maintain two independent writing pipelines, doubling resource consumption and increasing operational complexity.
In the newly upgraded storage architecture, ClickHouse replaces ES's role, with separate Log and Trace clusters. The Log cluster is dedicated to storing detailed log data, while the Trace cluster focuses on storing trace data. These two clusters are physically isolated from one other, effectively preventing high-consumption queries (such as LIKE queries) on logs from interfering with high-QPS queries on traces.
Log data is directly written into the Log cluster by Flink, with trace information extracted from logs through materialized views. The results of these materialized views are written to the Trace cluster, using asynchronous writes through distributed tables. This process not only separates log and trace data but also allows background threads in the Log cluster to periodically synchronize cold data to HDFS.
The new architecture involves only a single writing pipeline, with all operations related to cold storage of log data in HDFS and the separation of log and trace handled by ClickHouse. This shields users from underlying details and simplifies operational processes.
Considering cost and the characteristics of log data, both the Log and Trace clusters are deployed in a single-replica mode. The largest Log cluster has over 300 nodes, while the Trace cluster has over 40 nodes.
Storage design
The storage design is the most critical part for performance improvements, without which ClickHouse's powerful retrieval performance could not be fully utilized. Drawing inspiration from time-series databases, we adjusted the log time to be rounded to the nearest hour and arranged the data in storage in chronological order by specifying this in the ordering key. This way, when performing queries with other sorting keys, the desired data can be quickly located.
Below we present the storage design scheme we developed for Log tables, Trace tables, and Trace index tables, based on the characteristics of log queries and ClickHouse execution logic.
Log table
The Log table (located in the Log cluster) is intended to provide storage and query services for detailed logs and is directly written into by Flink after consuming data from Pulsar. Each log service corresponds to a Log table, so the entire Log cluster may contain thousands of Log tables. The largest tables may generate PB-level data daily. Given the challenges faced by the Log cluster, such as numerous table counts, large data volumes per table, and the need for cold and hot data separation, the following are the design ideas for the Log table:
CREATE TABLE ck_bamai_stream.cn_bmauto_local (
`logTime` Int64 DEFAULT 0,
`logTimeHour` DateTime MATERIALIZED toStartOfHour(toDateTime(logTime / 1000)),
`odinLeaf` String DEFAULT '',
`uri` LowCardinality(String) DEFAULT '',
`traceid` String DEFAULT '',
`cspanid` String DEFAULT '',
`dltag` String DEFAULT '',
`spanid` String DEFAULT '',
`message` String DEFAULT '',
`otherColumn` Map(String, String),
`_sys_insert_time` DateTime MATERIALIZED now()
)
ENGINE = MergeTree
PARTITION BY toYYYYMMDD(logTimeHour)
ORDER BY (logTimeHour, odinLeaf, uri, traceid)
TTL _sys_insert_time + toIntervalDay(7), _sys_insert_time + toIntervalDay(3) TO VOLUME 'hdfs'
SETTINGS index_granularity = 8192, min_bytes_for_wide_part = 31457280-
Partition key: While most SQL queries only retrieve data for one hour, partitioning by hour would result in too many parts and an abundance of small files in HDFS. Therefore, partitioning is done by day instead of by hour.
-
Sorting key: To quickly locate data for a specific hour, a new field called
logTimeHourwas created by rounding the log time to the nearest hour. This is then used as the primary sorting key. Since most queries specifyodinLeaf,uri, andtraceid, these columns are used as 2nd, 3rd, and 4th sorting keys respectively, based on their cardinality from smallest to largest. This means querying data for a specifictraceidonly requires reading a small number of index granules. With this design, all equality queries can be achieved in milliseconds. -
Map columns: Map types were introduced to implement dynamic schemes, allowing columns that are not used for filtering to be placed into a Map. This effectively reduces the number of part files and prevents the occurrence of numerous small files on HDFS.
Trace table
The Trace table, located within the Trace cluster, is designed to facilitate high-QPS queries. Data for this table is extracted from the Log table using materialized views. These write to the Logs cluster containing the Log table through distributed tables.
The challenge with the Trace table lies in achieving fast query speeds and supporting high QPS. Below are the design considerations for the Trace table:
CREATE TABLE ck_bamai_stream.trace_view
(
`traceid` String,
`spanid` String,
`clientHost` String,
`logTimeHour` DateTime,
`cspanid` AggregateFunction(groupUniqArray, String),
`appName` SimpleAggregateFunction(any, String),
`logTimeMin` SimpleAggregateFunction(min, Int64),
`logTimeMax` SimpleAggregateFunction(max, Int64),
`dltag` AggregateFunction(groupUniqArray, String),
`uri` AggregateFunction(groupUniqArray, String),
`errno` AggregateFunction(groupUniqArray, String),
`odinLeaf` SimpleAggregateFunction(any, String),
`extractLevel` SimpleAggregateFunction(any, String)
)
ENGINE = AggregatingMergeTree
PARTITION BY toYYYYMMDD(logTimeHour)
ORDER BY (logTimeHour, traceid, spanid, clientHost)
TTL logTimeHour + toIntervalDay(7)
SETTINGS index_granularity = 1024- AggregatingMergeTree: The Trace table utilizes the AggregatingMergeTree engine, which aggregates data based on
traceid. This aggregation greatly reduces the volume of trace data, achieving a compression ratio of 5:1 and significantly improving retrieval speed. - Partitioning and Sorting Keys: Similar to the design of the Log table.
index_granularity: This parameter controls the granularity of sparse indexes, with a default value of 8192. Reducing this parameter helps minimize the scanning of non-matching data within granules, thereby speeding up ‘traceid’ retrieval.
Trace Index tables
The main purpose of the Trace index tables is to accelerate the query speed for fields such as order_id, driver_id, and driver_phone by allowing fast lookup of a traceid. This traceid can in turn be used to query the above Trace table.
To achieve this, we create an aggregate materialized view for the fields for which query speed needs to be improved. The data is extracted from the Log table to the Trace index table through these materialized view triggers. These tables can be used to quickly identify the logTimeHour and traceid for a specific column - order_id in the example below, before querying the Trace table.
The statements to create a Trace index table focused on providing fast lookup by order_id:
CREATE TABLE orderid_traceid_index_view
(
`order_id` String,
`traceid` String,
`logTimeHour` DateTime
)
ENGINE = AggregatingMergeTree
PARTITION BY logTimeHour
ORDER BY (order_id, traceid)
TTL logTimeHour + toIntervalDay(7)
SETTINGS index_granularity = 1024Next, we discuss the stability issues faced and their solutions during the migration to this architecture.
Challenges
When supporting a very large logging use case in ClickHouse, users must consider the massive write traffic and extremely large cluster sizes which will result. After a careful design process, we can stably handle peak traffic during key holidays. The following sections mainly introduce some of the challenges encountered and how they were addressed.
The fragmentation issues with small data in large clusters
In the Log cluster, 90% of Log tables have traffic lower than 10MB/s. If data from all tables is written to hundreds of nodes, it will lead to a significant fragmentation problem with small tables. This not only affects query performance, but also has a negative impact on the overall cluster performance and creates numerous small file issues when storing cold data to HDFS.
To address these challenges, we dynamically allocate writing nodes based on the traffic size of each table. The number of writing nodes assigned to each table ranges from 2 to the maximum number of nodes in the cluster, evenly distributed across the entire cluster. Flink obtains the list of writing nodes for each table through an interface and writes data to the corresponding ClickHouse nodes, effectively resolving the data dispersion problem in large-scale clusters.
Write throttling and performance improvements
During peak traffic periods and holidays for Didi, traffic often increases significantly. To avoid clusters being overloaded due to excessive traffic during these periods, we implemented write throttling functionality on Flink. This feature dynamically adjusts the traffic size of each table being written to the cluster. When the traffic exceeds the cluster limit, we can quickly reduce the write traffic of non-critical tables to alleviate cluster pressure and ensure that critical table writes and queries are not affected.
Simultaneously, to improve the performance of pulsing writes, we developed a Native Connector for Flink based on the native TCP protocol of ClickHouse. Compared to the HTTP protocol, the Native Connector has lower network overhead. Additionally, we have customized the serialization mechanism for data types to make it more efficient than the previous Parquet format. After enabling the Native Connector, the write latency rate decreased from 20% to 5%, resulting in an overall performance improvement of 1.2x.
Performance issues with HDFS hot and cold separation
We initially encountered several performance issues when using ClickHouse’s feature for using HDFS for storing cold data. This resulted in us making significant contributions to the HDFS hot and cold separation functionality:
- Slow Service Restart and High Sys CPU Usage: The slow service restart and high system CPU usage were attributed to poor concurrent reading performance of the libhdfs3 library, when loading metadata of Parts from HDFS during service restarts. This led to excessive system calls and exceptions being thrown when reaching the end of files. To mitigate this issue, improvements were made to the concurrent reading mechanism and metadata caching, resulting in a significant reduction in service restart time from 1 hour to 1 minute.
- Poor Write Performance for Historical Partition Data: When writing data to historical partitions, the data was directly written to HDFS instead of being persisted locally, resulting in poor write performance. Additionally, the data written directly to HDFS needed to be pulled back for local merge, further degrading merge performance. To improve this, optimizations were implemented to enhance write performance and streamline the merge process.
- Mapping of Part Paths and HDFS Paths via UUID: The mapping of local Part paths to HDFS paths using UUIDs resulted in all table data being stored under the same path in HDFS. This led to the limit of 1 million directory entries in HDFS being reached. To address this, a new mapping strategy was devised to distribute the data across multiple directories in HDFS, preventing the directory entry limit from being reached.
- Loss of File Path Mapping in Case of Node Failure: The file path mapping relationship was stored locally. In the event of node failure this information was at risk of being lost, leading to data loss on HDFS and the inability to delete the data. To mitigate this risk, mechanisms were put in place to ensure the persistence and resilience of file path mappings, even in the event of node failures.
Overall, these modifications and enhancements to the HDFS hot and cold separation functionality successfully resolved the issues encountered and improved the performance and reliability of the system.

Additionally, a new process was implemented to prevent historical data from being directly written to HDFS. Instead, data must first be written locally, merged, and then uploaded to HDFS. Furthermore, the storage path structure in HDFS was revamped. Previously, all data was stored under a single directory, but now it is partitioned based on cluster, shard, database, and table, with backup copies of local path mappings stored at the table level for recovery in case of node failure. This ensures that historical data is processed and stored in a more organized and resilient manner, improving overall system reliability and data management efficiency.
Summary
Migrating logs from Elasticsearch to ClickHouse has not only significantly reduced storage costs but also provided us with a faster querying experience. With the changes that we described above, both the stability and performance of the system have significantly improved. However, significant cluster resource consumption still occurs when handling fuzzy queries. In the future, we will continue to explore techniques such as secondary indexing, ZSTD compression, and storage and computation separation to further improve log retrieval performance.
Get started with ClickHouse Cloud today and receive $300 in credits. At the end of your 30-day trial, continue with a pay-as-you-go plan, or contact us to learn more about our volume-based discounts. Visit our pricing page for details.


